
|
|||||
|
 | |
| |
| |
| |
| |
| |
|
Gene: PIK3R4 |
Gene summary for PIK3R4 |
| Gene information | Species | Human | Gene symbol | PIK3R4 | Gene ID | 30849 |
| Gene name | phosphoinositide-3-kinase regulatory subunit 4 | |
| Gene Alias | VPS15 | |
| Cytomap | 3q22.1 | |
| Gene Type | protein-coding | GO ID | GO:0000910 | UniProtAcc | Q99570 |
Top |
Malignant transformation analysis |
| Identification of the aberrant gene expression in precancerous and cancerous lesions by comparing the gene expression of stem-like cells in diseased tissues with normal stem cells |
| Entrez ID | Symbol | Replicates | Species | Organ | Tissue | Adj P-value | Log2FC | Malignancy |
| 30849 | PIK3R4 | CCI_1 | Human | Cervix | CC | 1.31e-04 | 2.92e-01 | 0.528 |
| 30849 | PIK3R4 | CCI_2 | Human | Cervix | CC | 3.74e-10 | 6.75e-01 | 0.5249 |
| 30849 | PIK3R4 | CCI_3 | Human | Cervix | CC | 4.50e-13 | 6.31e-01 | 0.516 |
| 30849 | PIK3R4 | LZE2T | Human | Esophagus | ESCC | 2.12e-02 | 3.79e-01 | 0.082 |
| 30849 | PIK3R4 | LZE4T | Human | Esophagus | ESCC | 2.88e-09 | 3.18e-01 | 0.0811 |
| 30849 | PIK3R4 | LZE7T | Human | Esophagus | ESCC | 1.49e-08 | 4.99e-01 | 0.0667 |
| 30849 | PIK3R4 | LZE8T | Human | Esophagus | ESCC | 3.40e-02 | 1.20e-01 | 0.067 |
| 30849 | PIK3R4 | LZE24T | Human | Esophagus | ESCC | 5.37e-03 | 1.56e-01 | 0.0596 |
| 30849 | PIK3R4 | P1T-E | Human | Esophagus | ESCC | 3.17e-04 | 2.41e-01 | 0.0875 |
| 30849 | PIK3R4 | P2T-E | Human | Esophagus | ESCC | 8.93e-35 | 6.01e-01 | 0.1177 |
| 30849 | PIK3R4 | P4T-E | Human | Esophagus | ESCC | 9.97e-10 | 2.18e-01 | 0.1323 |
| 30849 | PIK3R4 | P5T-E | Human | Esophagus | ESCC | 3.67e-07 | 9.39e-02 | 0.1327 |
| 30849 | PIK3R4 | P8T-E | Human | Esophagus | ESCC | 3.77e-11 | 2.33e-01 | 0.0889 |
| 30849 | PIK3R4 | P9T-E | Human | Esophagus | ESCC | 8.65e-10 | 1.40e-01 | 0.1131 |
| 30849 | PIK3R4 | P10T-E | Human | Esophagus | ESCC | 1.62e-15 | 2.81e-01 | 0.116 |
| 30849 | PIK3R4 | P12T-E | Human | Esophagus | ESCC | 2.41e-11 | 2.59e-01 | 0.1122 |
| 30849 | PIK3R4 | P15T-E | Human | Esophagus | ESCC | 1.29e-13 | 3.20e-01 | 0.1149 |
| 30849 | PIK3R4 | P16T-E | Human | Esophagus | ESCC | 7.35e-15 | 3.23e-01 | 0.1153 |
| 30849 | PIK3R4 | P20T-E | Human | Esophagus | ESCC | 6.36e-14 | 3.05e-01 | 0.1124 |
| 30849 | PIK3R4 | P21T-E | Human | Esophagus | ESCC | 5.52e-15 | 3.29e-01 | 0.1617 |
| Page: 1 2 3 |
| Tissue | Expression Dynamics | Abbreviation |
| Cervix | 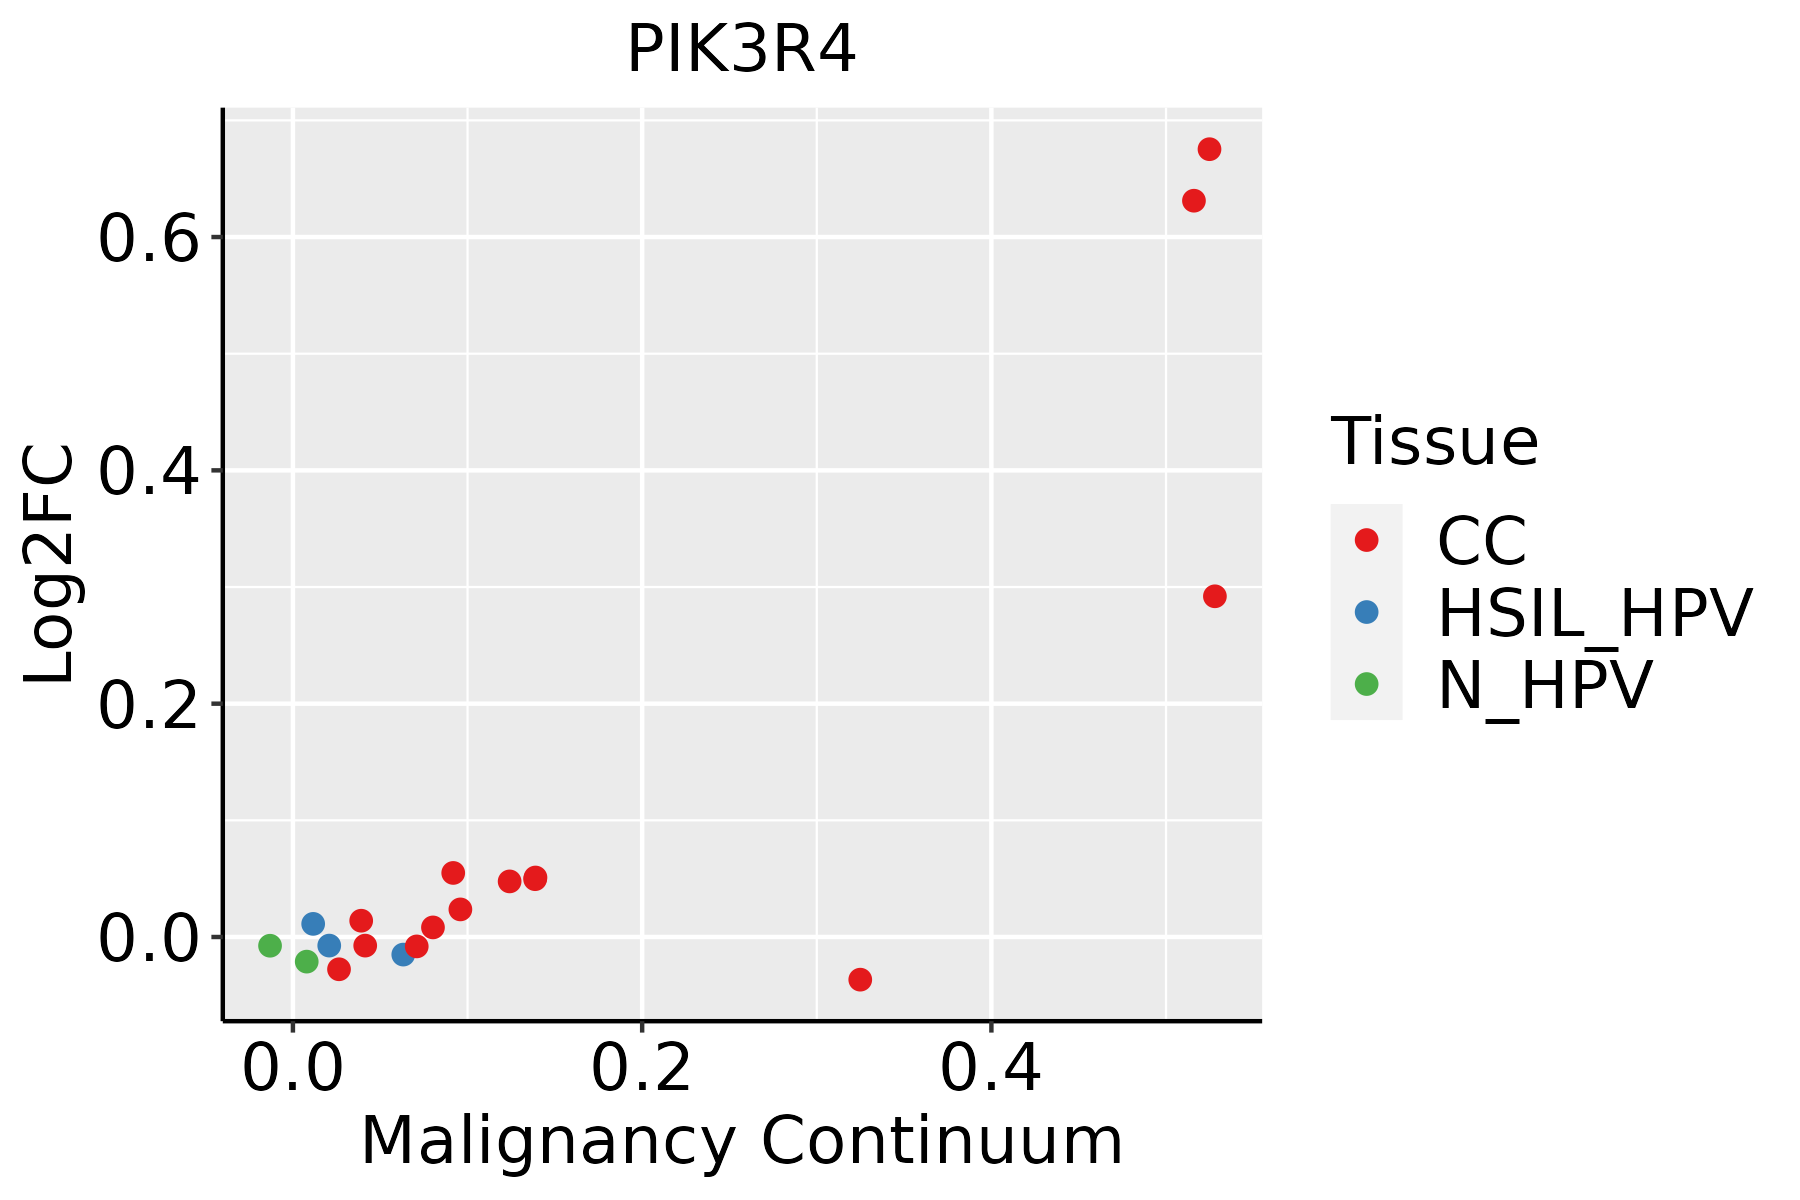 | CC: Cervix cancer |
| HSIL_HPV: HPV-infected high-grade squamous intraepithelial lesions | ||
| N_HPV: HPV-infected normal cervix | ||
| Esophagus | 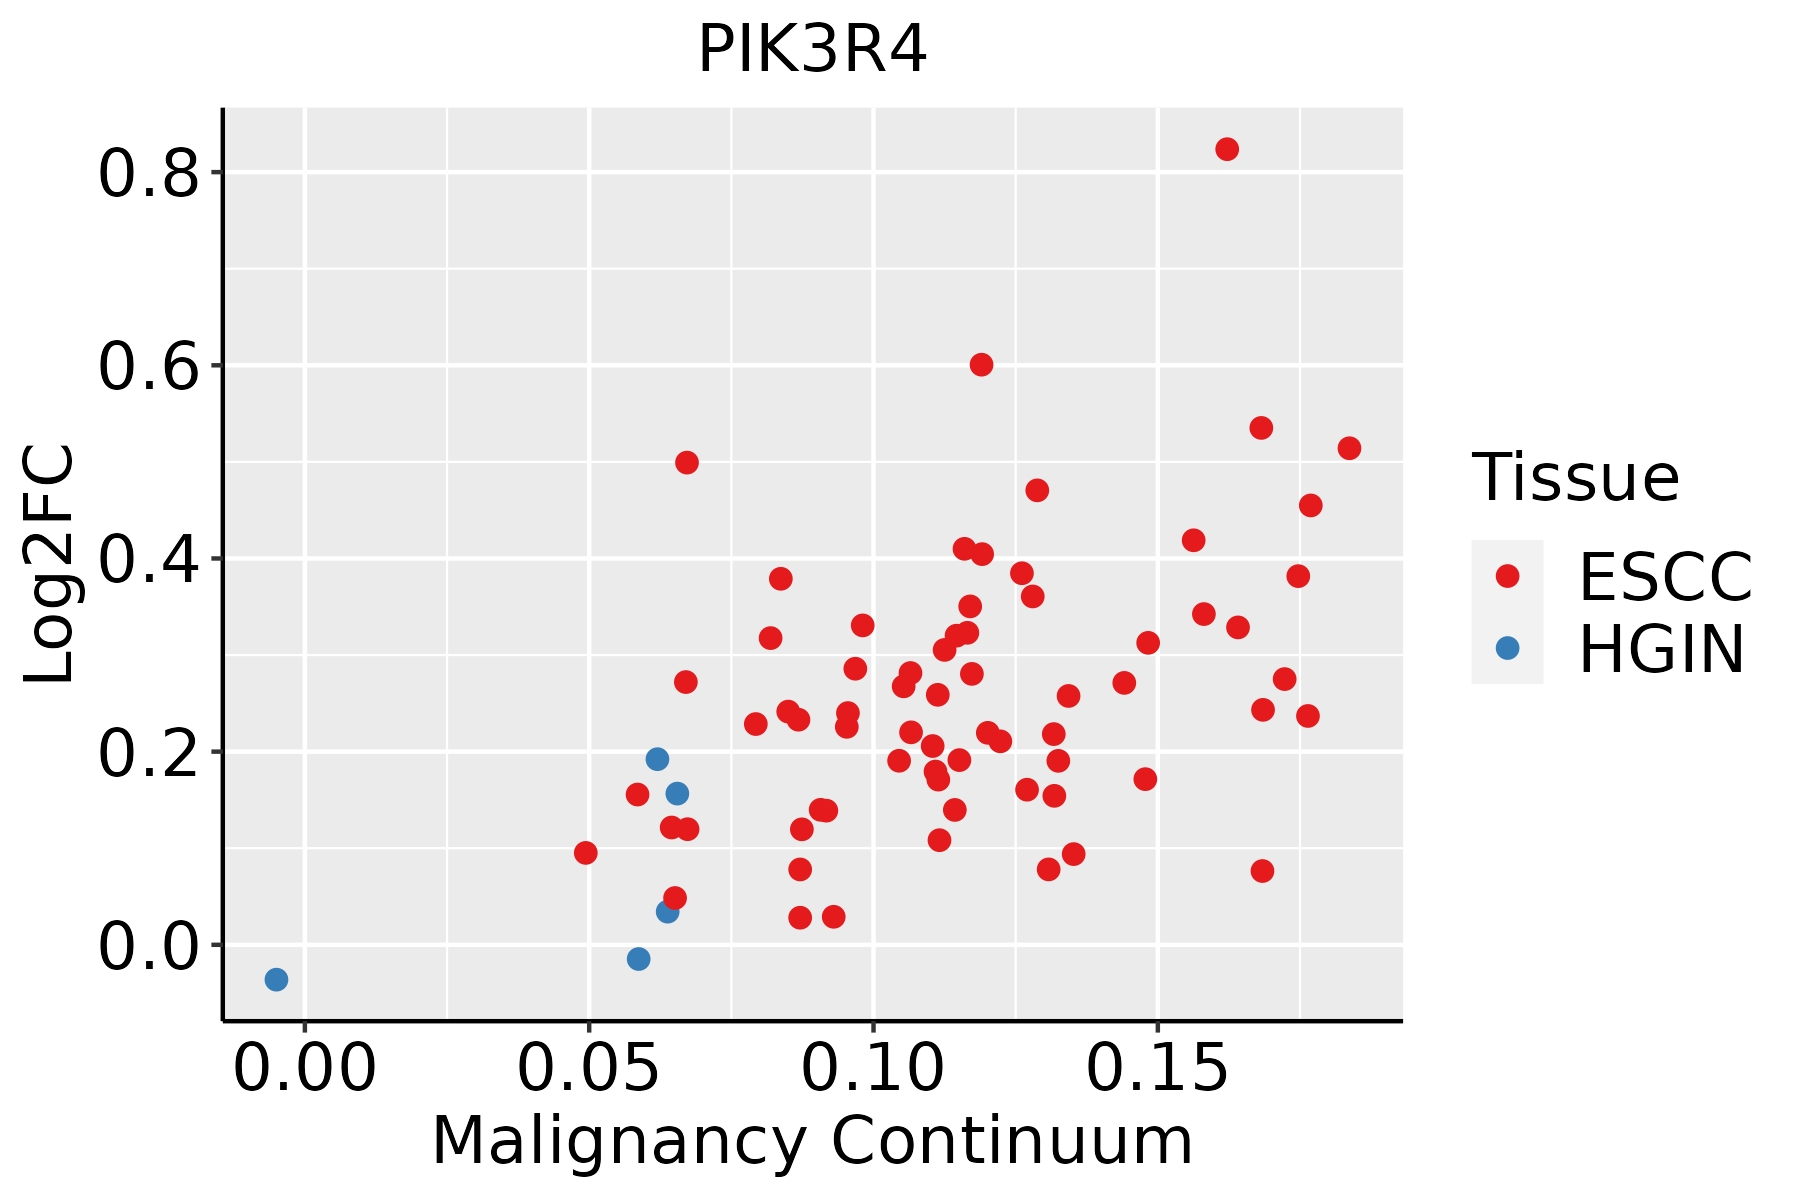 | ESCC: Esophageal squamous cell carcinoma |
| HGIN: High-grade intraepithelial neoplasias | ||
| LGIN: Low-grade intraepithelial neoplasias |
| ∗log2FC in expression of this searched gene in stem-like cells from each diseased tissue sample relative to stem-like cells in normal samples in each tissue plotted against the malignancy continuum. Samples are colored based on if they are from different disease stage. |
Top |
Malignant transformation related pathway analysis |
| Find out the enriched GO biological processes and KEGG pathways involved in transition from healthy to precancer to cancer |
| Tissue | Disease Stage | Enriched GO biological Processes |
| Colorectum | AD |  |
| Colorectum | SER |  |
| Colorectum | MSS |  |
| Colorectum | MSI-H |  |
| Colorectum | FAP |  |
| ∗Top 15 enriched GO BP terms are showed in the bar plot of each disease state in each tissue. Each row represents a significant GO biological process which is colored according to the -log10(p.adjust). |
| Page: 1 2 3 4 5 6 7 8 9 |
| GO ID | Tissue | Disease Stage | Description | Gene Ratio | Bg Ratio | pvalue | p.adjust | Count |
| GO:00725949 | Cervix | CC | establishment of protein localization to organelle | 99/2311 | 422/18723 | 1.23e-10 | 2.11e-08 | 99 |
| GO:007149610 | Cervix | CC | cellular response to external stimulus | 78/2311 | 320/18723 | 1.82e-09 | 1.98e-07 | 78 |
| GO:003367410 | Cervix | CC | positive regulation of kinase activity | 101/2311 | 467/18723 | 8.66e-09 | 7.22e-07 | 101 |
| GO:00316689 | Cervix | CC | cellular response to extracellular stimulus | 59/2311 | 246/18723 | 3.03e-07 | 1.24e-05 | 59 |
| GO:000660510 | Cervix | CC | protein targeting | 68/2311 | 314/18723 | 2.17e-06 | 6.55e-05 | 68 |
| GO:003166710 | Cervix | CC | response to nutrient levels | 92/2311 | 474/18723 | 5.80e-06 | 1.42e-04 | 92 |
| GO:00092678 | Cervix | CC | cellular response to starvation | 39/2311 | 156/18723 | 1.04e-05 | 2.32e-04 | 39 |
| GO:00425948 | Cervix | CC | response to starvation | 46/2311 | 197/18723 | 1.24e-05 | 2.59e-04 | 46 |
| GO:00316698 | Cervix | CC | cellular response to nutrient levels | 49/2311 | 215/18723 | 1.32e-05 | 2.68e-04 | 49 |
| GO:00726655 | Cervix | CC | protein localization to vacuole | 20/2311 | 67/18723 | 1.12e-04 | 1.40e-03 | 20 |
| GO:00162367 | Cervix | CC | macroautophagy | 58/2311 | 291/18723 | 1.40e-04 | 1.70e-03 | 58 |
| GO:00513021 | Cervix | CC | regulation of cell division | 39/2311 | 177/18723 | 2.05e-04 | 2.33e-03 | 39 |
| GO:00431127 | Cervix | CC | receptor metabolic process | 37/2311 | 166/18723 | 2.31e-04 | 2.58e-03 | 37 |
| GO:00009107 | Cervix | CC | cytokinesis | 37/2311 | 173/18723 | 5.40e-04 | 5.23e-03 | 37 |
| GO:00070347 | Cervix | CC | vacuolar transport | 34/2311 | 157/18723 | 7.03e-04 | 6.40e-03 | 34 |
| GO:00066235 | Cervix | CC | protein targeting to vacuole | 12/2311 | 37/18723 | 1.15e-03 | 9.39e-03 | 12 |
| GO:0032465 | Cervix | CC | regulation of cytokinesis | 22/2311 | 92/18723 | 1.55e-03 | 1.20e-02 | 22 |
| GO:00726665 | Cervix | CC | establishment of protein localization to vacuole | 14/2311 | 49/18723 | 1.84e-03 | 1.37e-02 | 14 |
| GO:0072594110 | Esophagus | ESCC | establishment of protein localization to organelle | 311/8552 | 422/18723 | 3.02e-32 | 2.13e-29 | 311 |
| GO:001623617 | Esophagus | ESCC | macroautophagy | 216/8552 | 291/18723 | 1.94e-23 | 4.57e-21 | 216 |
| Page: 1 2 |
| Pathway ID | Tissue | Disease Stage | Description | Gene Ratio | Bg Ratio | pvalue | p.adjust | qvalue | Count |
| hsa0501018 | Cervix | CC | Alzheimer disease | 113/1267 | 384/8465 | 9.67e-14 | 3.92e-12 | 2.32e-12 | 113 |
| hsa0501618 | Cervix | CC | Huntington disease | 94/1267 | 306/8465 | 8.49e-13 | 3.06e-11 | 1.81e-11 | 94 |
| hsa0502218 | Cervix | CC | Pathways of neurodegeneration - multiple diseases | 128/1267 | 476/8465 | 2.87e-12 | 9.29e-11 | 5.50e-11 | 128 |
| hsa0501418 | Cervix | CC | Amyotrophic lateral sclerosis | 103/1267 | 364/8465 | 1.79e-11 | 4.47e-10 | 2.64e-10 | 103 |
| hsa0513120 | Cervix | CC | Shigellosis | 69/1267 | 247/8465 | 7.64e-08 | 1.03e-06 | 6.10e-07 | 69 |
| hsa0501716 | Cervix | CC | Spinocerebellar ataxia | 35/1267 | 143/8465 | 1.77e-03 | 7.21e-03 | 4.26e-03 | 35 |
| hsa0501019 | Cervix | CC | Alzheimer disease | 113/1267 | 384/8465 | 9.67e-14 | 3.92e-12 | 2.32e-12 | 113 |
| hsa0501619 | Cervix | CC | Huntington disease | 94/1267 | 306/8465 | 8.49e-13 | 3.06e-11 | 1.81e-11 | 94 |
| hsa0502219 | Cervix | CC | Pathways of neurodegeneration - multiple diseases | 128/1267 | 476/8465 | 2.87e-12 | 9.29e-11 | 5.50e-11 | 128 |
| hsa0501419 | Cervix | CC | Amyotrophic lateral sclerosis | 103/1267 | 364/8465 | 1.79e-11 | 4.47e-10 | 2.64e-10 | 103 |
| hsa05131110 | Cervix | CC | Shigellosis | 69/1267 | 247/8465 | 7.64e-08 | 1.03e-06 | 6.10e-07 | 69 |
| hsa0501717 | Cervix | CC | Spinocerebellar ataxia | 35/1267 | 143/8465 | 1.77e-03 | 7.21e-03 | 4.26e-03 | 35 |
| hsa05014210 | Esophagus | ESCC | Amyotrophic lateral sclerosis | 266/4205 | 364/8465 | 1.31e-20 | 2.20e-18 | 1.13e-18 | 266 |
| hsa05016210 | Esophagus | ESCC | Huntington disease | 226/4205 | 306/8465 | 1.38e-18 | 8.72e-17 | 4.46e-17 | 226 |
| hsa05022210 | Esophagus | ESCC | Pathways of neurodegeneration - multiple diseases | 318/4205 | 476/8465 | 6.10e-15 | 2.04e-13 | 1.05e-13 | 318 |
| hsa05010210 | Esophagus | ESCC | Alzheimer disease | 263/4205 | 384/8465 | 1.80e-14 | 5.47e-13 | 2.80e-13 | 263 |
| hsa05131211 | Esophagus | ESCC | Shigellosis | 176/4205 | 247/8465 | 2.27e-12 | 4.01e-11 | 2.05e-11 | 176 |
| hsa0414010 | Esophagus | ESCC | Autophagy - animal | 101/4205 | 141/8465 | 7.60e-08 | 6.21e-07 | 3.18e-07 | 101 |
| hsa0501728 | Esophagus | ESCC | Spinocerebellar ataxia | 94/4205 | 143/8465 | 6.77e-05 | 2.90e-04 | 1.48e-04 | 94 |
| hsa041362 | Esophagus | ESCC | Autophagy - other | 23/4205 | 32/8465 | 8.99e-03 | 2.14e-02 | 1.09e-02 | 23 |
| Page: 1 2 |
Top |
Cell-cell communication analysis |
| Identification of potential cell-cell interactions between two cell types and their ligand-receptor pairs for different disease states |
| Ligand | Receptor | LRpair | Pathway | Tissue | Disease Stage |
| Page: 1 |
Top |
Single-cell gene regulatory network inference analysis |
| Find out the significant the regulons (TFs) and the target genes of each regulon across cell types for different disease states |
| TF | Cell Type | Tissue | Disease Stage | Target Gene | RSS | Regulon Activity |
| ∗The dot plots of a searched regulon are shown for all cell subpopulations in each disease state of each tissue based on the regulon specific score inferred using pySCENIC and by calculating the average expression. |
| Page: 1 |
Top |
Somatic mutation of malignant transformation related genes |
| Annotation of somatic variants for genes involved in malignant transformation |
| Hugo Symbol | Variant Class | Variant Classification | dbSNP RS | HGVSc | HGVSp | HGVSp Short | SWISSPROT | BIOTYPE | SIFT | PolyPhen | Tumor Sample Barcode | Tissue | Histology | Sex | Age | Stage | Therapy Types | Drugs | Outcome |
| PIK3R4 | SNV | Missense_Mutation | novel | c.3557N>A | p.Arg1186Gln | p.R1186Q | Q99570 | protein_coding | deleterious(0.01) | probably_damaging(0.948) | TCGA-AN-A046-01 | Breast | breast invasive carcinoma | Female | >=65 | I/II | Unknown | Unknown | SD |
| PIK3R4 | SNV | Missense_Mutation | c.1963N>A | p.Glu655Lys | p.E655K | Q99570 | protein_coding | deleterious(0.01) | possibly_damaging(0.67) | TCGA-AN-A046-01 | Breast | breast invasive carcinoma | Female | >=65 | I/II | Unknown | Unknown | SD | |
| PIK3R4 | SNV | Missense_Mutation | rs139640851 | c.1099N>A | p.Glu367Lys | p.E367K | Q99570 | protein_coding | tolerated(0.25) | benign(0.037) | TCGA-AN-A046-01 | Breast | breast invasive carcinoma | Female | >=65 | I/II | Unknown | Unknown | SD |
| PIK3R4 | SNV | Missense_Mutation | rs757385067 | c.1250N>A | p.Arg417His | p.R417H | Q99570 | protein_coding | deleterious(0) | probably_damaging(0.998) | TCGA-AN-A0AK-01 | Breast | breast invasive carcinoma | Female | >=65 | I/II | Unknown | Unknown | SD |
| PIK3R4 | SNV | Missense_Mutation | novel | c.2337G>A | p.Met779Ile | p.M779I | Q99570 | protein_coding | tolerated(0.06) | benign(0.019) | TCGA-B6-A400-01 | Breast | breast invasive carcinoma | Female | <65 | III/IV | Unknown | Unknown | SD |
| PIK3R4 | SNV | Missense_Mutation | c.689G>C | p.Arg230Thr | p.R230T | Q99570 | protein_coding | tolerated(0.39) | benign(0.415) | TCGA-BH-A0BZ-01 | Breast | breast invasive carcinoma | Female | <65 | III/IV | Chemotherapy | doxorubicin | CR | |
| PIK3R4 | SNV | Missense_Mutation | c.1165C>G | p.Leu389Val | p.L389V | Q99570 | protein_coding | deleterious(0) | probably_damaging(0.977) | TCGA-BH-A0DP-01 | Breast | breast invasive carcinoma | Female | <65 | I/II | Hormone Therapy | arimidex | SD | |
| PIK3R4 | SNV | Missense_Mutation | c.1567N>C | p.Asn523His | p.N523H | Q99570 | protein_coding | tolerated(0.26) | benign(0) | TCGA-D8-A1XK-01 | Breast | breast invasive carcinoma | Female | <65 | I/II | Chemotherapy | doxorubicine+cyclophosphamide | SD | |
| PIK3R4 | SNV | Missense_Mutation | c.1757A>G | p.Asn586Ser | p.N586S | Q99570 | protein_coding | deleterious(0.05) | benign(0.319) | TCGA-EW-A1P4-01 | Breast | breast invasive carcinoma | Female | <65 | I/II | Chemotherapy | docetaxel | SD | |
| PIK3R4 | SNV | Missense_Mutation | rs758799507 | c.817N>C | p.Phe273Leu | p.F273L | Q99570 | protein_coding | tolerated(0.68) | benign(0) | TCGA-EW-A423-01 | Breast | breast invasive carcinoma | Female | >=65 | I/II | Hormone Therapy | anastrozole | SD |
| Page: 1 2 3 4 5 6 7 8 9 10 11 12 13 14 15 16 17 |
Top |
Related drugs of malignant transformation related genes |
| Identification of chemicals and drugs interact with genes involved in malignant transfromation |
| (DGIdb 4.0) |
| Entrez ID | Symbol | Category | Interaction Types | Drug Claim Name | Drug Name | PMIDs |
| 30849 | PIK3R4 | DRUGGABLE GENOME, SERINE THREONINE KINASE, KINASE, PHOSPHATIDYLINOSITOL 3 KINASE, ENZYME | inhibitor | PI-103 | PI-103 | |
| 30849 | PIK3R4 | DRUGGABLE GENOME, SERINE THREONINE KINASE, KINASE, PHOSPHATIDYLINOSITOL 3 KINASE, ENZYME | inhibitor | BYL719 | ALPELISIB | |
| 30849 | PIK3R4 | DRUGGABLE GENOME, SERINE THREONINE KINASE, KINASE, PHOSPHATIDYLINOSITOL 3 KINASE, ENZYME | inhibitor | BYL719 | ALPELISIB | |
| 30849 | PIK3R4 | DRUGGABLE GENOME, SERINE THREONINE KINASE, KINASE, PHOSPHATIDYLINOSITOL 3 KINASE, ENZYME | inhibitor | BUPARLISIB HYDROCHLORIDE | ||
| 30849 | PIK3R4 | DRUGGABLE GENOME, SERINE THREONINE KINASE, KINASE, PHOSPHATIDYLINOSITOL 3 KINASE, ENZYME | inhibitor | PX-866 | SONOLISIB | |
| 30849 | PIK3R4 | DRUGGABLE GENOME, SERINE THREONINE KINASE, KINASE, PHOSPHATIDYLINOSITOL 3 KINASE, ENZYME | inhibitor | GDC-0941 | PICTILISIB | |
| 30849 | PIK3R4 | DRUGGABLE GENOME, SERINE THREONINE KINASE, KINASE, PHOSPHATIDYLINOSITOL 3 KINASE, ENZYME | inhibitor | PKI-587 | GEDATOLISIB | |
| 30849 | PIK3R4 | DRUGGABLE GENOME, SERINE THREONINE KINASE, KINASE, PHOSPHATIDYLINOSITOL 3 KINASE, ENZYME | inhibitor | BEZ235 | DACTOLISIB | |
| 30849 | PIK3R4 | DRUGGABLE GENOME, SERINE THREONINE KINASE, KINASE, PHOSPHATIDYLINOSITOL 3 KINASE, ENZYME | inhibitor | GSK2126458 | OMIPALISIB | |
| 30849 | PIK3R4 | DRUGGABLE GENOME, SERINE THREONINE KINASE, KINASE, PHOSPHATIDYLINOSITOL 3 KINASE, ENZYME | inhibitor | SF1126 |
| Page: 1 2 3 |

Copyright 2023-Present -The University of Texas Health Science Center at Houston |