
|
|||||
|
 | |
| |
| |
| |
| |
| |
|
Gene: PIK3R2 |
Gene summary for PIK3R2 |
| Gene information | Species | Human | Gene symbol | PIK3R2 | Gene ID | 5296 |
| Gene name | phosphoinositide-3-kinase regulatory subunit 2 | |
| Gene Alias | MPPH | |
| Cytomap | 19p13.11 | |
| Gene Type | protein-coding | GO ID | GO:0000165 | UniProtAcc | O00459 |
Top |
Malignant transformation analysis |
| Identification of the aberrant gene expression in precancerous and cancerous lesions by comparing the gene expression of stem-like cells in diseased tissues with normal stem cells |
| Entrez ID | Symbol | Replicates | Species | Organ | Tissue | Adj P-value | Log2FC | Malignancy |
| 5296 | PIK3R2 | HCC1_Meng | Human | Liver | HCC | 4.99e-19 | 6.51e-02 | 0.0246 |
| 5296 | PIK3R2 | HCC1 | Human | Liver | HCC | 2.21e-18 | 3.73e+00 | 0.5336 |
| 5296 | PIK3R2 | HCC2 | Human | Liver | HCC | 2.04e-31 | 3.90e+00 | 0.5341 |
| 5296 | PIK3R2 | HCC5 | Human | Liver | HCC | 8.72e-08 | 6.80e-01 | 0.4932 |
| 5296 | PIK3R2 | S014 | Human | Liver | HCC | 6.94e-03 | 7.10e-02 | 0.2254 |
| 5296 | PIK3R2 | S015 | Human | Liver | HCC | 5.89e-08 | 1.53e-01 | 0.2375 |
| 5296 | PIK3R2 | S016 | Human | Liver | HCC | 8.90e-03 | 8.63e-02 | 0.2243 |
| Page: 1 |
| Tissue | Expression Dynamics | Abbreviation |
| Liver | 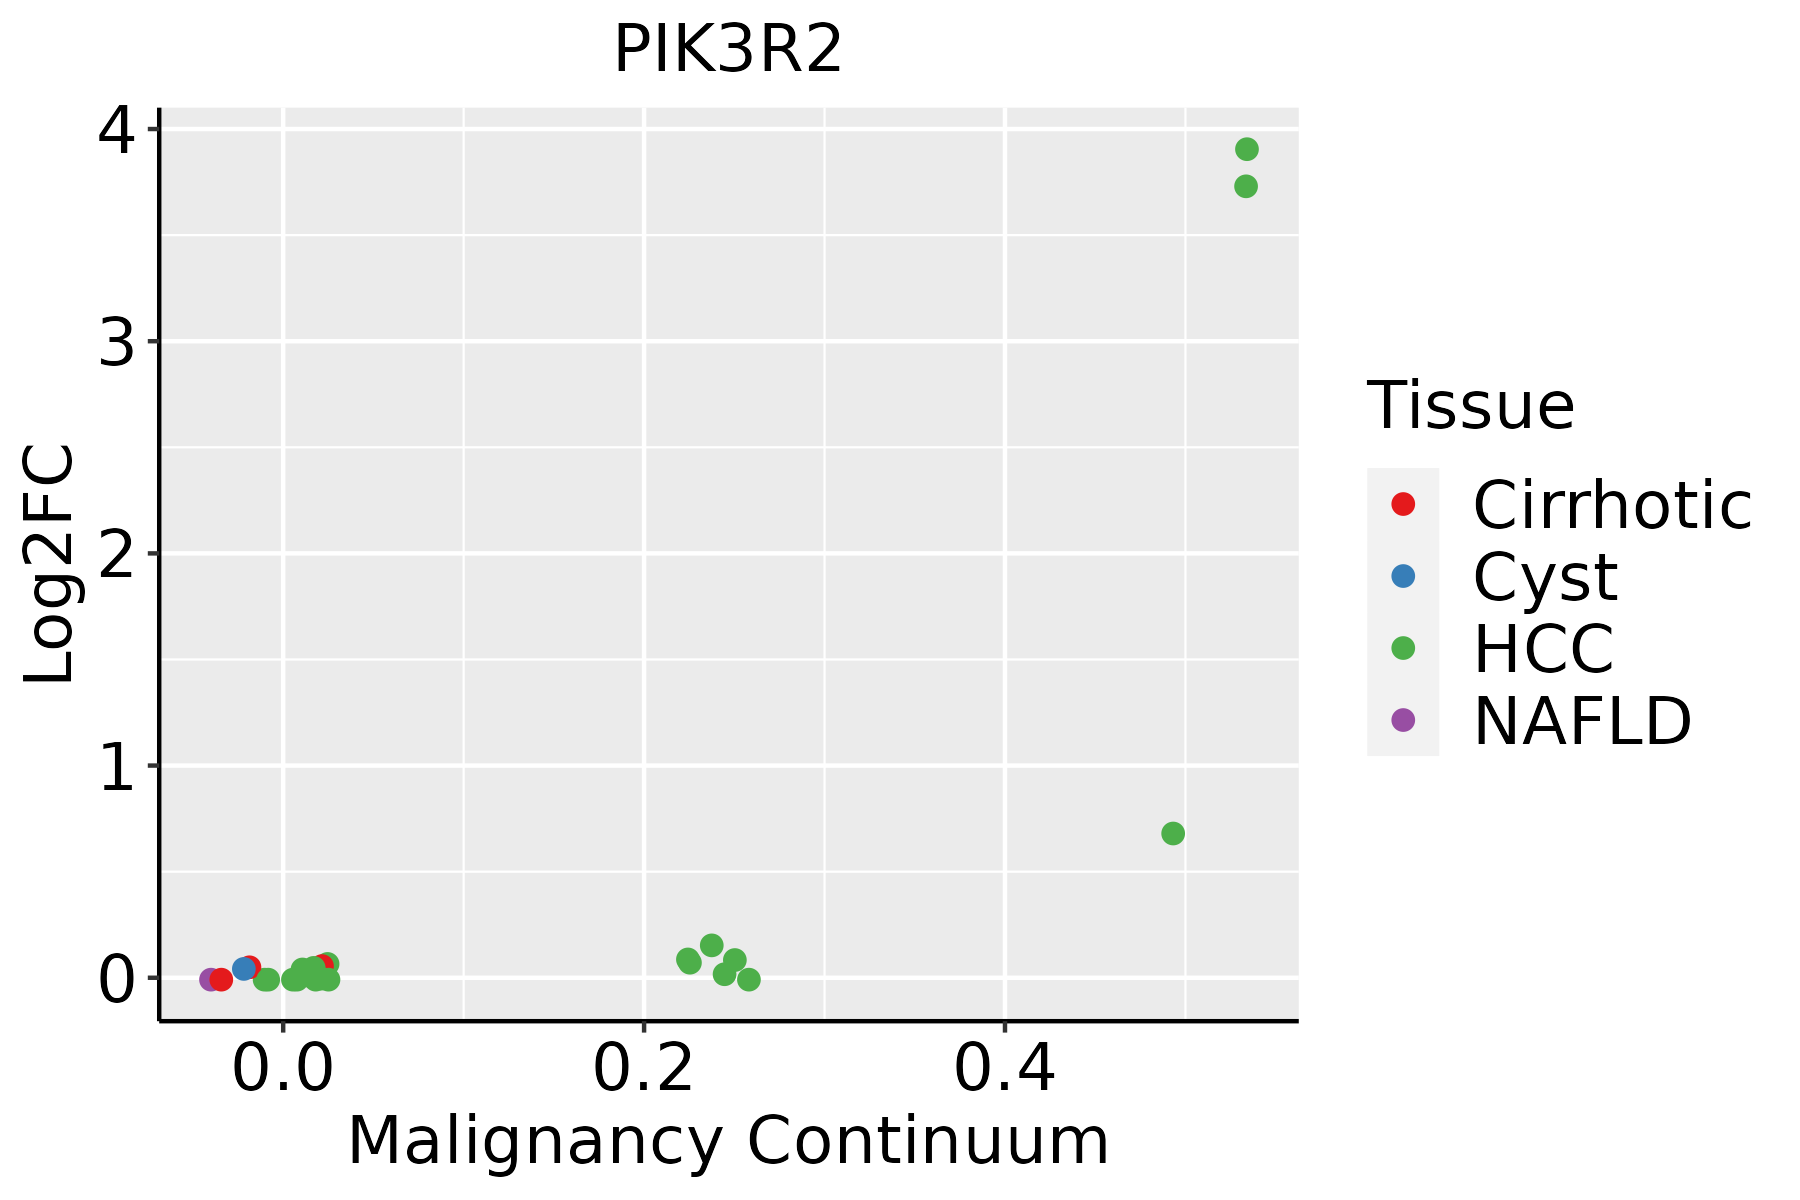 | HCC: Hepatocellular carcinoma |
| NAFLD: Non-alcoholic fatty liver disease |
| ∗log2FC in expression of this searched gene in stem-like cells from each diseased tissue sample relative to stem-like cells in normal samples in each tissue plotted against the malignancy continuum. Samples are colored based on if they are from different disease stage. |
Top |
Malignant transformation related pathway analysis |
| Find out the enriched GO biological processes and KEGG pathways involved in transition from healthy to precancer to cancer |
| Tissue | Disease Stage | Enriched GO biological Processes |
| Colorectum | AD |  |
| Colorectum | SER |  |
| Colorectum | MSS |  |
| Colorectum | MSI-H |  |
| Colorectum | FAP |  |
| ∗Top 15 enriched GO BP terms are showed in the bar plot of each disease state in each tissue. Each row represents a significant GO biological process which is colored according to the -log10(p.adjust). |
| Page: 1 2 3 4 5 6 7 8 9 |
| GO ID | Tissue | Disease Stage | Description | Gene Ratio | Bg Ratio | pvalue | p.adjust | Count |
| GO:007259422 | Liver | HCC | establishment of protein localization to organelle | 299/7958 | 422/18723 | 1.06e-32 | 6.10e-30 | 299 |
| GO:003497612 | Liver | HCC | response to endoplasmic reticulum stress | 189/7958 | 256/18723 | 1.43e-24 | 4.06e-22 | 189 |
| GO:190382922 | Liver | HCC | positive regulation of cellular protein localization | 199/7958 | 276/18723 | 1.15e-23 | 2.62e-21 | 199 |
| GO:003238621 | Liver | HCC | regulation of intracellular transport | 231/7958 | 337/18723 | 1.99e-22 | 3.40e-20 | 231 |
| GO:000691322 | Liver | HCC | nucleocytoplasmic transport | 208/7958 | 301/18723 | 5.51e-21 | 8.12e-19 | 208 |
| GO:005116922 | Liver | HCC | nuclear transport | 208/7958 | 301/18723 | 5.51e-21 | 8.12e-19 | 208 |
| GO:003315721 | Liver | HCC | regulation of intracellular protein transport | 165/7958 | 229/18723 | 8.37e-20 | 1.15e-17 | 165 |
| GO:003238821 | Liver | HCC | positive regulation of intracellular transport | 148/7958 | 202/18723 | 5.15e-19 | 6.66e-17 | 148 |
| GO:001050621 | Liver | HCC | regulation of autophagy | 210/7958 | 317/18723 | 7.59e-18 | 8.45e-16 | 210 |
| GO:009031621 | Liver | HCC | positive regulation of intracellular protein transport | 121/7958 | 160/18723 | 1.27e-17 | 1.39e-15 | 121 |
| GO:003450421 | Liver | HCC | protein localization to nucleus | 194/7958 | 290/18723 | 2.84e-17 | 2.85e-15 | 194 |
| GO:190495122 | Liver | HCC | positive regulation of establishment of protein localization | 207/7958 | 319/18723 | 3.95e-16 | 3.29e-14 | 207 |
| GO:005122222 | Liver | HCC | positive regulation of protein transport | 194/7958 | 303/18723 | 2.41e-14 | 1.56e-12 | 194 |
| GO:003286821 | Liver | HCC | response to insulin | 172/7958 | 264/18723 | 7.14e-14 | 4.23e-12 | 172 |
| GO:001703811 | Liver | HCC | protein import | 140/7958 | 206/18723 | 1.12e-13 | 6.46e-12 | 140 |
| GO:003286921 | Liver | HCC | cellular response to insulin stimulus | 137/7958 | 203/18723 | 4.69e-13 | 2.44e-11 | 137 |
| GO:004343422 | Liver | HCC | response to peptide hormone | 247/7958 | 414/18723 | 9.55e-13 | 4.77e-11 | 247 |
| GO:004682221 | Liver | HCC | regulation of nucleocytoplasmic transport | 81/7958 | 106/18723 | 1.11e-12 | 5.52e-11 | 81 |
| GO:007137521 | Liver | HCC | cellular response to peptide hormone stimulus | 179/7958 | 290/18723 | 2.54e-11 | 9.88e-10 | 179 |
| GO:190018212 | Liver | HCC | positive regulation of protein localization to nucleus | 67/7958 | 87/18723 | 5.43e-11 | 2.00e-09 | 67 |
| Page: 1 2 3 |
| Pathway ID | Tissue | Disease Stage | Description | Gene Ratio | Bg Ratio | pvalue | p.adjust | qvalue | Count |
| hsa0520842 | Liver | HCC | Chemical carcinogenesis - reactive oxygen species | 167/4020 | 223/8465 | 2.85e-17 | 1.91e-15 | 1.06e-15 | 167 |
| hsa0493242 | Liver | HCC | Non-alcoholic fatty liver disease | 124/4020 | 155/8465 | 4.54e-17 | 2.54e-15 | 1.41e-15 | 124 |
| hsa0502022 | Liver | HCC | Prion disease | 195/4020 | 273/8465 | 3.26e-16 | 1.56e-14 | 8.67e-15 | 195 |
| hsa0541522 | Liver | HCC | Diabetic cardiomyopathy | 151/4020 | 203/8465 | 2.72e-15 | 1.01e-13 | 5.63e-14 | 151 |
| hsa0517142 | Liver | HCC | Coronavirus disease - COVID-19 | 167/4020 | 232/8465 | 1.50e-14 | 4.19e-13 | 2.33e-13 | 167 |
| hsa0501022 | Liver | HCC | Alzheimer disease | 254/4020 | 384/8465 | 3.75e-14 | 8.97e-13 | 4.99e-13 | 254 |
| hsa0414021 | Liver | HCC | Autophagy - animal | 99/4020 | 141/8465 | 3.08e-08 | 4.70e-07 | 2.61e-07 | 99 |
| hsa0521022 | Liver | HCC | Colorectal cancer | 65/4020 | 86/8465 | 8.85e-08 | 1.23e-06 | 6.87e-07 | 65 |
| hsa0491041 | Liver | HCC | Insulin signaling pathway | 95/4020 | 137/8465 | 1.53e-07 | 1.97e-06 | 1.10e-06 | 95 |
| hsa0493121 | Liver | HCC | Insulin resistance | 77/4020 | 108/8465 | 3.89e-07 | 4.46e-06 | 2.48e-06 | 77 |
| hsa0513542 | Liver | HCC | Yersinia infection | 92/4020 | 137/8465 | 2.25e-06 | 2.19e-05 | 1.22e-05 | 92 |
| hsa0516921 | Liver | HCC | Epstein-Barr virus infection | 128/4020 | 202/8465 | 3.17e-06 | 2.79e-05 | 1.55e-05 | 128 |
| hsa0516622 | Liver | HCC | Human T-cell leukemia virus 1 infection | 139/4020 | 222/8465 | 3.17e-06 | 2.79e-05 | 1.55e-05 | 139 |
| hsa0421822 | Liver | HCC | Cellular senescence | 102/4020 | 156/8465 | 4.18e-06 | 3.59e-05 | 2.00e-05 | 102 |
| hsa0521121 | Liver | HCC | Renal cell carcinoma | 51/4020 | 69/8465 | 6.76e-06 | 5.53e-05 | 3.07e-05 | 51 |
| hsa0522021 | Liver | HCC | Chronic myeloid leukemia | 55/4020 | 76/8465 | 8.67e-06 | 6.91e-05 | 3.84e-05 | 55 |
| hsa0521321 | Liver | HCC | Endometrial cancer | 44/4020 | 58/8465 | 9.34e-06 | 7.11e-05 | 3.95e-05 | 44 |
| hsa0513142 | Liver | HCC | Shigellosis | 150/4020 | 247/8465 | 1.53e-05 | 1.04e-04 | 5.81e-05 | 150 |
| hsa0521221 | Liver | HCC | Pancreatic cancer | 54/4020 | 76/8465 | 2.50e-05 | 1.64e-04 | 9.12e-05 | 54 |
| hsa052258 | Liver | HCC | Hepatocellular carcinoma | 106/4020 | 168/8465 | 2.87e-05 | 1.85e-04 | 1.03e-04 | 106 |
| Page: 1 2 3 4 5 6 7 |
Top |
Cell-cell communication analysis |
| Identification of potential cell-cell interactions between two cell types and their ligand-receptor pairs for different disease states |
| Ligand | Receptor | LRpair | Pathway | Tissue | Disease Stage |
| Page: 1 |
Top |
Single-cell gene regulatory network inference analysis |
| Find out the significant the regulons (TFs) and the target genes of each regulon across cell types for different disease states |
| TF | Cell Type | Tissue | Disease Stage | Target Gene | RSS | Regulon Activity |
| ∗The dot plots of a searched regulon are shown for all cell subpopulations in each disease state of each tissue based on the regulon specific score inferred using pySCENIC and by calculating the average expression. |
| Page: 1 |
Top |
Somatic mutation of malignant transformation related genes |
| Annotation of somatic variants for genes involved in malignant transformation |
| Hugo Symbol | Variant Class | Variant Classification | dbSNP RS | HGVSc | HGVSp | HGVSp Short | SWISSPROT | BIOTYPE | SIFT | PolyPhen | Tumor Sample Barcode | Tissue | Histology | Sex | Age | Stage | Therapy Types | Drugs | Outcome |
| PIK3R2 | SNV | Missense_Mutation | novel | c.930G>T | p.Lys310Asn | p.K310N | O00459 | protein_coding | tolerated(0.11) | probably_damaging(0.991) | TCGA-A2-A25C-01 | Breast | breast invasive carcinoma | Female | <65 | I/II | Chemotherapy | taxotere | SD |
| PIK3R2 | SNV | Missense_Mutation | c.1528N>T | p.Arg510Trp | p.R510W | O00459 | protein_coding | deleterious(0) | probably_damaging(0.965) | TCGA-A8-A09Z-01 | Breast | breast invasive carcinoma | Female | >=65 | I/II | Unknown | Unknown | SD | |
| PIK3R2 | SNV | Missense_Mutation | c.1211N>G | p.His404Arg | p.H404R | O00459 | protein_coding | deleterious(0) | possibly_damaging(0.556) | TCGA-D8-A1XQ-01 | Breast | breast invasive carcinoma | Female | >=65 | I/II | Unknown | Unknown | SD | |
| PIK3R2 | SNV | Missense_Mutation | rs779519249 | c.55C>T | p.Arg19Trp | p.R19W | O00459 | protein_coding | deleterious(0.02) | probably_damaging(0.925) | TCGA-LL-A9Q3-01 | Breast | breast invasive carcinoma | Female | >=65 | III/IV | Immunotherapy | herceptin | CR |
| PIK3R2 | insertion | Nonsense_Mutation | novel | c.1765_1766insTGGTCCTTTTCAAGCCCTTTGTAAAGTTTGCCCTTT | p.Lys589delinsMetValLeuPheLysProPheValLysPheAlaLeuTer | p.K589delinsMVLFKPFVKFAL* | O00459 | protein_coding | TCGA-AN-A0FV-01 | Breast | breast invasive carcinoma | Female | <65 | I/II | Unknown | Unknown | SD | ||
| PIK3R2 | insertion | Frame_Shift_Ins | novel | c.1234_1235insCCCCCCTAAGG | p.Gln412ProfsTer69 | p.Q412Pfs*69 | O00459 | protein_coding | TCGA-B6-A0I9-01 | Breast | breast invasive carcinoma | Female | <65 | III/IV | Unknown | Unknown | PD | ||
| PIK3R2 | insertion | In_Frame_Ins | novel | c.1270_1271insAGGTGGAGGTTG | p.Pro424delinsGlnValGluValAla | p.P424delinsQVEVA | O00459 | protein_coding | TCGA-BH-A0B8-01 | Breast | breast invasive carcinoma | Female | <65 | I/II | Hormone Therapy | arimidex | SD | ||
| PIK3R2 | SNV | Missense_Mutation | novel | c.377C>T | p.Pro126Leu | p.P126L | O00459 | protein_coding | tolerated(0.1) | benign(0.007) | TCGA-5M-AAT6-01 | Colorectum | colon adenocarcinoma | Female | <65 | III/IV | Unknown | Unknown | PD |
| PIK3R2 | SNV | Missense_Mutation | c.400N>A | p.Ala134Thr | p.A134T | O00459 | protein_coding | deleterious(0.03) | benign(0.136) | TCGA-A6-2682-01 | Colorectum | colon adenocarcinoma | Male | >=65 | III/IV | Chemotherapy | 5 | PD | |
| PIK3R2 | SNV | Missense_Mutation | c.1592N>A | p.Arg531His | p.R531H | O00459 | protein_coding | deleterious(0) | probably_damaging(0.985) | TCGA-AD-6901-01 | Colorectum | colon adenocarcinoma | Male | >=65 | I/II | Chemotherapy | xeloda | PD |
| Page: 1 2 3 4 5 6 7 8 |
Top |
Related drugs of malignant transformation related genes |
| Identification of chemicals and drugs interact with genes involved in malignant transfromation |
| (DGIdb 4.0) |
| Entrez ID | Symbol | Category | Interaction Types | Drug Claim Name | Drug Name | PMIDs |
| 5296 | PIK3R2 | CLINICALLY ACTIONABLE, KINASE, PHOSPHATIDYLINOSITOL 3 KINASE, ENZYME, DRUG RESISTANCE | inhibitor | PF-4691502 | PF-04691502 | |
| 5296 | PIK3R2 | CLINICALLY ACTIONABLE, KINASE, PHOSPHATIDYLINOSITOL 3 KINASE, ENZYME, DRUG RESISTANCE | inhibitor | CHEMBL1236962 | OMIPALISIB | |
| 5296 | PIK3R2 | CLINICALLY ACTIONABLE, KINASE, PHOSPHATIDYLINOSITOL 3 KINASE, ENZYME, DRUG RESISTANCE | cyclophosphamide | CYCLOPHOSPHAMIDE | ||
| 5296 | PIK3R2 | CLINICALLY ACTIONABLE, KINASE, PHOSPHATIDYLINOSITOL 3 KINASE, ENZYME, DRUG RESISTANCE | inhibitor | PKI-587 | GEDATOLISIB | |
| 5296 | PIK3R2 | CLINICALLY ACTIONABLE, KINASE, PHOSPHATIDYLINOSITOL 3 KINASE, ENZYME, DRUG RESISTANCE | inhibitor | CHEMBL3545096 | BGT-226 | |
| 5296 | PIK3R2 | CLINICALLY ACTIONABLE, KINASE, PHOSPHATIDYLINOSITOL 3 KINASE, ENZYME, DRUG RESISTANCE | inhibitor | BKM120 | BUPARLISIB | |
| 5296 | PIK3R2 | CLINICALLY ACTIONABLE, KINASE, PHOSPHATIDYLINOSITOL 3 KINASE, ENZYME, DRUG RESISTANCE | inhibitor | CHEMBL3544999 | SAMOTOLISIB | |
| 5296 | PIK3R2 | CLINICALLY ACTIONABLE, KINASE, PHOSPHATIDYLINOSITOL 3 KINASE, ENZYME, DRUG RESISTANCE | inhibitor | CHEMBL586701 | ZSTK-474 | |
| 5296 | PIK3R2 | CLINICALLY ACTIONABLE, KINASE, PHOSPHATIDYLINOSITOL 3 KINASE, ENZYME, DRUG RESISTANCE | inhibitor | SF1126 | ||
| 5296 | PIK3R2 | CLINICALLY ACTIONABLE, KINASE, PHOSPHATIDYLINOSITOL 3 KINASE, ENZYME, DRUG RESISTANCE | inhibitor | GSK2126458 | OMIPALISIB |
| Page: 1 2 3 4 5 6 |

Copyright 2023-Present -The University of Texas Health Science Center at Houston |