
|
|||||
|
 | |
| |
| |
| |
| |
| |
|
Gene: PIK3IP1 |
Gene summary for PIK3IP1 |
| Gene information | Species | Human | Gene symbol | PIK3IP1 | Gene ID | 113791 |
| Gene name | phosphoinositide-3-kinase interacting protein 1 | |
| Gene Alias | HGFL | |
| Cytomap | 22q12.2 | |
| Gene Type | protein-coding | GO ID | GO:0006508 | UniProtAcc | Q96FE7 |
Top |
Malignant transformation analysis |
| Identification of the aberrant gene expression in precancerous and cancerous lesions by comparing the gene expression of stem-like cells in diseased tissues with normal stem cells |
| Entrez ID | Symbol | Replicates | Species | Organ | Tissue | Adj P-value | Log2FC | Malignancy |
| 113791 | PIK3IP1 | HTA11_1938_2000001011 | Human | Colorectum | AD | 1.39e-05 | 3.83e-01 | -0.0811 |
| 113791 | PIK3IP1 | HTA11_78_2000001011 | Human | Colorectum | AD | 4.20e-02 | 2.46e-01 | -0.1088 |
| 113791 | PIK3IP1 | HTA11_347_2000001011 | Human | Colorectum | AD | 4.43e-05 | 2.36e-01 | -0.1954 |
| 113791 | PIK3IP1 | HTA11_1391_2000001011 | Human | Colorectum | AD | 7.50e-05 | 2.90e-01 | -0.059 |
| 113791 | PIK3IP1 | HTA11_866_3004761011 | Human | Colorectum | AD | 2.63e-10 | 4.09e-01 | 0.096 |
| 113791 | PIK3IP1 | HTA11_7663_2000001011 | Human | Colorectum | SER | 2.77e-02 | 5.88e-01 | 0.0131 |
| 113791 | PIK3IP1 | HTA11_10711_2000001011 | Human | Colorectum | AD | 3.22e-03 | 2.70e-01 | 0.0338 |
| 113791 | PIK3IP1 | HTA11_7696_3000711011 | Human | Colorectum | AD | 2.78e-11 | 4.76e-01 | 0.0674 |
| 113791 | PIK3IP1 | HTA11_6818_2000001021 | Human | Colorectum | AD | 2.24e-04 | 3.39e-01 | 0.0588 |
| 113791 | PIK3IP1 | HTA11_99999965104_69814 | Human | Colorectum | MSS | 4.80e-03 | 2.30e-01 | 0.281 |
| 113791 | PIK3IP1 | HTA11_99999973899_84307 | Human | Colorectum | MSS | 1.18e-14 | 8.91e-01 | 0.2585 |
| 113791 | PIK3IP1 | LZE4T | Human | Esophagus | ESCC | 2.13e-03 | 1.12e-01 | 0.0811 |
| 113791 | PIK3IP1 | LZE5T | Human | Esophagus | ESCC | 1.88e-03 | 3.70e-01 | 0.0514 |
| 113791 | PIK3IP1 | LZE7T | Human | Esophagus | ESCC | 1.13e-04 | 3.44e-01 | 0.0667 |
| 113791 | PIK3IP1 | LZE20T | Human | Esophagus | ESCC | 3.93e-03 | 1.80e-01 | 0.0662 |
| 113791 | PIK3IP1 | LZE24T | Human | Esophagus | ESCC | 1.33e-13 | 6.23e-01 | 0.0596 |
| 113791 | PIK3IP1 | LZE21T | Human | Esophagus | ESCC | 1.89e-03 | 4.58e-01 | 0.0655 |
| 113791 | PIK3IP1 | P1T-E | Human | Esophagus | ESCC | 4.69e-13 | 5.72e-01 | 0.0875 |
| 113791 | PIK3IP1 | P2T-E | Human | Esophagus | ESCC | 5.90e-09 | 1.71e-01 | 0.1177 |
| 113791 | PIK3IP1 | P4T-E | Human | Esophagus | ESCC | 8.49e-09 | 1.71e-01 | 0.1323 |
| Page: 1 2 3 4 5 |
| Tissue | Expression Dynamics | Abbreviation |
| Colorectum (GSE201348) |  | FAP: Familial adenomatous polyposis |
| CRC: Colorectal cancer | ||
| Colorectum (HTA11) |  | AD: Adenomas |
| SER: Sessile serrated lesions | ||
| MSI-H: Microsatellite-high colorectal cancer | ||
| MSS: Microsatellite stable colorectal cancer | ||
| Esophagus | 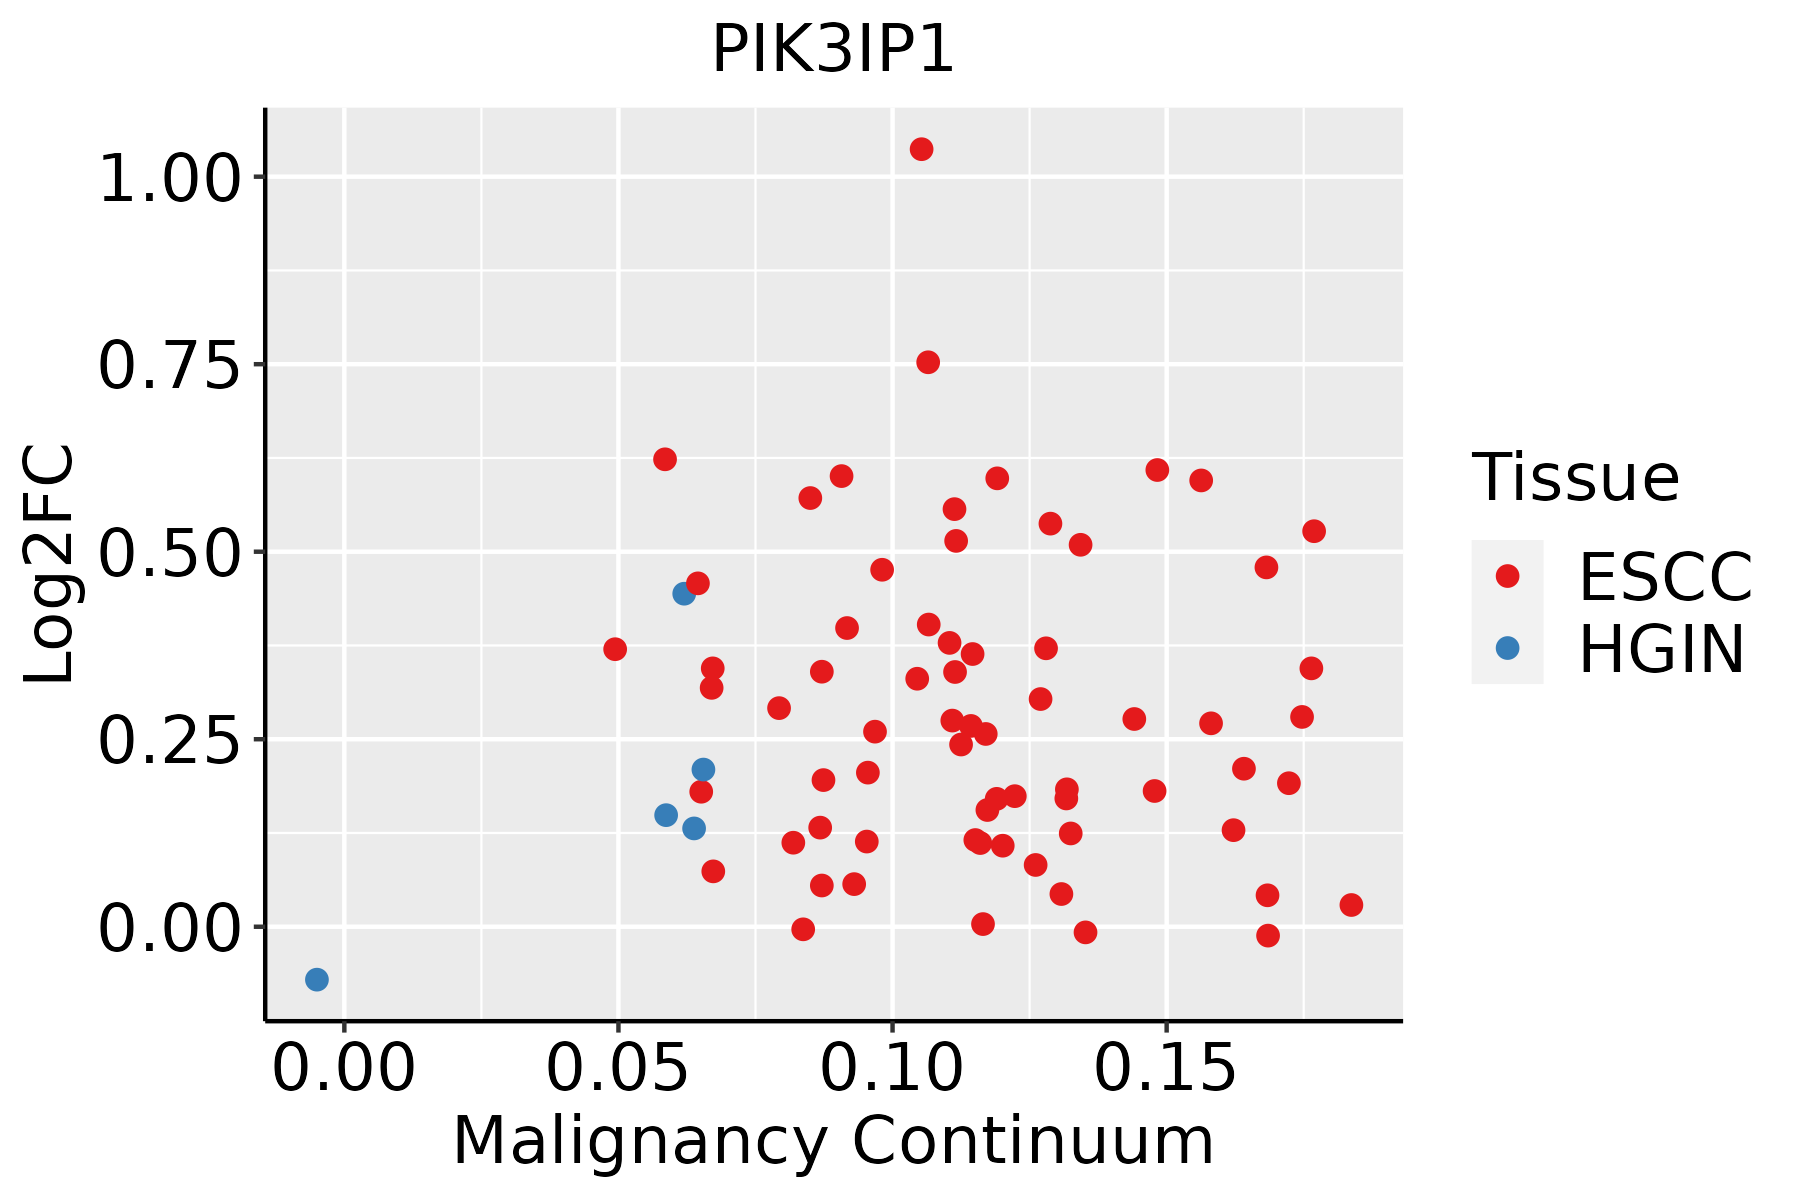 | ESCC: Esophageal squamous cell carcinoma |
| HGIN: High-grade intraepithelial neoplasias | ||
| LGIN: Low-grade intraepithelial neoplasias | ||
| Oral Cavity |  | EOLP: Erosive Oral lichen planus |
| LP: leukoplakia | ||
| NEOLP: Non-erosive oral lichen planus | ||
| OSCC: Oral squamous cell carcinoma | ||
| Prostate | 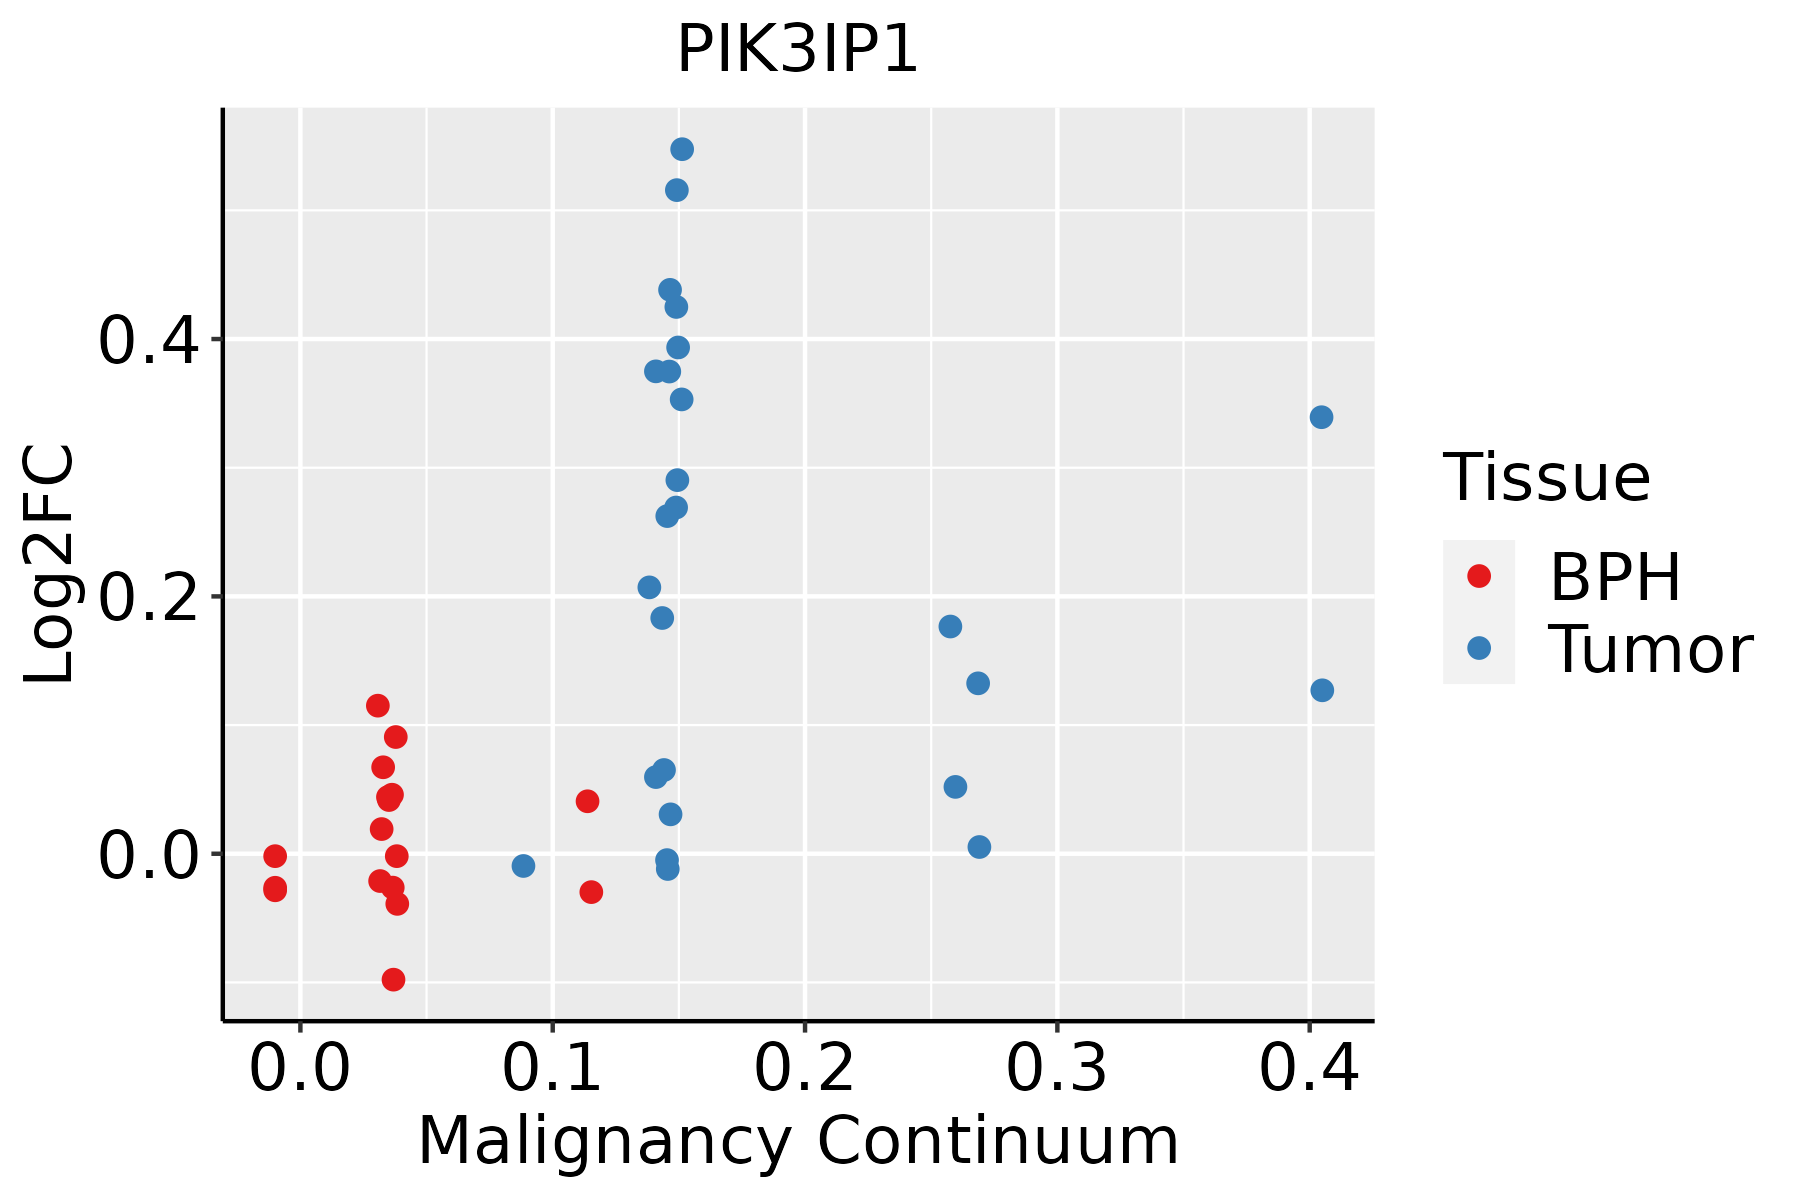 | BPH: Benign Prostatic Hyperplasia |
| Thyroid | 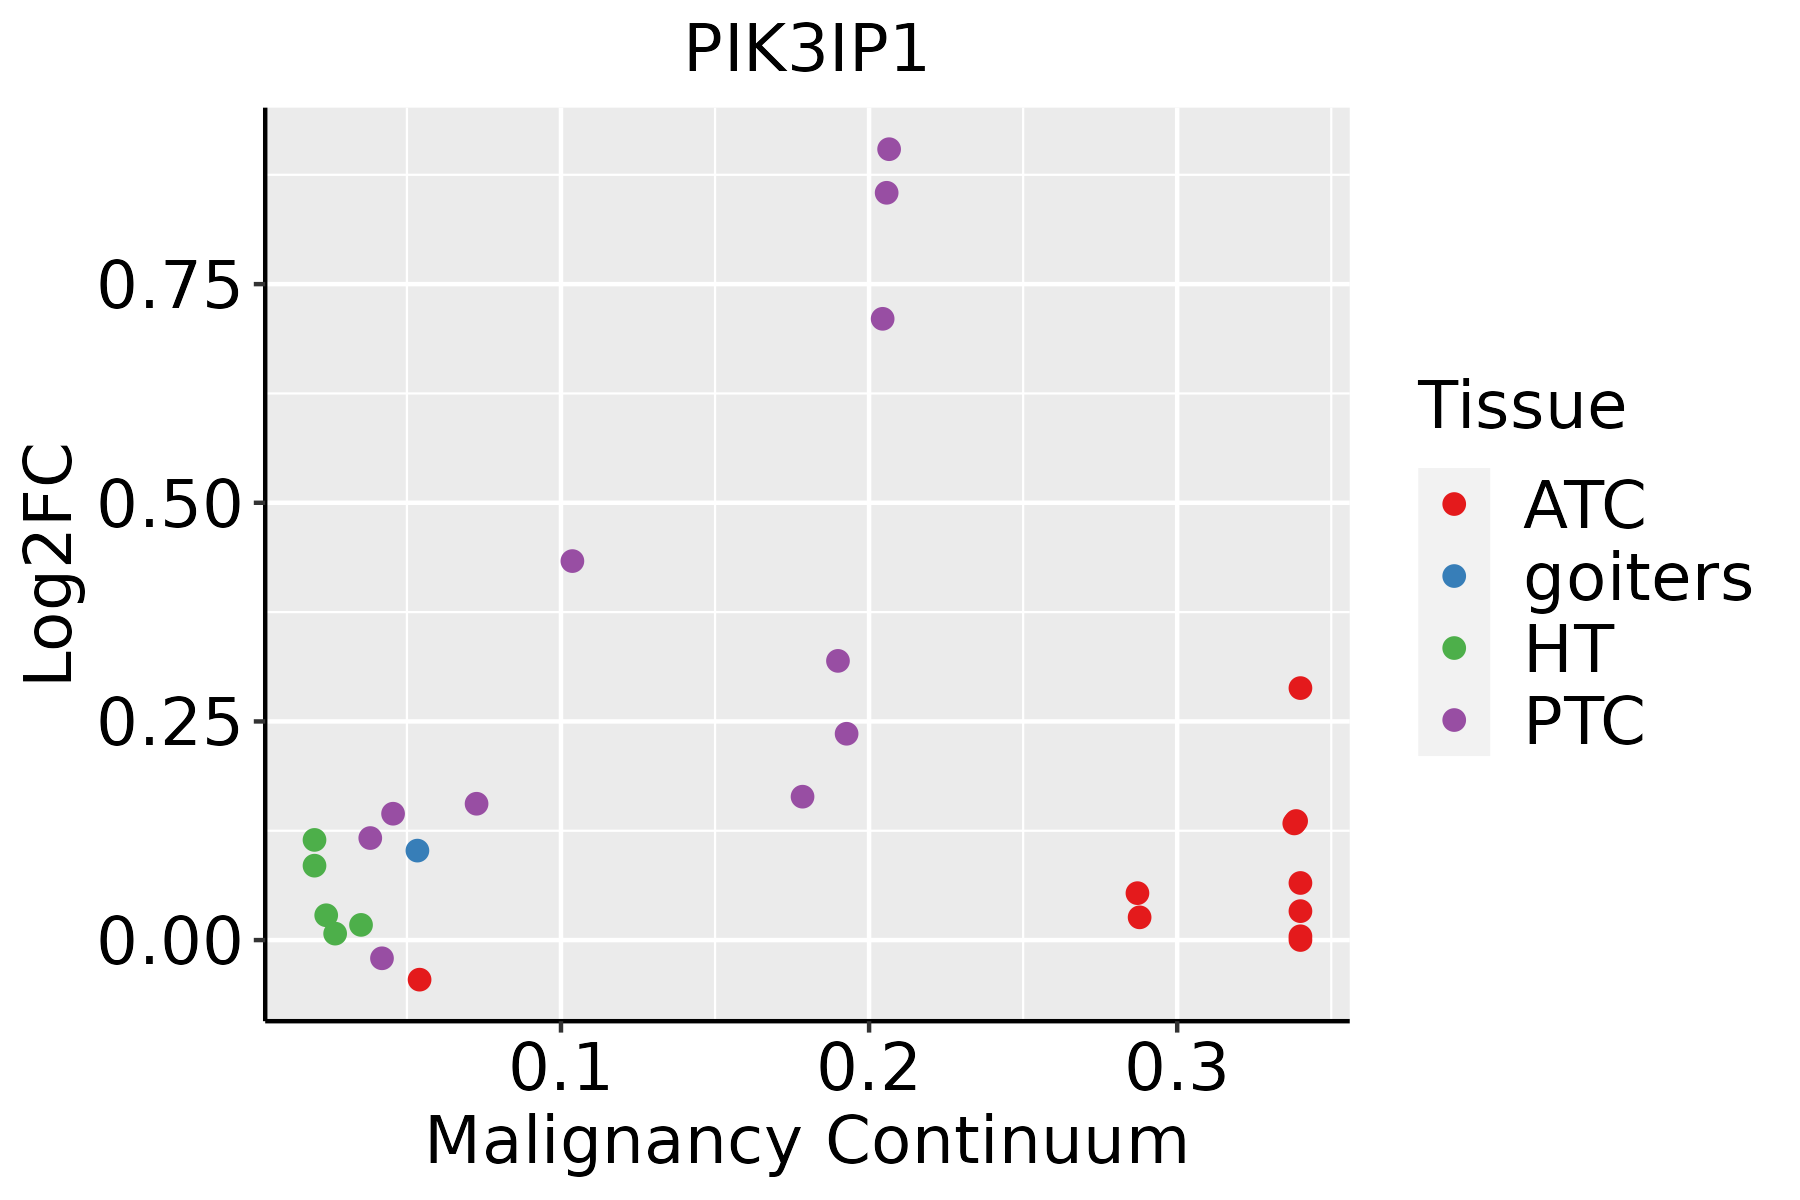 | ATC: Anaplastic thyroid cancer |
| HT: Hashimoto's thyroiditis | ||
| PTC: Papillary thyroid cancer |
| ∗log2FC in expression of this searched gene in stem-like cells from each diseased tissue sample relative to stem-like cells in normal samples in each tissue plotted against the malignancy continuum. Samples are colored based on if they are from different disease stage. |
Top |
Malignant transformation related pathway analysis |
| Find out the enriched GO biological processes and KEGG pathways involved in transition from healthy to precancer to cancer |
| Tissue | Disease Stage | Enriched GO biological Processes |
| Colorectum | AD |  |
| Colorectum | SER |  |
| Colorectum | MSS |  |
| Colorectum | MSI-H |  |
| Colorectum | FAP |  |
| ∗Top 15 enriched GO BP terms are showed in the bar plot of each disease state in each tissue. Each row represents a significant GO biological process which is colored according to the -log10(p.adjust). |
| Page: 1 2 3 4 5 6 7 8 9 |
| GO ID | Tissue | Disease Stage | Description | Gene Ratio | Bg Ratio | pvalue | p.adjust | Count |
| GO:0010563 | Colorectum | AD | negative regulation of phosphorus metabolic process | 130/3918 | 442/18723 | 1.26e-05 | 2.76e-04 | 130 |
| GO:0045936 | Colorectum | AD | negative regulation of phosphate metabolic process | 129/3918 | 441/18723 | 1.81e-05 | 3.76e-04 | 129 |
| GO:0051348 | Colorectum | AD | negative regulation of transferase activity | 85/3918 | 268/18723 | 2.07e-05 | 4.19e-04 | 85 |
| GO:0042326 | Colorectum | AD | negative regulation of phosphorylation | 112/3918 | 385/18723 | 8.02e-05 | 1.27e-03 | 112 |
| GO:0033673 | Colorectum | AD | negative regulation of kinase activity | 71/3918 | 237/18723 | 6.18e-04 | 6.47e-03 | 71 |
| GO:0048017 | Colorectum | AD | inositol lipid-mediated signaling | 53/3918 | 182/18723 | 5.35e-03 | 3.52e-02 | 53 |
| GO:0048015 | Colorectum | AD | phosphatidylinositol-mediated signaling | 52/3918 | 178/18723 | 5.37e-03 | 3.54e-02 | 52 |
| GO:00513481 | Colorectum | SER | negative regulation of transferase activity | 70/2897 | 268/18723 | 4.27e-06 | 1.62e-04 | 70 |
| GO:00105631 | Colorectum | SER | negative regulation of phosphorus metabolic process | 101/2897 | 442/18723 | 2.39e-05 | 6.70e-04 | 101 |
| GO:00459361 | Colorectum | SER | negative regulation of phosphate metabolic process | 100/2897 | 441/18723 | 3.62e-05 | 9.39e-04 | 100 |
| GO:00423261 | Colorectum | SER | negative regulation of phosphorylation | 86/2897 | 385/18723 | 2.10e-04 | 3.78e-03 | 86 |
| GO:00336731 | Colorectum | SER | negative regulation of kinase activity | 57/2897 | 237/18723 | 3.48e-04 | 5.46e-03 | 57 |
| GO:00480171 | Colorectum | SER | inositol lipid-mediated signaling | 42/2897 | 182/18723 | 4.36e-03 | 3.49e-02 | 42 |
| GO:00480151 | Colorectum | SER | phosphatidylinositol-mediated signaling | 41/2897 | 178/18723 | 4.97e-03 | 3.86e-02 | 41 |
| GO:00513482 | Colorectum | MSS | negative regulation of transferase activity | 80/3467 | 268/18723 | 4.06e-06 | 1.17e-04 | 80 |
| GO:00105632 | Colorectum | MSS | negative regulation of phosphorus metabolic process | 118/3467 | 442/18723 | 1.18e-05 | 2.77e-04 | 118 |
| GO:00459362 | Colorectum | MSS | negative regulation of phosphate metabolic process | 117/3467 | 441/18723 | 1.74e-05 | 3.84e-04 | 117 |
| GO:00423262 | Colorectum | MSS | negative regulation of phosphorylation | 103/3467 | 385/18723 | 3.76e-05 | 7.17e-04 | 103 |
| GO:00336732 | Colorectum | MSS | negative regulation of kinase activity | 66/3467 | 237/18723 | 2.63e-04 | 3.54e-03 | 66 |
| GO:0010563111 | Esophagus | ESCC | negative regulation of phosphorus metabolic process | 274/8552 | 442/18723 | 2.32e-12 | 9.41e-11 | 274 |
| Page: 1 2 3 |
| Pathway ID | Tissue | Disease Stage | Description | Gene Ratio | Bg Ratio | pvalue | p.adjust | qvalue | Count |
| Page: 1 |
Top |
Cell-cell communication analysis |
| Identification of potential cell-cell interactions between two cell types and their ligand-receptor pairs for different disease states |
| Ligand | Receptor | LRpair | Pathway | Tissue | Disease Stage |
| Page: 1 |
Top |
Single-cell gene regulatory network inference analysis |
| Find out the significant the regulons (TFs) and the target genes of each regulon across cell types for different disease states |
| TF | Cell Type | Tissue | Disease Stage | Target Gene | RSS | Regulon Activity |
| ∗The dot plots of a searched regulon are shown for all cell subpopulations in each disease state of each tissue based on the regulon specific score inferred using pySCENIC and by calculating the average expression. |
| Page: 1 |
Top |
Somatic mutation of malignant transformation related genes |
| Annotation of somatic variants for genes involved in malignant transformation |
| Hugo Symbol | Variant Class | Variant Classification | dbSNP RS | HGVSc | HGVSp | HGVSp Short | SWISSPROT | BIOTYPE | SIFT | PolyPhen | Tumor Sample Barcode | Tissue | Histology | Sex | Age | Stage | Therapy Types | Drugs | Outcome |
| PIK3IP1 | SNV | Missense_Mutation | rs758274140 | c.739C>T | p.Pro247Ser | p.P247S | Q96FE7 | protein_coding | tolerated(0.76) | benign(0.006) | TCGA-A1-A0SI-01 | Breast | breast invasive carcinoma | Female | <65 | I/II | Unknown | Unknown | SD |
| PIK3IP1 | SNV | Missense_Mutation | c.554N>A | p.Gly185Glu | p.G185E | Q96FE7 | protein_coding | deleterious(0) | probably_damaging(0.999) | TCGA-BH-A0DI-01 | Breast | breast invasive carcinoma | Female | <65 | I/II | Chemotherapy | adriamycin | CR | |
| PIK3IP1 | SNV | Missense_Mutation | novel | c.697N>A | p.Glu233Lys | p.E233K | Q96FE7 | protein_coding | deleterious(0) | probably_damaging(0.996) | TCGA-XX-A89A-01 | Breast | breast invasive carcinoma | Female | >=65 | I/II | Unknown | Unknown | SD |
| PIK3IP1 | SNV | Missense_Mutation | rs376084730 | c.356N>T | p.Ala119Val | p.A119V | Q96FE7 | protein_coding | tolerated(0.27) | benign(0) | TCGA-2W-A8YY-01 | Cervix | cervical & endocervical cancer | Female | <65 | I/II | Chemotherapy | cisplatin | CR |
| PIK3IP1 | SNV | Missense_Mutation | rs752850127 | c.428C>T | p.Ala143Val | p.A143V | Q96FE7 | protein_coding | tolerated(0.24) | benign(0.166) | TCGA-VS-A9UD-01 | Cervix | cervical & endocervical cancer | Female | >=65 | III/IV | Chemotherapy | cisplatin | CR |
| PIK3IP1 | SNV | Missense_Mutation | rs772737278 | c.548N>T | p.Ala183Val | p.A183V | Q96FE7 | protein_coding | tolerated(0.35) | benign(0) | TCGA-CM-6171-01 | Colorectum | colon adenocarcinoma | Female | >=65 | I/II | Unknown | Unknown | SD |
| PIK3IP1 | SNV | Missense_Mutation | c.209N>A | p.Cys70Tyr | p.C70Y | Q96FE7 | protein_coding | deleterious(0) | probably_damaging(0.999) | TCGA-D5-6540-01 | Colorectum | colon adenocarcinoma | Male | >=65 | I/II | Unknown | Unknown | SD | |
| PIK3IP1 | SNV | Missense_Mutation | novel | c.110N>G | p.Gln37Arg | p.Q37R | Q96FE7 | protein_coding | tolerated(0.11) | benign(0.175) | TCGA-F5-6814-01 | Colorectum | rectum adenocarcinoma | Male | <65 | I/II | Unknown | Unknown | SD |
| PIK3IP1 | SNV | Missense_Mutation | novel | c.321N>T | p.Gln107His | p.Q107H | Q96FE7 | protein_coding | tolerated(0.08) | benign(0.365) | TCGA-A5-A0G1-01 | Endometrium | uterine corpus endometrioid carcinoma | Female | >=65 | I/II | Unknown | Unknown | SD |
| PIK3IP1 | SNV | Missense_Mutation | novel | c.547N>A | p.Ala183Thr | p.A183T | Q96FE7 | protein_coding | tolerated(0.22) | benign(0.006) | TCGA-A5-A0VP-01 | Endometrium | uterine corpus endometrioid carcinoma | Female | >=65 | I/II | Unknown | Unknown | SD |
| Page: 1 2 3 |
Top |
Related drugs of malignant transformation related genes |
| Identification of chemicals and drugs interact with genes involved in malignant transfromation |
| (DGIdb 4.0) |
| Entrez ID | Symbol | Category | Interaction Types | Drug Claim Name | Drug Name | PMIDs |
| Page: 1 |

Copyright 2023-Present -The University of Texas Health Science Center at Houston |