| Tissue | Expression Dynamics | Abbreviation |
| Cervix | 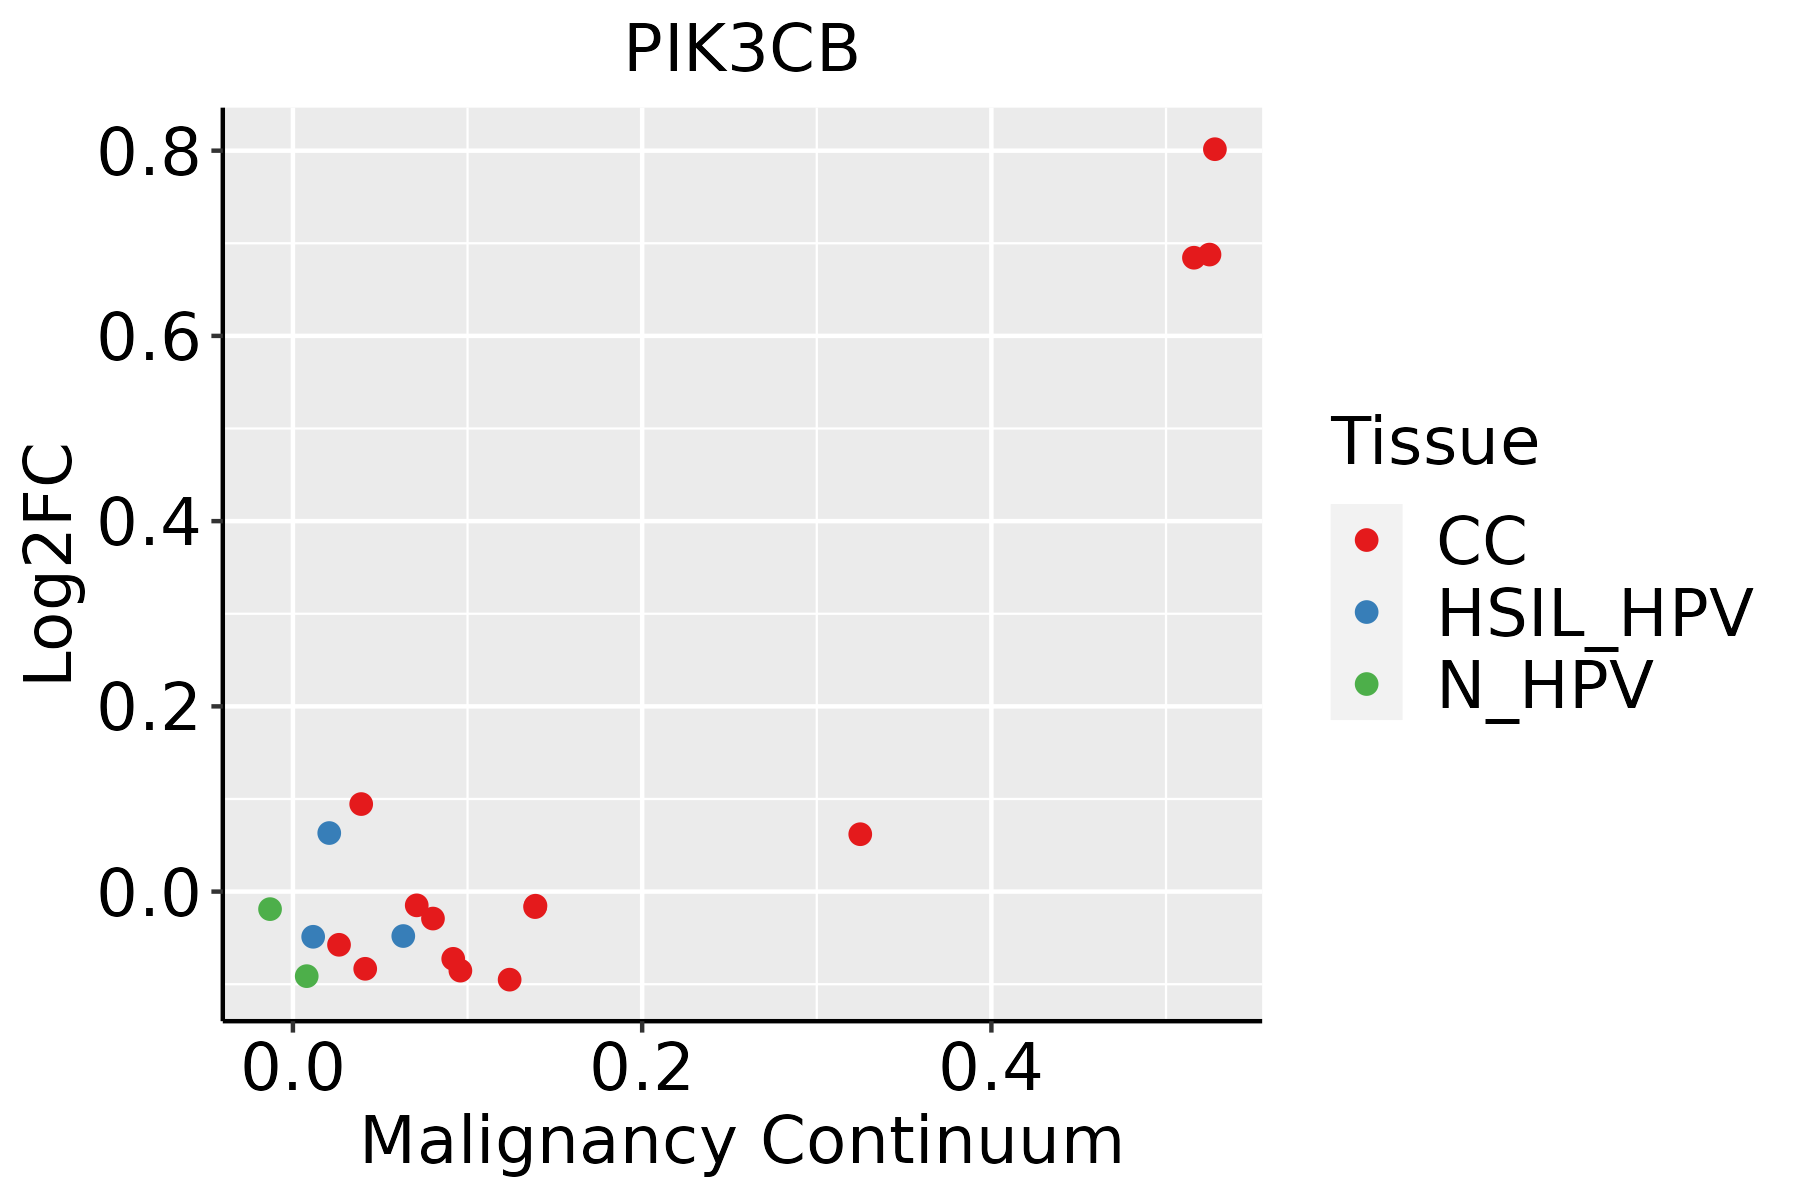 | CC: Cervix cancer |
| HSIL_HPV: HPV-infected high-grade squamous intraepithelial lesions |
| N_HPV: HPV-infected normal cervix |
| Colorectum (GSE201348) |  | FAP: Familial adenomatous polyposis |
| CRC: Colorectal cancer |
| Colorectum (HTA11) |  | AD: Adenomas |
| SER: Sessile serrated lesions |
| MSI-H: Microsatellite-high colorectal cancer |
| MSS: Microsatellite stable colorectal cancer |
| Endometrium | 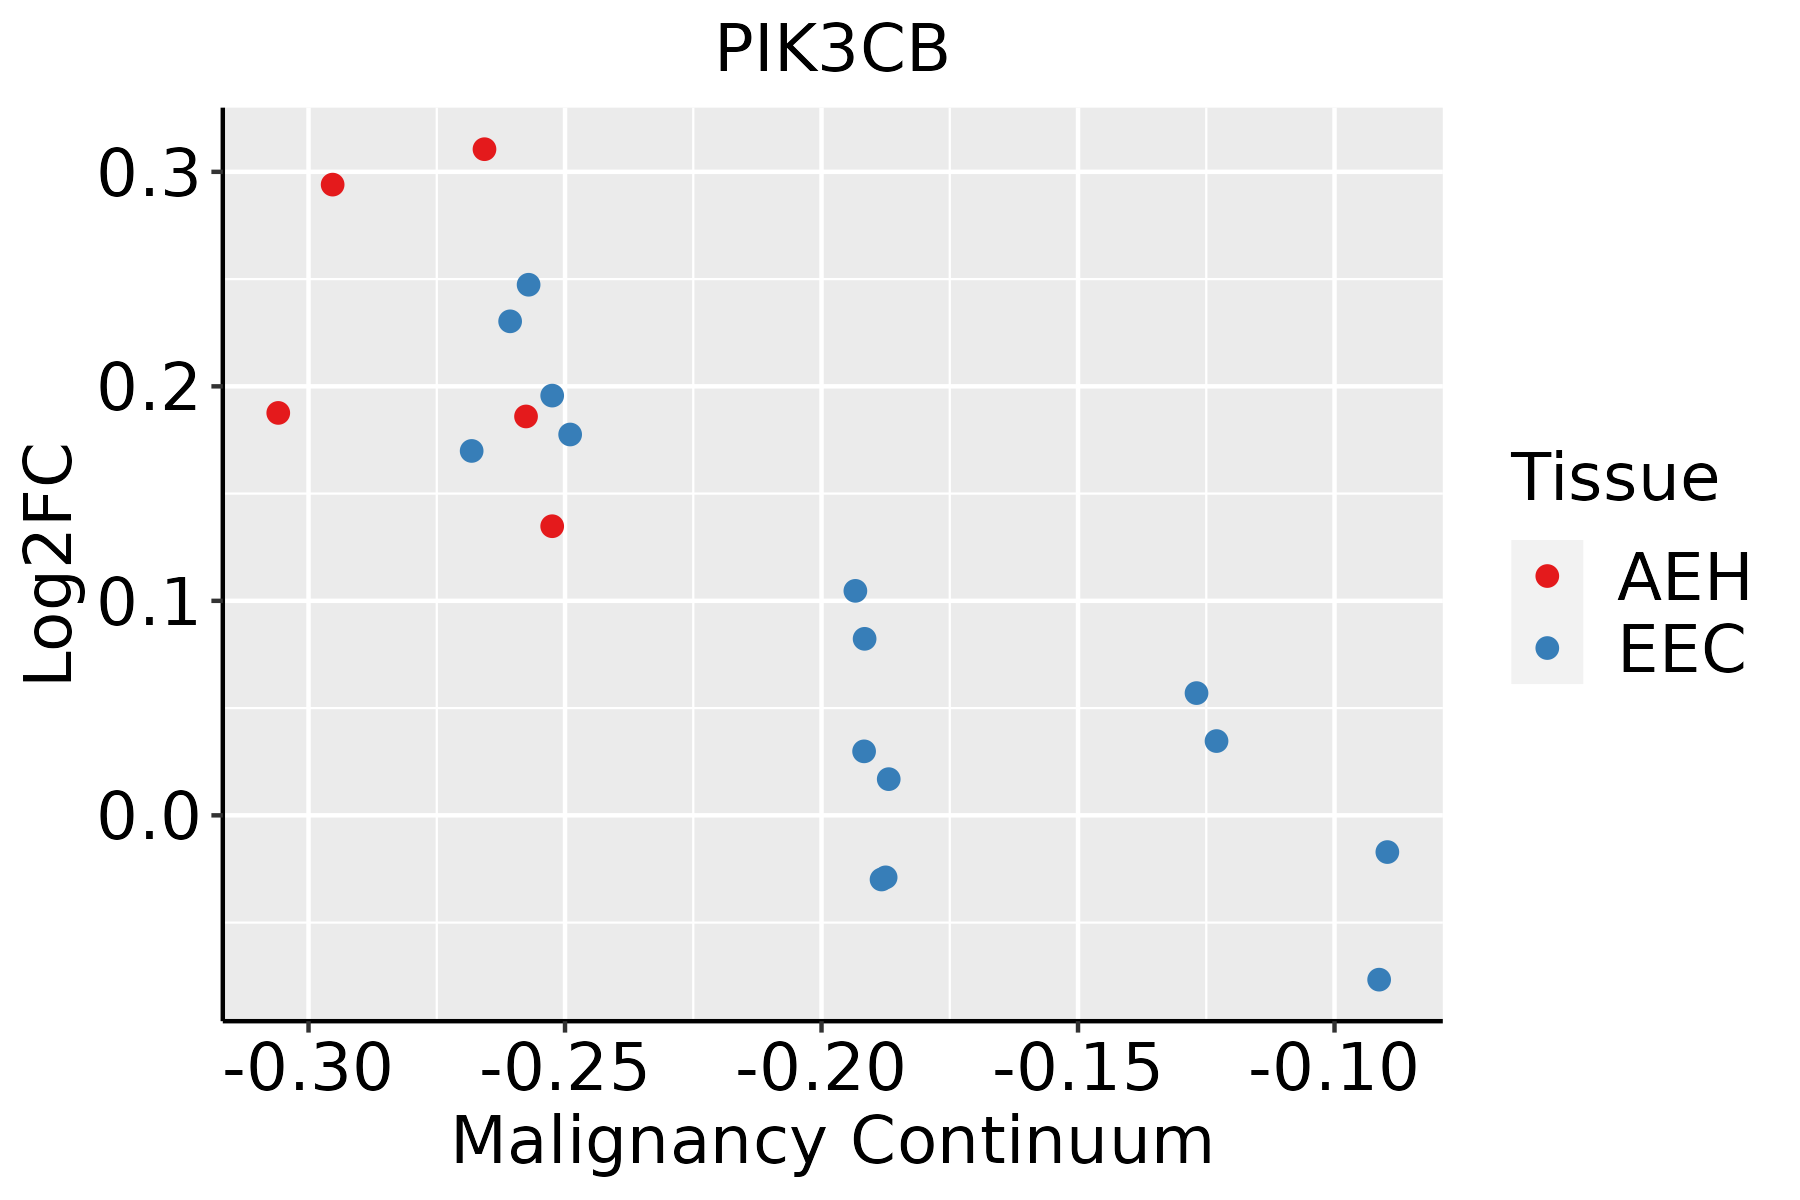 | AEH: Atypical endometrial hyperplasia |
| EEC: Endometrioid Cancer |
| Esophagus | 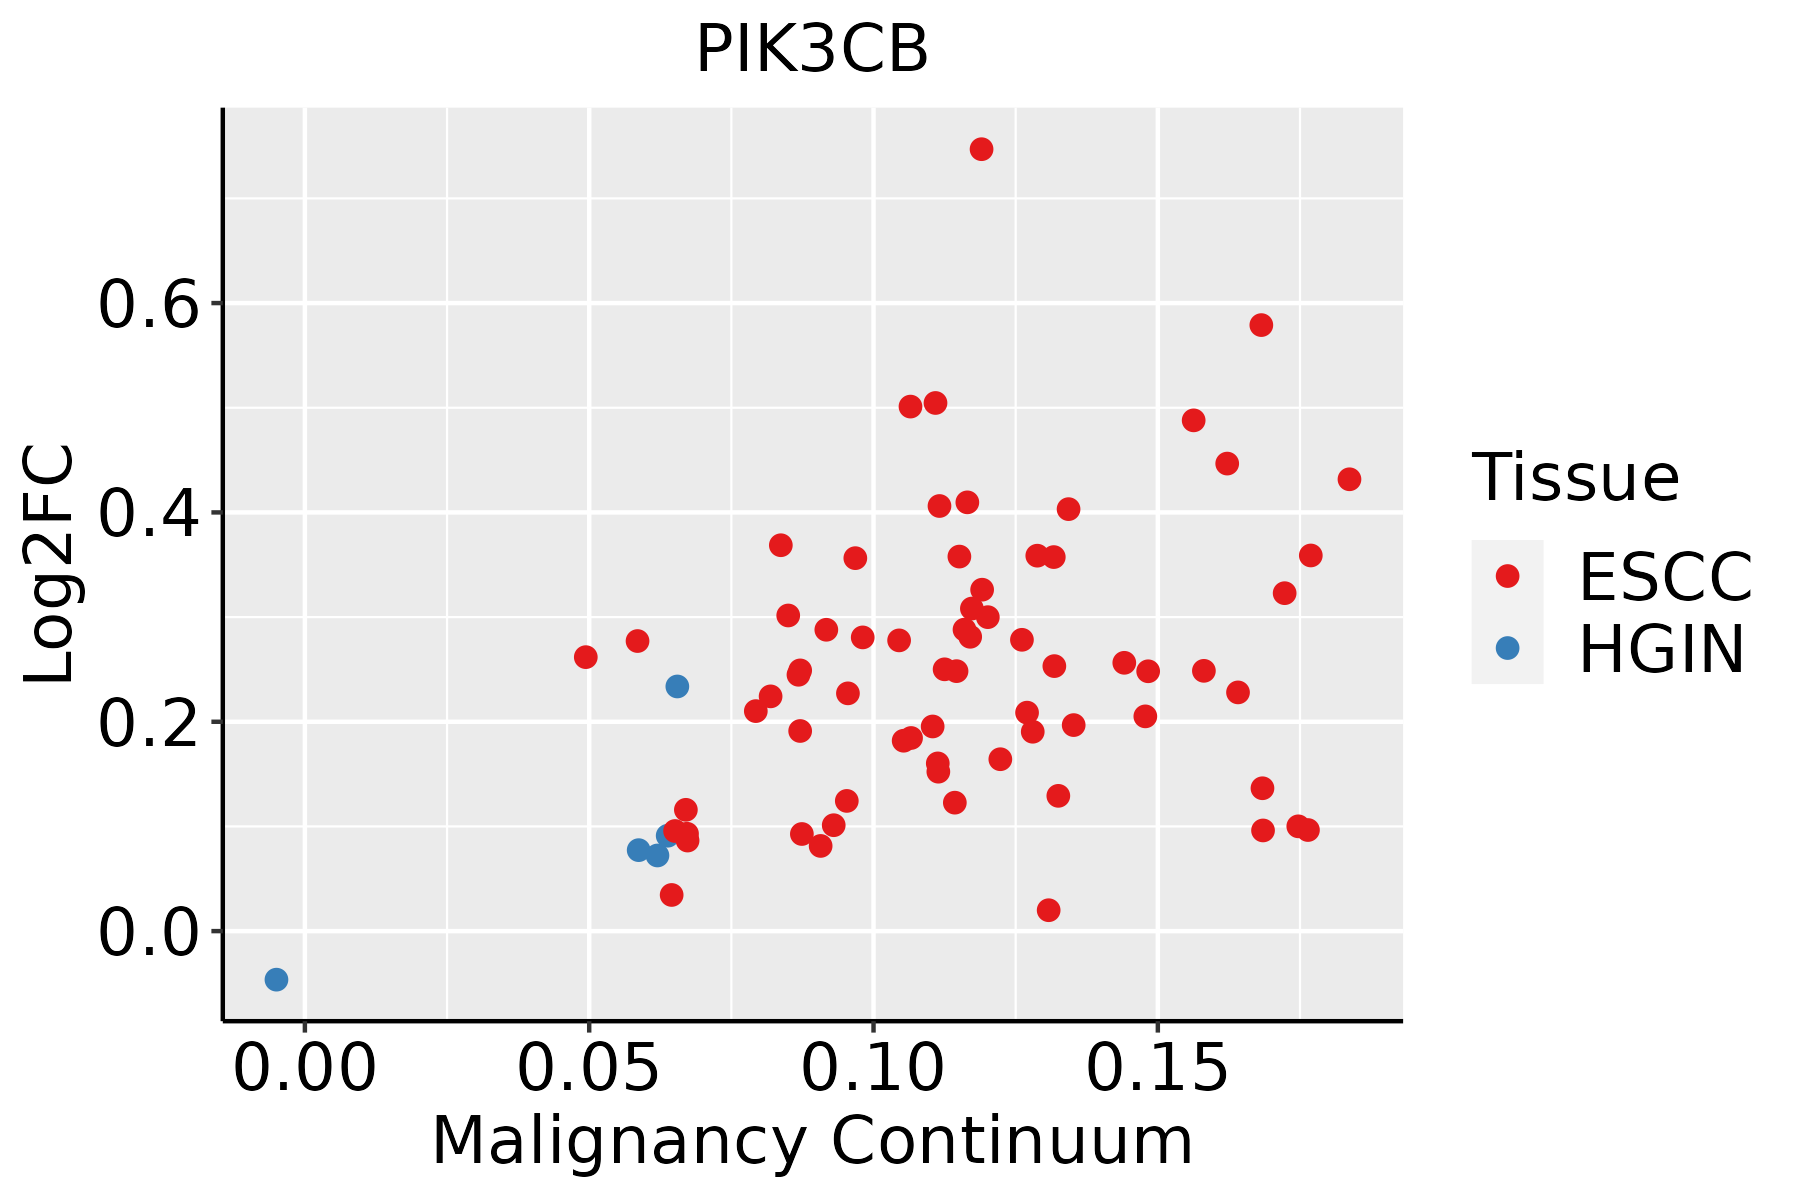 | ESCC: Esophageal squamous cell carcinoma |
| HGIN: High-grade intraepithelial neoplasias |
| LGIN: Low-grade intraepithelial neoplasias |
| Liver |  | HCC: Hepatocellular carcinoma |
| NAFLD: Non-alcoholic fatty liver disease |
| Lung | 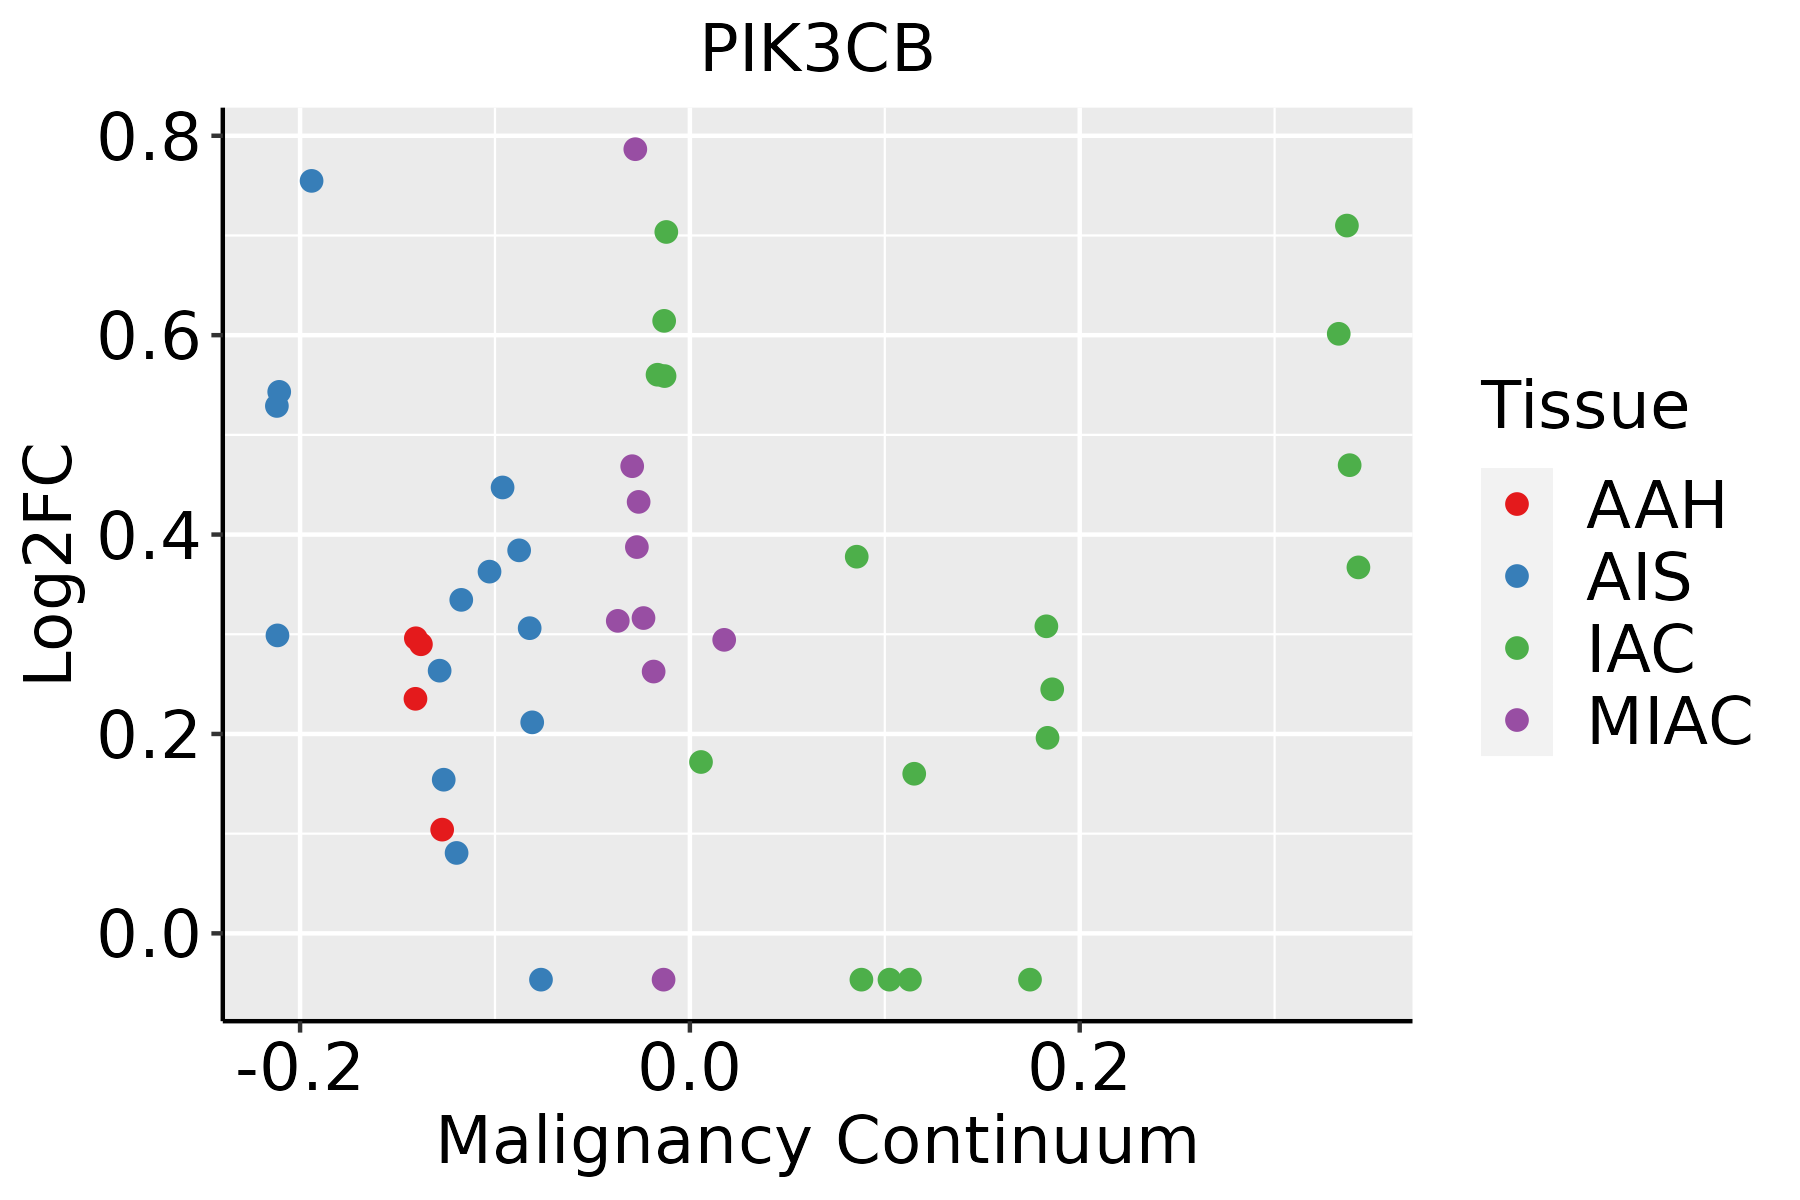 | AAH: Atypical adenomatous hyperplasia |
| AIS: Adenocarcinoma in situ |
| IAC: Invasive lung adenocarcinoma |
| MIA: Minimally invasive adenocarcinoma |
| Oral Cavity |  | EOLP: Erosive Oral lichen planus |
| LP: leukoplakia |
| NEOLP: Non-erosive oral lichen planus |
| OSCC: Oral squamous cell carcinoma |
| Thyroid | 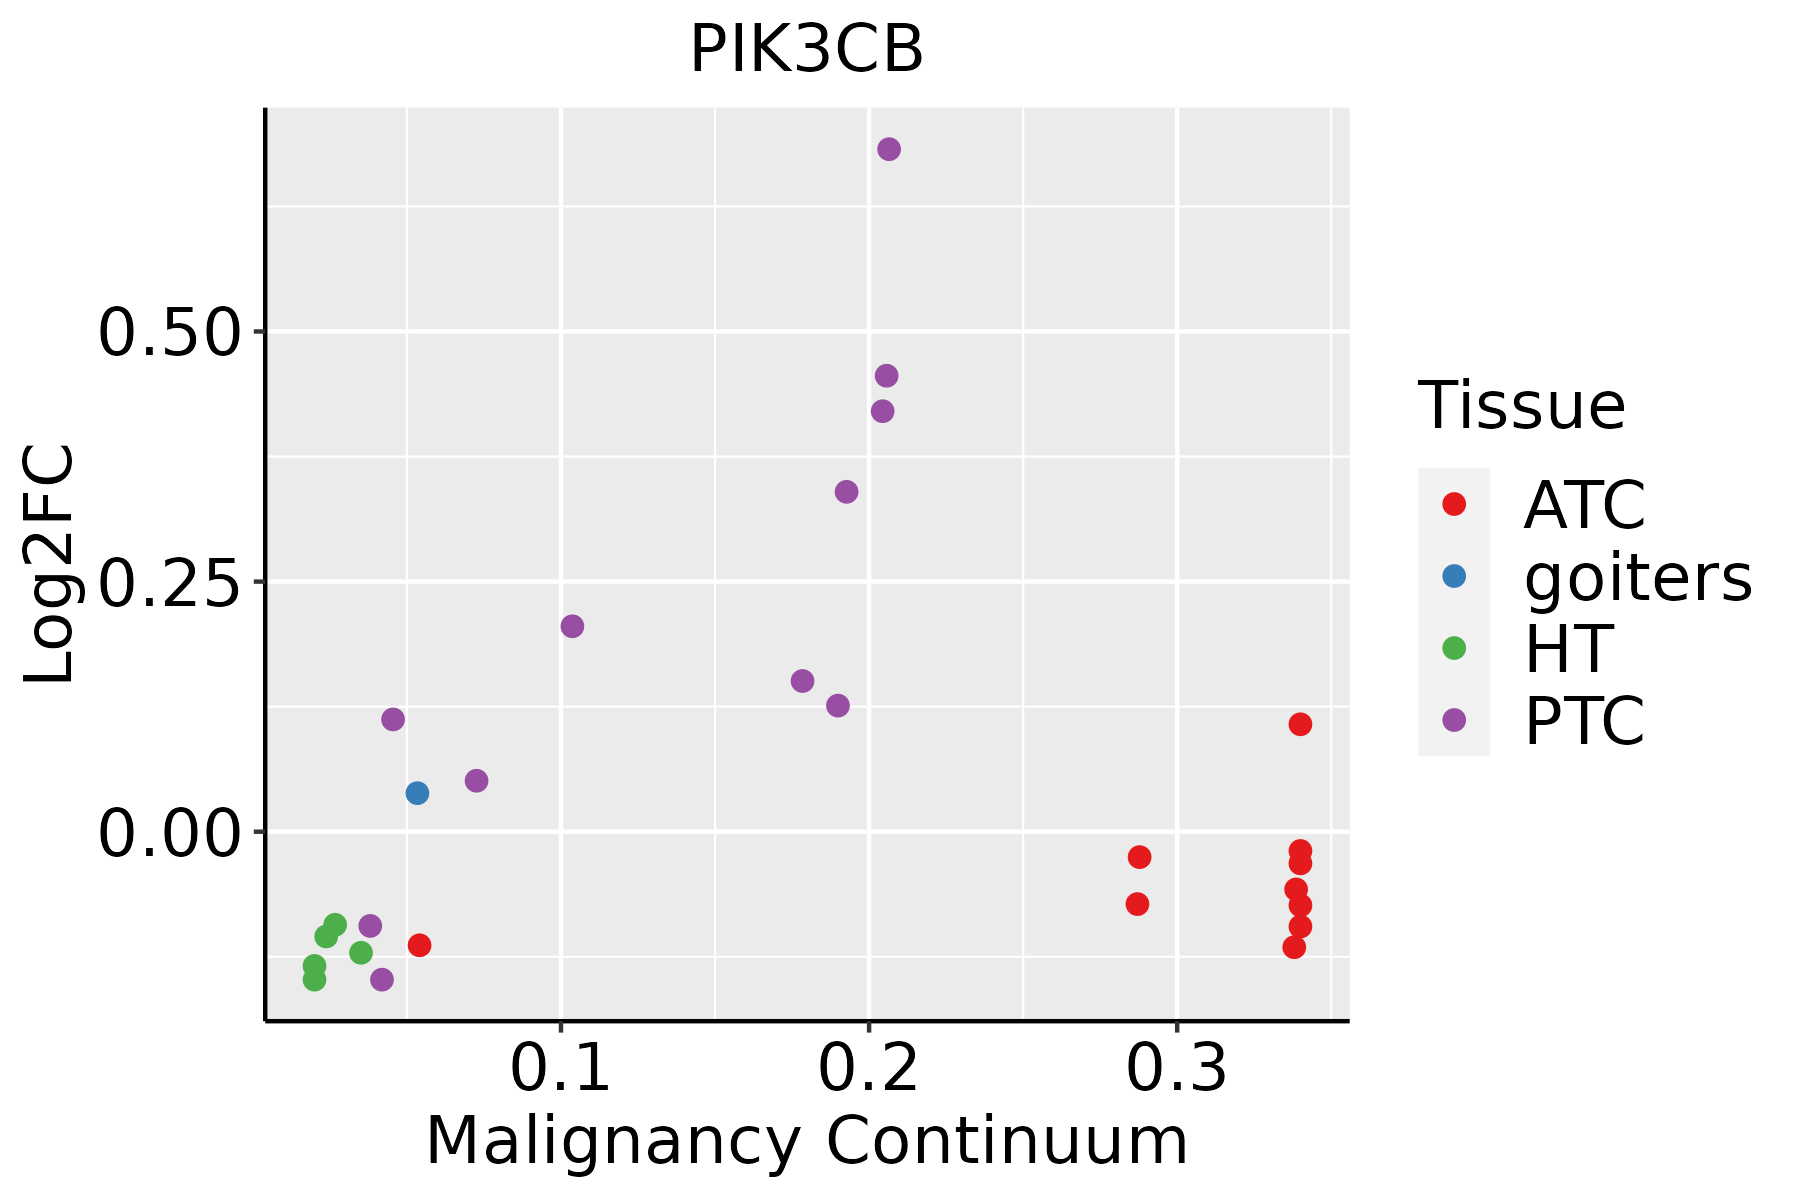 | ATC: Anaplastic thyroid cancer |
| HT: Hashimoto's thyroiditis |
| PTC: Papillary thyroid cancer |
| GO ID | Tissue | Disease Stage | Description | Gene Ratio | Bg Ratio | pvalue | p.adjust | Count |
| GO:004206010 | Cervix | CC | wound healing | 109/2311 | 422/18723 | 1.84e-14 | 1.57e-11 | 109 |
| GO:001081010 | Cervix | CC | regulation of cell-substrate adhesion | 69/2311 | 221/18723 | 8.57e-14 | 5.69e-11 | 69 |
| GO:00315898 | Cervix | CC | cell-substrate adhesion | 96/2311 | 363/18723 | 1.48e-13 | 8.85e-11 | 96 |
| GO:009013210 | Cervix | CC | epithelium migration | 90/2311 | 360/18723 | 2.45e-11 | 6.11e-09 | 90 |
| GO:00016679 | Cervix | CC | ameboidal-type cell migration | 110/2311 | 475/18723 | 2.66e-11 | 6.36e-09 | 110 |
| GO:001063110 | Cervix | CC | epithelial cell migration | 89/2311 | 357/18723 | 3.72e-11 | 8.54e-09 | 89 |
| GO:009013010 | Cervix | CC | tissue migration | 90/2311 | 365/18723 | 5.42e-11 | 1.05e-08 | 90 |
| GO:000989610 | Cervix | CC | positive regulation of catabolic process | 109/2311 | 492/18723 | 5.26e-10 | 6.99e-08 | 109 |
| GO:00510566 | Cervix | CC | regulation of small GTPase mediated signal transduction | 75/2311 | 302/18723 | 1.54e-09 | 1.74e-07 | 75 |
| GO:001063210 | Cervix | CC | regulation of epithelial cell migration | 72/2311 | 292/18723 | 4.52e-09 | 4.43e-07 | 72 |
| GO:00072656 | Cervix | CC | Ras protein signal transduction | 79/2311 | 337/18723 | 9.49e-09 | 7.77e-07 | 79 |
| GO:00019528 | Cervix | CC | regulation of cell-matrix adhesion | 40/2311 | 128/18723 | 1.32e-08 | 1.04e-06 | 40 |
| GO:00071608 | Cervix | CC | cell-matrix adhesion | 60/2311 | 233/18723 | 1.58e-08 | 1.23e-06 | 60 |
| GO:003133110 | Cervix | CC | positive regulation of cellular catabolic process | 91/2311 | 427/18723 | 9.64e-08 | 5.25e-06 | 91 |
| GO:00106349 | Cervix | CC | positive regulation of epithelial cell migration | 47/2311 | 176/18723 | 1.73e-07 | 8.01e-06 | 47 |
| GO:000226210 | Cervix | CC | myeloid cell homeostasis | 43/2311 | 157/18723 | 2.66e-07 | 1.12e-05 | 43 |
| GO:004887210 | Cervix | CC | homeostasis of number of cells | 61/2311 | 272/18723 | 2.17e-06 | 6.55e-05 | 61 |
| GO:00719007 | Cervix | CC | regulation of protein serine/threonine kinase activity | 75/2311 | 359/18723 | 2.76e-06 | 8.02e-05 | 75 |
| GO:005134810 | Cervix | CC | negative regulation of transferase activity | 60/2311 | 268/18723 | 2.77e-06 | 8.02e-05 | 60 |
| GO:004593610 | Cervix | CC | negative regulation of phosphate metabolic process | 88/2311 | 441/18723 | 2.92e-06 | 8.27e-05 | 88 |
| Pathway ID | Tissue | Disease Stage | Description | Gene Ratio | Bg Ratio | pvalue | p.adjust | qvalue | Count |
| hsa0517120 | Cervix | CC | Coronavirus disease - COVID-19 | 111/1267 | 232/8465 | 1.82e-33 | 5.90e-31 | 3.49e-31 | 111 |
| hsa0520820 | Cervix | CC | Chemical carcinogenesis - reactive oxygen species | 92/1267 | 223/8465 | 4.71e-22 | 5.09e-20 | 3.01e-20 | 92 |
| hsa0502018 | Cervix | CC | Prion disease | 98/1267 | 273/8465 | 2.64e-18 | 1.42e-16 | 8.42e-17 | 98 |
| hsa0541520 | Cervix | CC | Diabetic cardiomyopathy | 76/1267 | 203/8465 | 1.40e-15 | 6.46e-14 | 3.82e-14 | 76 |
| hsa0501018 | Cervix | CC | Alzheimer disease | 113/1267 | 384/8465 | 9.67e-14 | 3.92e-12 | 2.32e-12 | 113 |
| hsa0493218 | Cervix | CC | Non-alcoholic fatty liver disease | 58/1267 | 155/8465 | 3.58e-12 | 1.05e-10 | 6.23e-11 | 58 |
| hsa0541820 | Cervix | CC | Fluid shear stress and atherosclerosis | 50/1267 | 139/8465 | 5.71e-10 | 1.32e-08 | 7.81e-09 | 50 |
| hsa0513220 | Cervix | CC | Salmonella infection | 74/1267 | 249/8465 | 1.33e-09 | 2.54e-08 | 1.50e-08 | 74 |
| hsa0541720 | Cervix | CC | Lipid and atherosclerosis | 65/1267 | 215/8465 | 6.47e-09 | 1.10e-07 | 6.52e-08 | 65 |
| hsa0516720 | Cervix | CC | Kaposi sarcoma-associated herpesvirus infection | 60/1267 | 194/8465 | 9.74e-09 | 1.58e-07 | 9.33e-08 | 60 |
| hsa0516318 | Cervix | CC | Human cytomegalovirus infection | 65/1267 | 225/8465 | 4.59e-08 | 6.47e-07 | 3.83e-07 | 65 |
| hsa0513120 | Cervix | CC | Shigellosis | 69/1267 | 247/8465 | 7.64e-08 | 1.03e-06 | 6.10e-07 | 69 |
| hsa0520516 | Cervix | CC | Proteoglycans in cancer | 60/1267 | 205/8465 | 9.13e-08 | 1.18e-06 | 7.00e-07 | 60 |
| hsa0421810 | Cervix | CC | Cellular senescence | 49/1267 | 156/8465 | 1.30e-07 | 1.63e-06 | 9.61e-07 | 49 |
| hsa0451010 | Cervix | CC | Focal adhesion | 59/1267 | 203/8465 | 1.53e-07 | 1.84e-06 | 1.09e-06 | 59 |
| hsa0481016 | Cervix | CC | Regulation of actin cytoskeleton | 64/1267 | 229/8465 | 2.24e-07 | 2.59e-06 | 1.53e-06 | 64 |
| hsa0491520 | Cervix | CC | Estrogen signaling pathway | 44/1267 | 138/8465 | 3.55e-07 | 3.97e-06 | 2.35e-06 | 44 |
| hsa0516920 | Cervix | CC | Epstein-Barr virus infection | 57/1267 | 202/8465 | 7.30e-07 | 7.39e-06 | 4.37e-06 | 57 |
| hsa0516620 | Cervix | CC | Human T-cell leukemia virus 1 infection | 61/1267 | 222/8465 | 8.13e-07 | 7.98e-06 | 4.72e-06 | 61 |
| hsa0467020 | Cervix | CC | Leukocyte transendothelial migration | 36/1267 | 114/8465 | 5.22e-06 | 4.83e-05 | 2.86e-05 | 36 |
| Hugo Symbol | Variant Class | Variant Classification | dbSNP RS | HGVSc | HGVSp | HGVSp Short | SWISSPROT | BIOTYPE | SIFT | PolyPhen | Tumor Sample Barcode | Tissue | Histology | Sex | Age | Stage | Therapy Types | Drugs | Outcome |
| PIK3CB | SNV | Missense_Mutation | | c.1491N>C | p.Glu497Asp | p.E497D | P42338 | protein_coding | tolerated(0.18) | benign(0.02) | TCGA-A2-A0SY-01 | Breast | breast invasive carcinoma | Female | <65 | III/IV | Hormone Therapy | arimidex | SD |
| PIK3CB | SNV | Missense_Mutation | novel | c.1933N>T | p.Val645Leu | p.V645L | P42338 | protein_coding | deleterious(0.01) | probably_damaging(0.932) | TCGA-A8-A0A2-01 | Breast | breast invasive carcinoma | Female | >=65 | I/II | Hormone Therapy | tamoxiphen | SD |
| PIK3CB | SNV | Missense_Mutation | rs774181749 | c.308N>A | p.Arg103Lys | p.R103K | P42338 | protein_coding | tolerated(0.35) | benign(0.206) | TCGA-A8-A0A7-01 | Breast | breast invasive carcinoma | Female | <65 | I/II | Unknown | Unknown | SD |
| PIK3CB | SNV | Missense_Mutation | | c.2302N>T | p.Leu768Phe | p.L768F | P42338 | protein_coding | deleterious(0.05) | benign(0.41) | TCGA-AN-A04A-01 | Breast | breast invasive carcinoma | Female | <65 | III/IV | Unknown | Unknown | SD |
| PIK3CB | SNV | Missense_Mutation | | c.911T>G | p.Ile304Arg | p.I304R | P42338 | protein_coding | tolerated(0.74) | benign(0.065) | TCGA-AN-A0AM-01 | Breast | breast invasive carcinoma | Female | <65 | I/II | Unknown | Unknown | SD |
| PIK3CB | SNV | Missense_Mutation | | c.3040G>A | p.Glu1014Lys | p.E1014K | P42338 | protein_coding | deleterious(0) | probably_damaging(0.999) | TCGA-AO-A0JC-01 | Breast | breast invasive carcinoma | Female | <65 | I/II | Chemotherapy | fluorouracil | SD |
| PIK3CB | SNV | Missense_Mutation | rs768628634 | c.2189N>T | p.Ala730Val | p.A730V | P42338 | protein_coding | tolerated(0.11) | benign(0.101) | TCGA-D8-A1J8-01 | Breast | breast invasive carcinoma | Female | >=65 | I/II | Hormone Therapy | nolvadex | SD |
| PIK3CB | SNV | Missense_Mutation | | c.3151N>A | p.Glu1051Lys | p.E1051K | P42338 | protein_coding | deleterious(0.03) | possibly_damaging(0.459) | TCGA-D8-A1JC-01 | Breast | breast invasive carcinoma | Female | <65 | III/IV | Chemotherapy | adriamycin | SD |
| PIK3CB | SNV | Missense_Mutation | | c.1658A>G | p.Asn553Ser | p.N553S | P42338 | protein_coding | tolerated(0.26) | benign(0.365) | TCGA-E2-A14Z-01 | Breast | breast invasive carcinoma | Female | <65 | I/II | Hormone Therapy | arimidex | PD |
| PIK3CB | insertion | Nonsense_Mutation | novel | c.3128_3129insTTTTGTTGTCCTTCTTAATGTTCTCAGTCAAATAAATGAGTG | p.Gln1043delinsHisPheValValLeuLeuAsnValLeuSerGlnIleAsnGluTer | p.Q1043delinsHFVVLLNVLSQINE* | P42338 | protein_coding | | | TCGA-AO-A0J9-01 | Breast | breast invasive carcinoma | Female | <65 | III/IV | Chemotherapy | cyclophosphamide | PD |
| Entrez ID | Symbol | Category | Interaction Types | Drug Claim Name | Drug Name | PMIDs |
| 5291 | PIK3CB | CLINICALLY ACTIONABLE, ENZYME, DRUGGABLE GENOME, PHOSPHATIDYLINOSITOL 3 KINASE, KINASE, G PROTEIN COUPLED RECEPTOR | inhibitor | 249565691 | CHEMBL1086377 | |
| 5291 | PIK3CB | CLINICALLY ACTIONABLE, ENZYME, DRUGGABLE GENOME, PHOSPHATIDYLINOSITOL 3 KINASE, KINASE, G PROTEIN COUPLED RECEPTOR | inhibitor | BYL719 | ALPELISIB | |
| 5291 | PIK3CB | CLINICALLY ACTIONABLE, ENZYME, DRUGGABLE GENOME, PHOSPHATIDYLINOSITOL 3 KINASE, KINASE, G PROTEIN COUPLED RECEPTOR | inhibitor | BYL719 | ALPELISIB | |
| 5291 | PIK3CB | CLINICALLY ACTIONABLE, ENZYME, DRUGGABLE GENOME, PHOSPHATIDYLINOSITOL 3 KINASE, KINASE, G PROTEIN COUPLED RECEPTOR | inhibitor | CHEMBL2219421 | RECILISIB | |
| 5291 | PIK3CB | CLINICALLY ACTIONABLE, ENZYME, DRUGGABLE GENOME, PHOSPHATIDYLINOSITOL 3 KINASE, KINASE, G PROTEIN COUPLED RECEPTOR | inhibitor | 249565646 | PILARALISIB | |
| 5291 | PIK3CB | CLINICALLY ACTIONABLE, ENZYME, DRUGGABLE GENOME, PHOSPHATIDYLINOSITOL 3 KINASE, KINASE, G PROTEIN COUPLED RECEPTOR | inhibitor | 249565693 | | |
| 5291 | PIK3CB | CLINICALLY ACTIONABLE, ENZYME, DRUGGABLE GENOME, PHOSPHATIDYLINOSITOL 3 KINASE, KINASE, G PROTEIN COUPLED RECEPTOR | inhibitor | CHEMBL2387080 | TASELISIB | |
| 5291 | PIK3CB | CLINICALLY ACTIONABLE, ENZYME, DRUGGABLE GENOME, PHOSPHATIDYLINOSITOL 3 KINASE, KINASE, G PROTEIN COUPLED RECEPTOR | | SURAMIN | SURAMIN | 15833899,11473364 |
| 5291 | PIK3CB | CLINICALLY ACTIONABLE, ENZYME, DRUGGABLE GENOME, PHOSPHATIDYLINOSITOL 3 KINASE, KINASE, G PROTEIN COUPLED RECEPTOR | inhibitor | 178102645 | | |
| 5291 | PIK3CB | CLINICALLY ACTIONABLE, ENZYME, DRUGGABLE GENOME, PHOSPHATIDYLINOSITOL 3 KINASE, KINASE, G PROTEIN COUPLED RECEPTOR | | Buparlisib | BUPARLISIB | |


