
|
|||||
|
 | |
| |
| |
| |
| |
| |
|
Gene: PIK3C2G |
Gene summary for PIK3C2G |
| Gene information | Species | Human | Gene symbol | PIK3C2G | Gene ID | 5288 |
| Gene name | phosphatidylinositol-4-phosphate 3-kinase catalytic subunit type 2 gamma | |
| Gene Alias | PI3K-C2-gamma | |
| Cytomap | 12p12.3 | |
| Gene Type | protein-coding | GO ID | GO:0006629 | UniProtAcc | B7ZLY6 |
Top |
Malignant transformation analysis |
| Identification of the aberrant gene expression in precancerous and cancerous lesions by comparing the gene expression of stem-like cells in diseased tissues with normal stem cells |
| Entrez ID | Symbol | Replicates | Species | Organ | Tissue | Adj P-value | Log2FC | Malignancy |
| 5288 | PIK3C2G | AEH-subject1 | Human | Endometrium | AEH | 1.85e-09 | 2.53e-01 | -0.3059 |
| 5288 | PIK3C2G | AEH-subject3 | Human | Endometrium | AEH | 8.21e-22 | 5.21e-01 | -0.2576 |
| 5288 | PIK3C2G | LZE8T | Human | Esophagus | ESCC | 6.08e-06 | 3.07e-01 | 0.067 |
| 5288 | PIK3C2G | P1T-E | Human | Esophagus | ESCC | 3.74e-05 | 1.83e-01 | 0.0875 |
| 5288 | PIK3C2G | P4T-E | Human | Esophagus | ESCC | 3.75e-06 | 1.10e-01 | 0.1323 |
| 5288 | PIK3C2G | P10T-E | Human | Esophagus | ESCC | 4.82e-18 | 2.14e-01 | 0.116 |
| 5288 | PIK3C2G | P16T-E | Human | Esophagus | ESCC | 6.09e-69 | 1.43e+00 | 0.1153 |
| 5288 | PIK3C2G | P20T-E | Human | Esophagus | ESCC | 2.61e-72 | 1.54e+00 | 0.1124 |
| 5288 | PIK3C2G | P22T-E | Human | Esophagus | ESCC | 1.64e-08 | 1.17e-01 | 0.1236 |
| 5288 | PIK3C2G | P23T-E | Human | Esophagus | ESCC | 1.42e-06 | 1.24e-01 | 0.108 |
| 5288 | PIK3C2G | P37T-E | Human | Esophagus | ESCC | 8.22e-04 | 6.33e-02 | 0.1371 |
| 5288 | PIK3C2G | P49T-E | Human | Esophagus | ESCC | 1.51e-02 | 2.10e-01 | 0.1768 |
| 5288 | PIK3C2G | P52T-E | Human | Esophagus | ESCC | 2.96e-03 | 9.29e-02 | 0.1555 |
| 5288 | PIK3C2G | P54T-E | Human | Esophagus | ESCC | 1.65e-18 | 2.66e-01 | 0.0975 |
| 5288 | PIK3C2G | P61T-E | Human | Esophagus | ESCC | 5.31e-22 | 4.94e-01 | 0.099 |
| 5288 | PIK3C2G | P62T-E | Human | Esophagus | ESCC | 1.28e-21 | 3.35e-01 | 0.1302 |
| 5288 | PIK3C2G | P74T-E | Human | Esophagus | ESCC | 4.85e-07 | 1.80e-01 | 0.1479 |
| 5288 | PIK3C2G | P79T-E | Human | Esophagus | ESCC | 2.61e-13 | 1.50e-01 | 0.1154 |
| 5288 | PIK3C2G | P91T-E | Human | Esophagus | ESCC | 2.73e-11 | 5.45e-01 | 0.1828 |
| 5288 | PIK3C2G | P104T-E | Human | Esophagus | ESCC | 1.54e-04 | 4.14e-01 | 0.0931 |
| Page: 1 2 3 4 |
| Tissue | Expression Dynamics | Abbreviation |
| Endometrium | 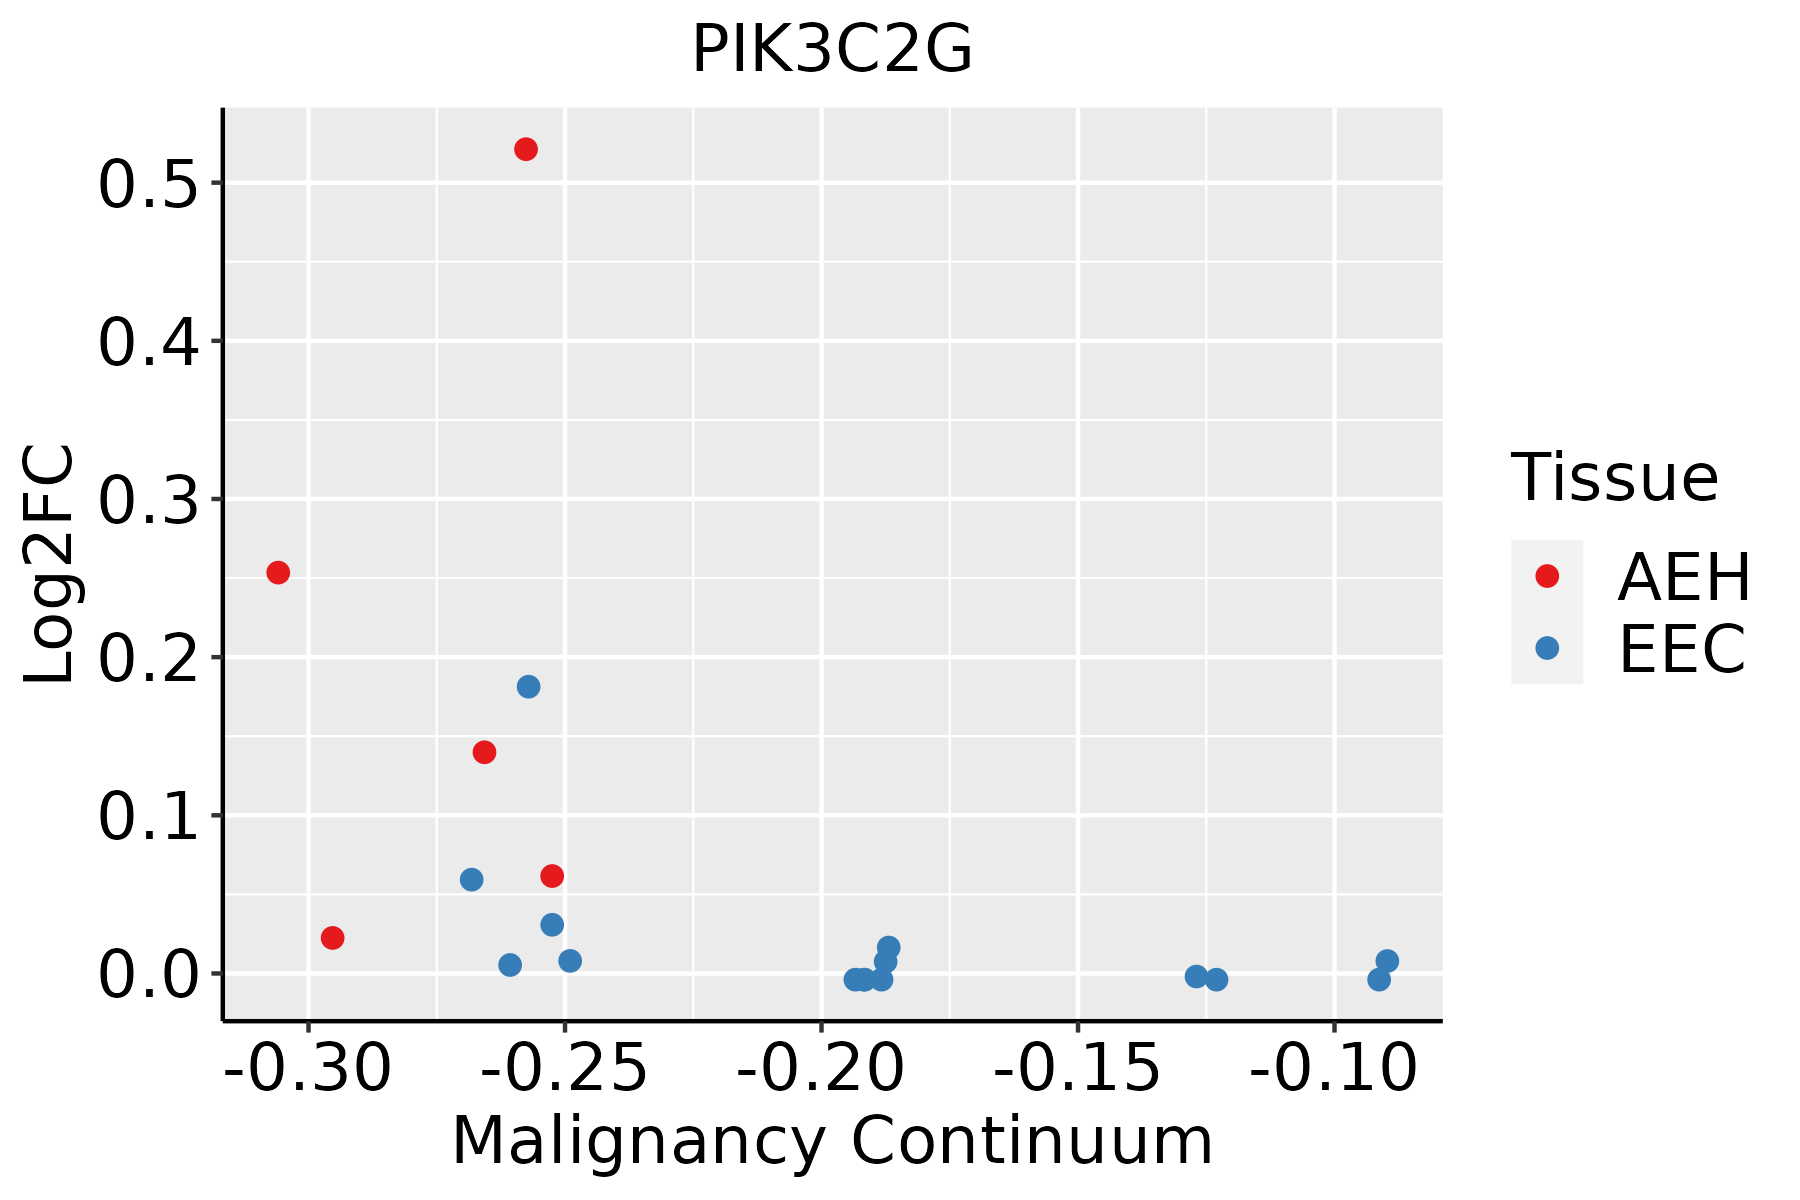 | AEH: Atypical endometrial hyperplasia |
| EEC: Endometrioid Cancer | ||
| Esophagus |  | ESCC: Esophageal squamous cell carcinoma |
| HGIN: High-grade intraepithelial neoplasias | ||
| LGIN: Low-grade intraepithelial neoplasias | ||
| GC | 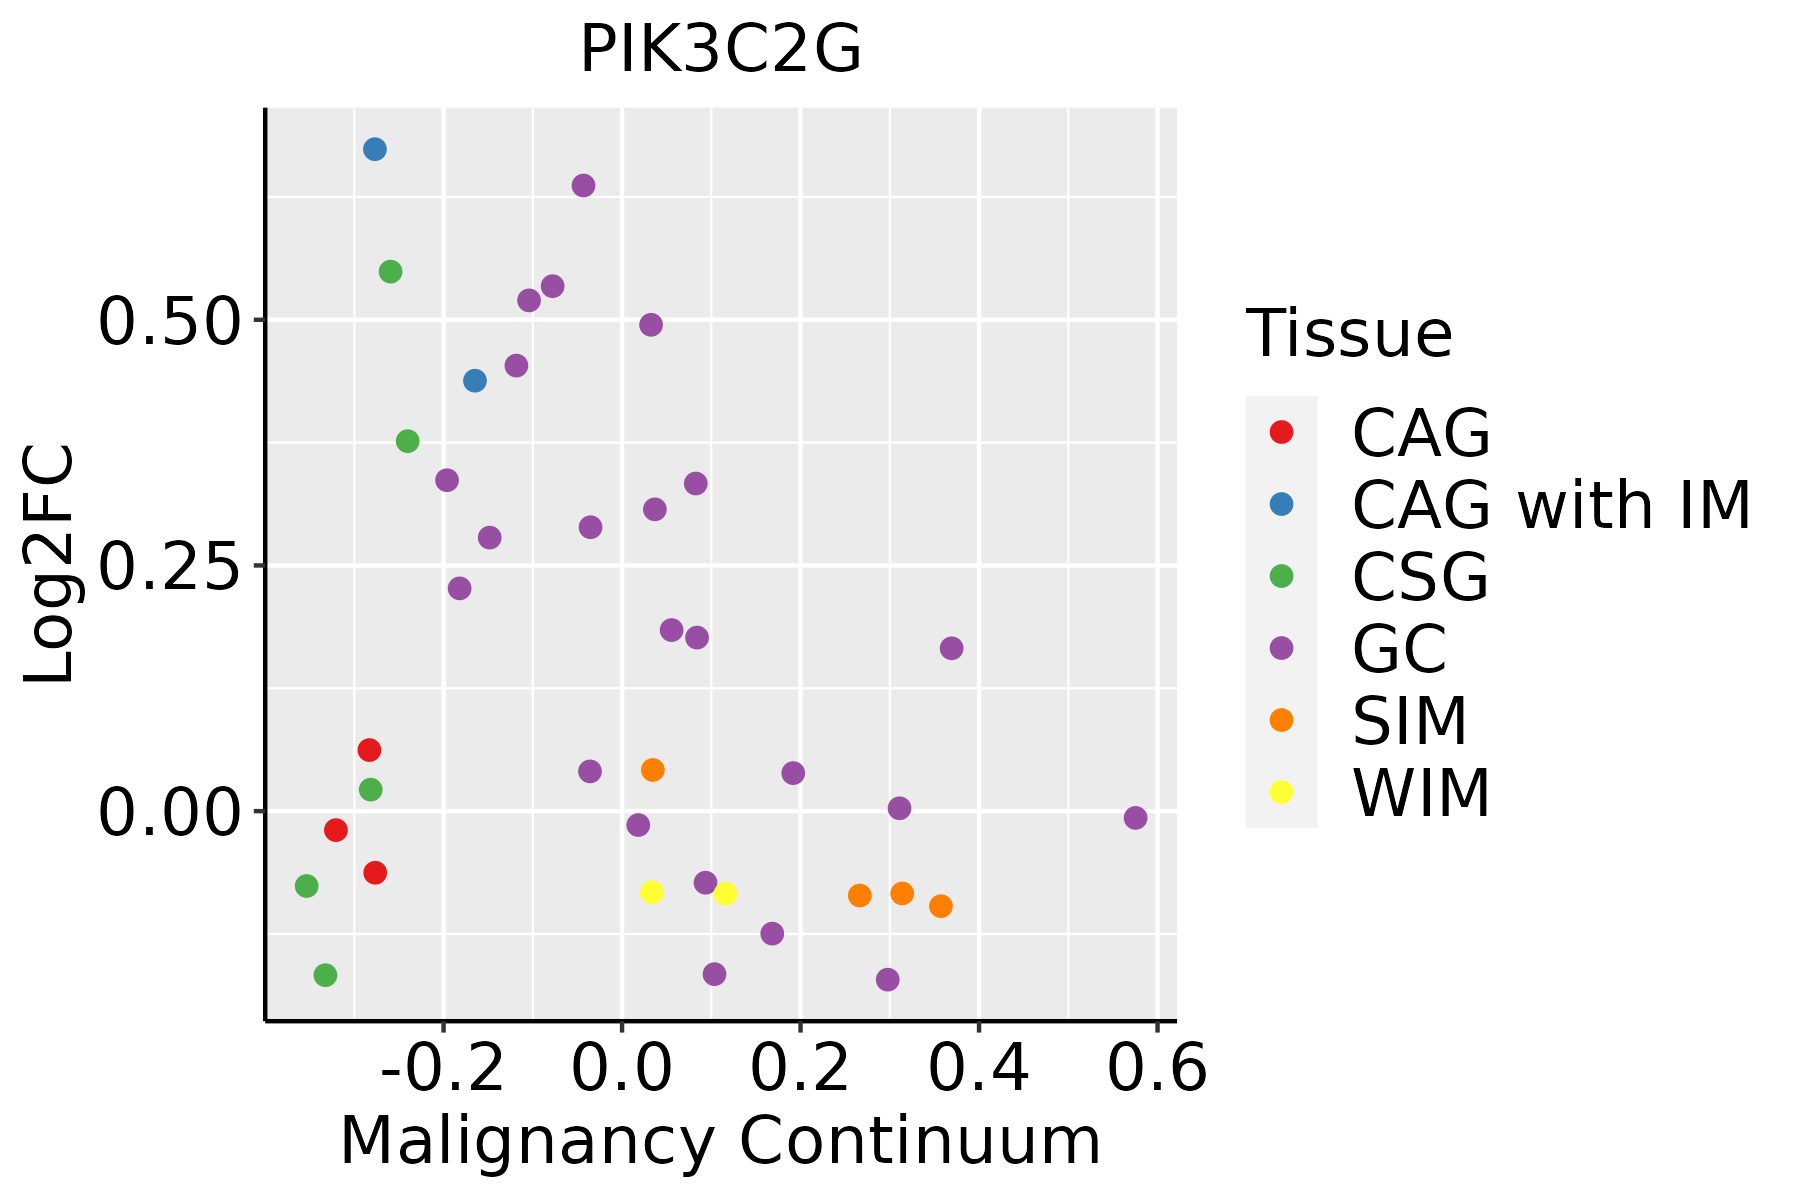 | CAG: Chronic atrophic gastritis |
| CAG with IM: Chronic atrophic gastritis with intestinal metaplasia | ||
| CSG: Chronic superficial gastritis | ||
| GC: Gastric cancer | ||
| SIM: Severe intestinal metaplasia | ||
| WIM: Wild intestinal metaplasia | ||
| Liver |  | HCC: Hepatocellular carcinoma |
| NAFLD: Non-alcoholic fatty liver disease | ||
| Prostate | 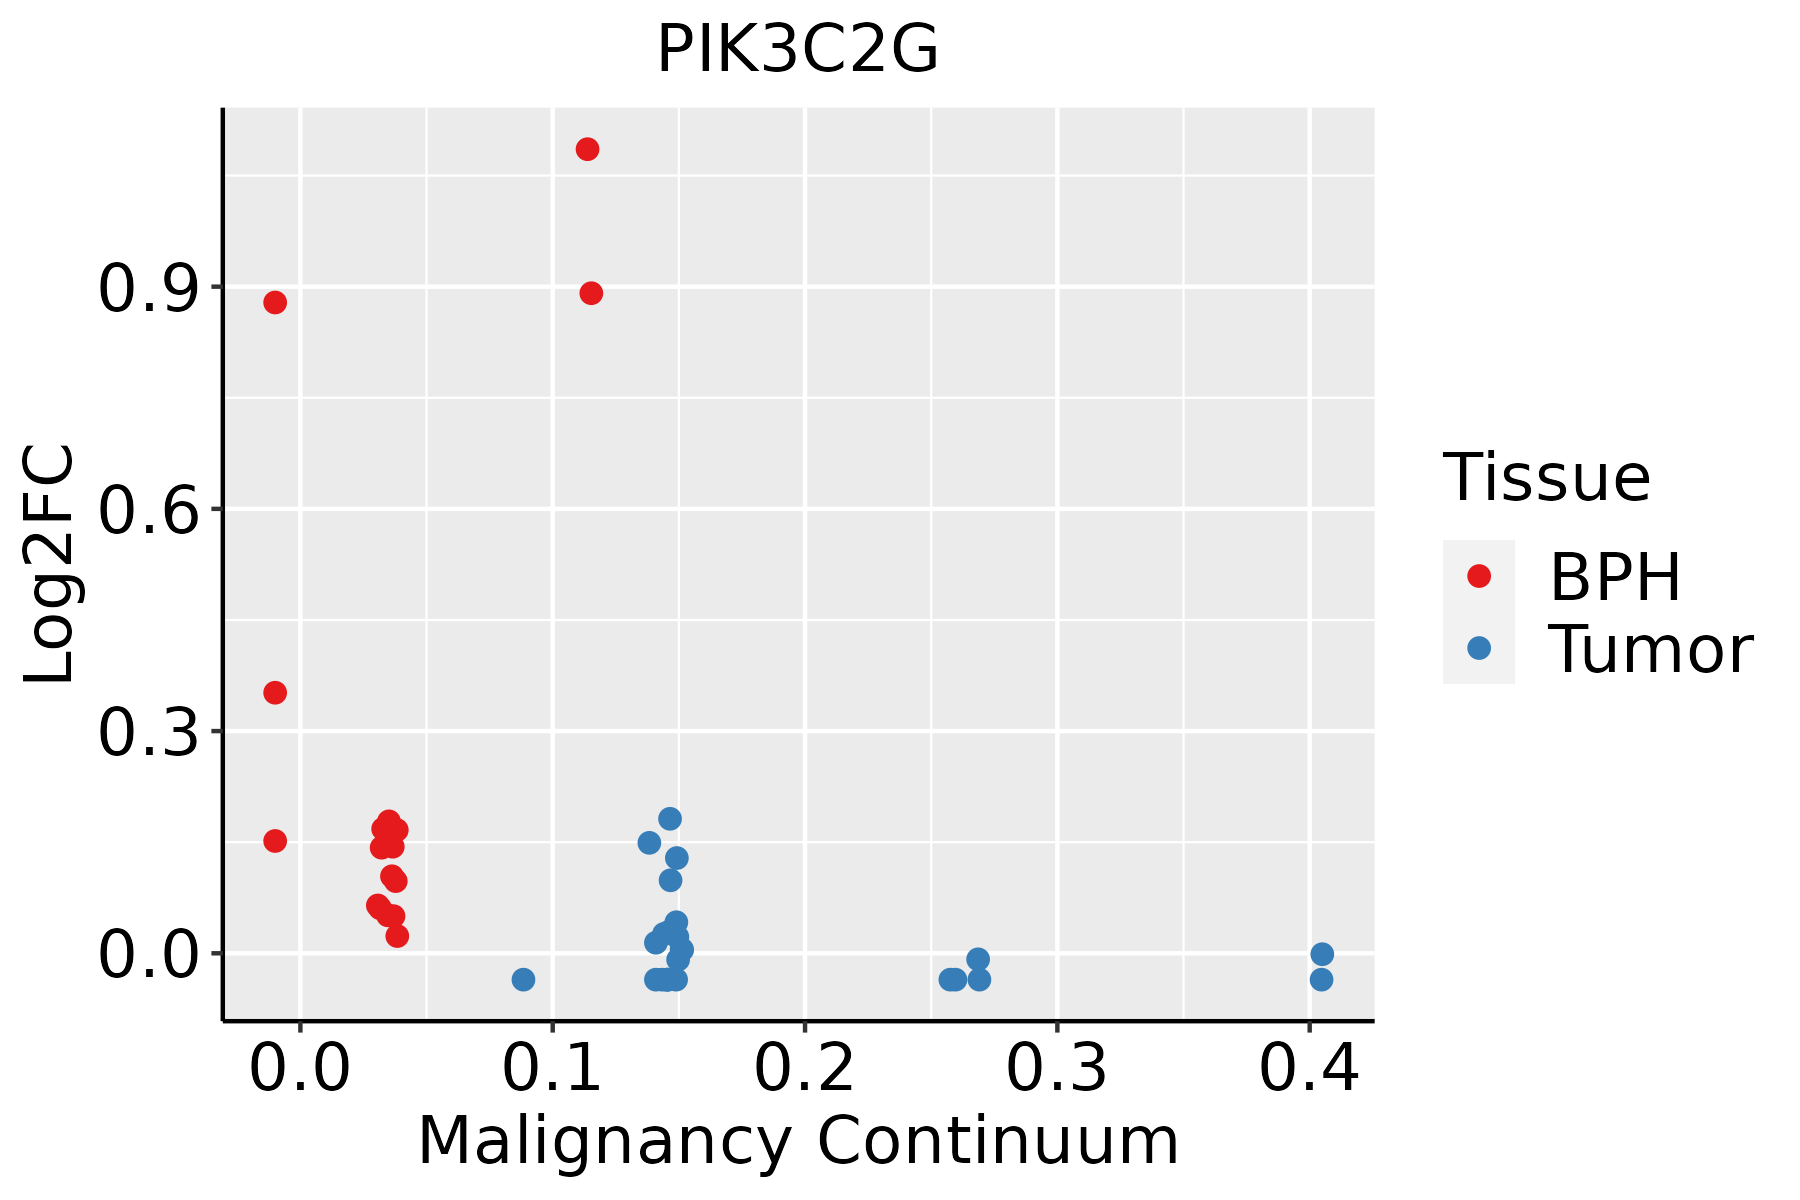 | BPH: Benign Prostatic Hyperplasia |
| Skin | 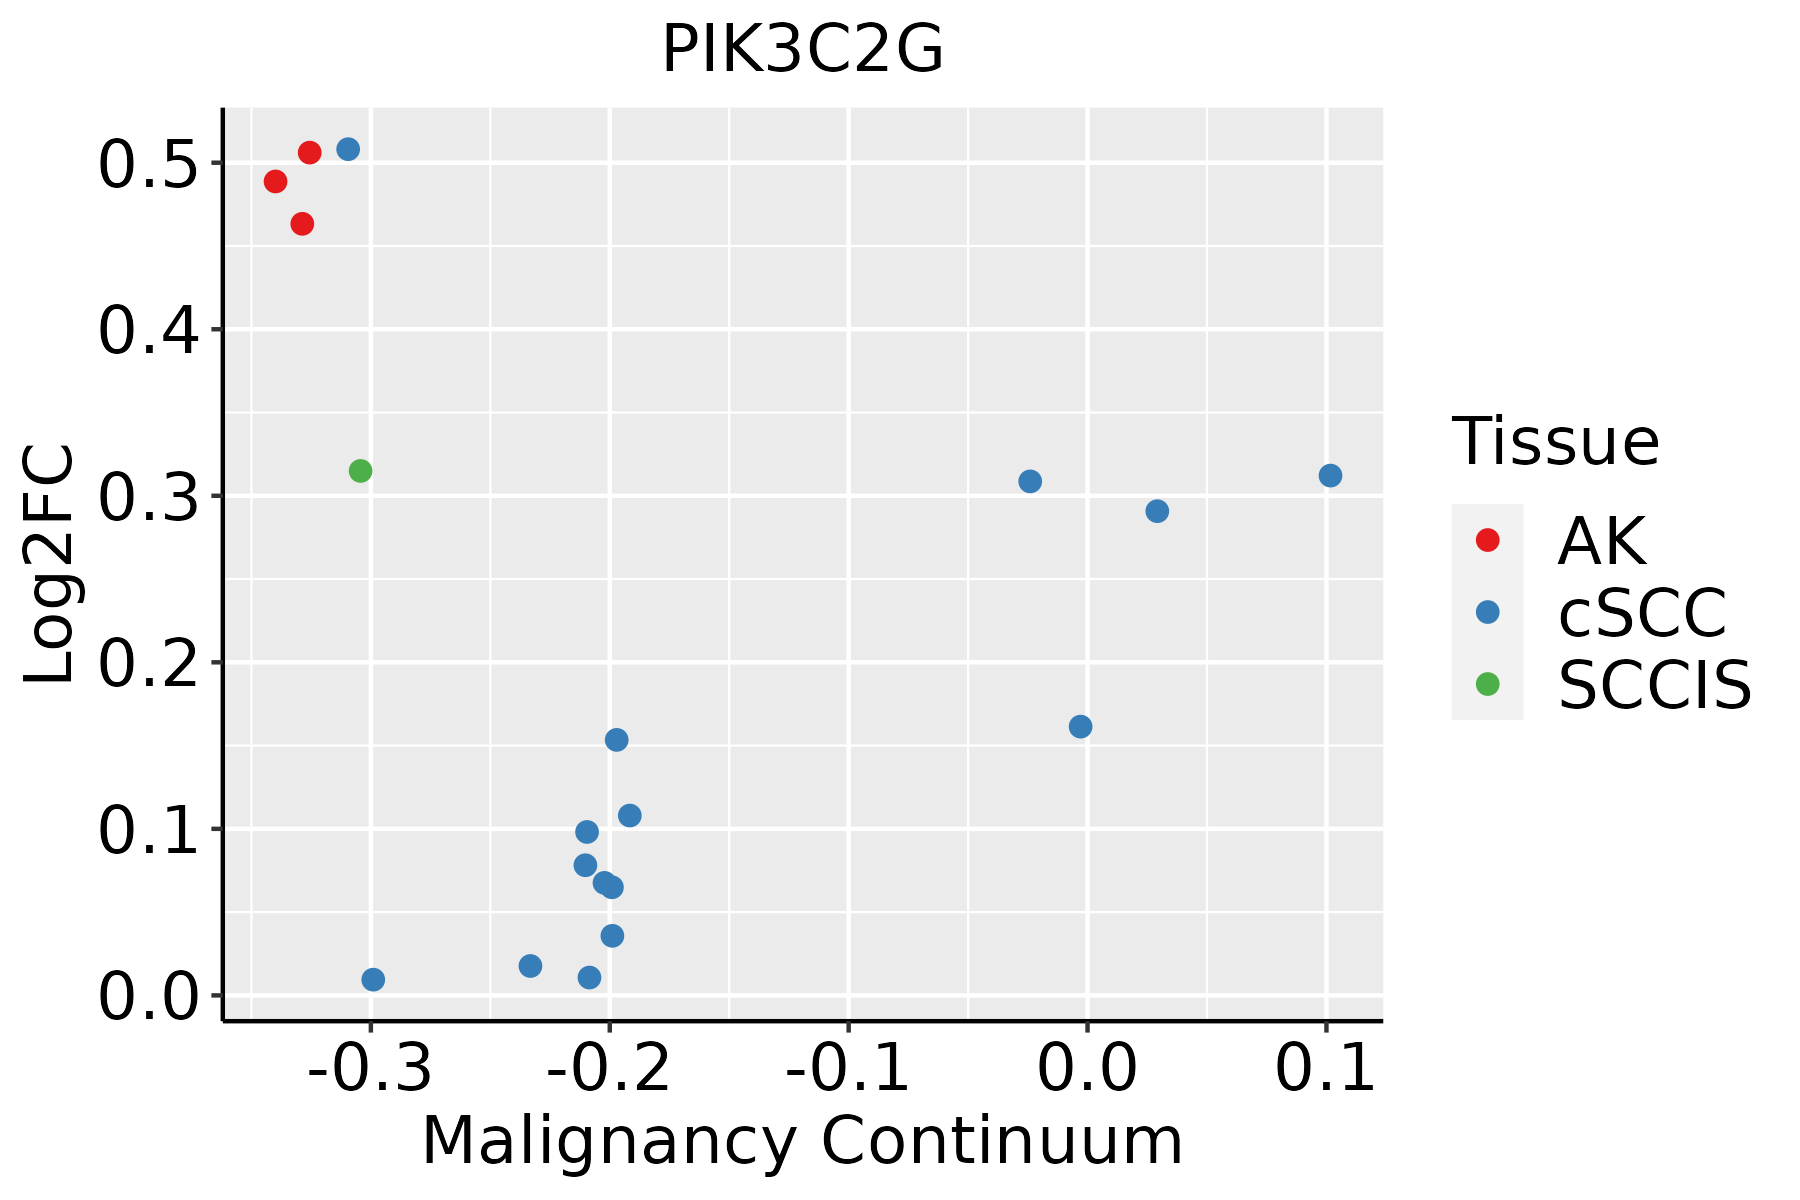 | AK: Actinic keratosis |
| cSCC: Cutaneous squamous cell carcinoma | ||
| SCCIS:squamous cell carcinoma in situ |
| ∗log2FC in expression of this searched gene in stem-like cells from each diseased tissue sample relative to stem-like cells in normal samples in each tissue plotted against the malignancy continuum. Samples are colored based on if they are from different disease stage. |
Top |
Malignant transformation related pathway analysis |
| Find out the enriched GO biological processes and KEGG pathways involved in transition from healthy to precancer to cancer |
| Tissue | Disease Stage | Enriched GO biological Processes |
| Colorectum | AD |  |
| Colorectum | SER |  |
| Colorectum | MSS |  |
| Colorectum | MSI-H |  |
| Colorectum | FAP |  |
| ∗Top 15 enriched GO BP terms are showed in the bar plot of each disease state in each tissue. Each row represents a significant GO biological process which is colored according to the -log10(p.adjust). |
| Page: 1 2 3 4 5 6 7 8 9 |
| GO ID | Tissue | Disease Stage | Description | Gene Ratio | Bg Ratio | pvalue | p.adjust | Count |
| GO:001603216 | Endometrium | AEH | viral process | 110/2100 | 415/18723 | 1.99e-18 | 1.09e-15 | 110 |
| GO:001905816 | Endometrium | AEH | viral life cycle | 86/2100 | 317/18723 | 2.53e-15 | 7.58e-13 | 86 |
| GO:001907916 | Endometrium | AEH | viral genome replication | 43/2100 | 131/18723 | 3.22e-11 | 4.60e-09 | 43 |
| GO:00396942 | Endometrium | AEH | viral RNA genome replication | 12/2100 | 35/18723 | 2.69e-04 | 3.12e-03 | 12 |
| GO:0016032111 | Esophagus | ESCC | viral process | 301/8552 | 415/18723 | 3.34e-29 | 1.32e-26 | 301 |
| GO:0019058111 | Esophagus | ESCC | viral life cycle | 226/8552 | 317/18723 | 1.17e-20 | 1.76e-18 | 226 |
| GO:0019079111 | Esophagus | ESCC | viral genome replication | 102/8552 | 131/18723 | 4.31e-14 | 2.19e-12 | 102 |
| GO:00086544 | Esophagus | ESCC | phospholipid biosynthetic process | 162/8552 | 253/18723 | 2.59e-09 | 5.73e-08 | 162 |
| GO:00464744 | Esophagus | ESCC | glycerophospholipid biosynthetic process | 135/8552 | 211/18723 | 5.75e-08 | 1.02e-06 | 135 |
| GO:00450175 | Esophagus | ESCC | glycerolipid biosynthetic process | 154/8552 | 252/18723 | 5.20e-07 | 6.96e-06 | 154 |
| GO:00066446 | Esophagus | ESCC | phospholipid metabolic process | 218/8552 | 383/18723 | 5.37e-06 | 5.59e-05 | 218 |
| GO:00066505 | Esophagus | ESCC | glycerophospholipid metabolic process | 174/8552 | 306/18723 | 4.92e-05 | 3.85e-04 | 174 |
| GO:003969411 | Esophagus | ESCC | viral RNA genome replication | 27/8552 | 35/18723 | 1.48e-04 | 9.88e-04 | 27 |
| GO:00464864 | Esophagus | ESCC | glycerolipid metabolic process | 211/8552 | 392/18723 | 6.51e-04 | 3.46e-03 | 211 |
| GO:00066611 | Esophagus | ESCC | phosphatidylinositol biosynthetic process | 73/8552 | 131/18723 | 1.31e-02 | 4.28e-02 | 73 |
| GO:00160327 | Liver | NAFLD | viral process | 80/1882 | 415/18723 | 7.71e-09 | 1.07e-06 | 80 |
| GO:00190587 | Liver | NAFLD | viral life cycle | 57/1882 | 317/18723 | 1.00e-05 | 3.18e-04 | 57 |
| GO:00464863 | Liver | NAFLD | glycerolipid metabolic process | 66/1882 | 392/18723 | 1.94e-05 | 5.52e-04 | 66 |
| GO:00450174 | Liver | NAFLD | glycerolipid biosynthetic process | 43/1882 | 252/18723 | 3.83e-04 | 5.73e-03 | 43 |
| GO:00190797 | Liver | NAFLD | viral genome replication | 26/1882 | 131/18723 | 5.40e-04 | 7.38e-03 | 26 |
| Page: 1 2 3 |
| Pathway ID | Tissue | Disease Stage | Description | Gene Ratio | Bg Ratio | pvalue | p.adjust | qvalue | Count |
| hsa0513226 | Endometrium | AEH | Salmonella infection | 71/1197 | 249/8465 | 1.69e-09 | 3.44e-08 | 2.52e-08 | 71 |
| hsa05132112 | Endometrium | AEH | Salmonella infection | 71/1197 | 249/8465 | 1.69e-09 | 3.44e-08 | 2.52e-08 | 71 |
| hsa05132211 | Esophagus | ESCC | Salmonella infection | 191/4205 | 249/8465 | 6.51e-19 | 5.45e-17 | 2.79e-17 | 191 |
| hsa05132310 | Esophagus | ESCC | Salmonella infection | 191/4205 | 249/8465 | 6.51e-19 | 5.45e-17 | 2.79e-17 | 191 |
| hsa0513214 | Liver | NAFLD | Salmonella infection | 55/1043 | 249/8465 | 8.48e-06 | 3.09e-04 | 2.49e-04 | 55 |
| hsa0513215 | Liver | NAFLD | Salmonella infection | 55/1043 | 249/8465 | 8.48e-06 | 3.09e-04 | 2.49e-04 | 55 |
| hsa0513222 | Liver | Cirrhotic | Salmonella infection | 121/2530 | 249/8465 | 2.47e-10 | 5.13e-09 | 3.16e-09 | 121 |
| hsa0513232 | Liver | Cirrhotic | Salmonella infection | 121/2530 | 249/8465 | 2.47e-10 | 5.13e-09 | 3.16e-09 | 121 |
| hsa0513242 | Liver | HCC | Salmonella infection | 178/4020 | 249/8465 | 5.90e-15 | 1.98e-13 | 1.10e-13 | 178 |
| hsa0513252 | Liver | HCC | Salmonella infection | 178/4020 | 249/8465 | 5.90e-15 | 1.98e-13 | 1.10e-13 | 178 |
| hsa0513228 | Prostate | BPH | Salmonella infection | 99/1718 | 249/8465 | 7.26e-13 | 1.50e-11 | 9.27e-12 | 99 |
| hsa05132113 | Prostate | BPH | Salmonella infection | 99/1718 | 249/8465 | 7.26e-13 | 1.50e-11 | 9.27e-12 | 99 |
| hsa0513212 | Stomach | GC | Salmonella infection | 42/708 | 249/8465 | 7.57e-06 | 1.05e-04 | 7.41e-05 | 42 |
| hsa0513213 | Stomach | GC | Salmonella infection | 42/708 | 249/8465 | 7.57e-06 | 1.05e-04 | 7.41e-05 | 42 |
| hsa0513221 | Stomach | CAG with IM | Salmonella infection | 42/640 | 249/8465 | 5.52e-07 | 9.75e-06 | 6.84e-06 | 42 |
| hsa0513231 | Stomach | CAG with IM | Salmonella infection | 42/640 | 249/8465 | 5.52e-07 | 9.75e-06 | 6.84e-06 | 42 |
| hsa0513241 | Stomach | CSG | Salmonella infection | 42/633 | 249/8465 | 4.10e-07 | 6.82e-06 | 4.91e-06 | 42 |
| hsa0513251 | Stomach | CSG | Salmonella infection | 42/633 | 249/8465 | 4.10e-07 | 6.82e-06 | 4.91e-06 | 42 |
| Page: 1 |
Top |
Cell-cell communication analysis |
| Identification of potential cell-cell interactions between two cell types and their ligand-receptor pairs for different disease states |
| Ligand | Receptor | LRpair | Pathway | Tissue | Disease Stage |
| Page: 1 |
Top |
Single-cell gene regulatory network inference analysis |
| Find out the significant the regulons (TFs) and the target genes of each regulon across cell types for different disease states |
| TF | Cell Type | Tissue | Disease Stage | Target Gene | RSS | Regulon Activity |
| ∗The dot plots of a searched regulon are shown for all cell subpopulations in each disease state of each tissue based on the regulon specific score inferred using pySCENIC and by calculating the average expression. |
| Page: 1 |
Top |
Somatic mutation of malignant transformation related genes |
| Annotation of somatic variants for genes involved in malignant transformation |
| Hugo Symbol | Variant Class | Variant Classification | dbSNP RS | HGVSc | HGVSp | HGVSp Short | SWISSPROT | BIOTYPE | SIFT | PolyPhen | Tumor Sample Barcode | Tissue | Histology | Sex | Age | Stage | Therapy Types | Drugs | Outcome |
| PIK3C2G | SNV | Missense_Mutation | c.2750T>A | p.Leu917His | p.L917H | protein_coding | deleterious(0) | probably_damaging(1) | TCGA-A7-A0CE-01 | Breast | breast invasive carcinoma | Female | <65 | I/II | Chemotherapy | adriamycin | SD | ||
| PIK3C2G | SNV | Missense_Mutation | novel | c.937N>A | p.Asp313Asn | p.D313N | protein_coding | tolerated(0.15) | probably_damaging(0.958) | TCGA-AN-A046-01 | Breast | breast invasive carcinoma | Female | >=65 | I/II | Unknown | Unknown | SD | |
| PIK3C2G | SNV | Missense_Mutation | c.1510G>C | p.Asp504His | p.D504H | protein_coding | deleterious(0) | probably_damaging(0.994) | TCGA-AN-A0XW-01 | Breast | breast invasive carcinoma | Female | <65 | III/IV | Unknown | Unknown | SD | ||
| PIK3C2G | SNV | Missense_Mutation | c.2326N>G | p.Gln776Glu | p.Q776E | protein_coding | deleterious(0.01) | possibly_damaging(0.623) | TCGA-AR-A0TX-01 | Breast | breast invasive carcinoma | Female | <65 | I/II | Unknown | Unknown | SD | ||
| PIK3C2G | SNV | Missense_Mutation | c.3231N>G | p.Asn1077Lys | p.N1077K | protein_coding | deleterious(0) | probably_damaging(0.983) | TCGA-B6-A0RE-01 | Breast | breast invasive carcinoma | Female | <65 | I/II | Unknown | Unknown | SD | ||
| PIK3C2G | SNV | Missense_Mutation | rs267603405 | c.4303N>A | p.Glu1435Lys | p.E1435K | protein_coding | deleterious(0) | probably_damaging(0.998) | TCGA-BH-A0B6-01 | Breast | breast invasive carcinoma | Female | <65 | I/II | Unknown | Unknown | SD | |
| PIK3C2G | SNV | Missense_Mutation | c.808N>C | p.Lys270Gln | p.K270Q | protein_coding | tolerated(0.29) | possibly_damaging(0.624) | TCGA-E2-A1IK-01 | Breast | breast invasive carcinoma | Female | >=65 | I/II | Hormone Therapy | arimidex | SD | ||
| PIK3C2G | SNV | Missense_Mutation | c.1434G>C | p.Leu478Phe | p.L478F | protein_coding | tolerated(0.76) | benign(0.006) | TCGA-E2-A1LG-01 | Breast | breast invasive carcinoma | Female | <65 | I/II | Chemotherapy | doxorubicin | SD | ||
| PIK3C2G | SNV | Missense_Mutation | novel | c.917N>A | p.Cys306Tyr | p.C306Y | protein_coding | tolerated(1) | benign(0) | TCGA-2W-A8YY-01 | Cervix | cervical & endocervical cancer | Female | <65 | I/II | Chemotherapy | cisplatin | CR | |
| PIK3C2G | SNV | Missense_Mutation | novel | c.2243N>T | p.Ser748Leu | p.S748L | protein_coding | tolerated(0.06) | benign(0.231) | TCGA-C5-A2LZ-01 | Cervix | cervical & endocervical cancer | Female | >=65 | III/IV | Unknown | Unknown | PD |
| Page: 1 2 3 4 5 6 7 8 9 10 11 12 13 14 15 16 17 |
Top |
Related drugs of malignant transformation related genes |
| Identification of chemicals and drugs interact with genes involved in malignant transfromation |
| (DGIdb 4.0) |
| Entrez ID | Symbol | Category | Interaction Types | Drug Claim Name | Drug Name | PMIDs |
| 5288 | PIK3C2G | PHOSPHATIDYLINOSITOL 3 KINASE, KINASE, DRUGGABLE GENOME, ENZYME, CLINICALLY ACTIONABLE | inhibitor | GDC-0980 | APITOLISIB | |
| 5288 | PIK3C2G | PHOSPHATIDYLINOSITOL 3 KINASE, KINASE, DRUGGABLE GENOME, ENZYME, CLINICALLY ACTIONABLE | inhibitor | BGJ398 | INFIGRATINIB | |
| 5288 | PIK3C2G | PHOSPHATIDYLINOSITOL 3 KINASE, KINASE, DRUGGABLE GENOME, ENZYME, CLINICALLY ACTIONABLE | inhibitor | XL147 | PILARALISIB | |
| 5288 | PIK3C2G | PHOSPHATIDYLINOSITOL 3 KINASE, KINASE, DRUGGABLE GENOME, ENZYME, CLINICALLY ACTIONABLE | inhibitor | PF-4691502 | PF-04691502 | |
| 5288 | PIK3C2G | PHOSPHATIDYLINOSITOL 3 KINASE, KINASE, DRUGGABLE GENOME, ENZYME, CLINICALLY ACTIONABLE | inhibitor | BEZ235 | DACTOLISIB | |
| 5288 | PIK3C2G | PHOSPHATIDYLINOSITOL 3 KINASE, KINASE, DRUGGABLE GENOME, ENZYME, CLINICALLY ACTIONABLE | inhibitor | 252827451 | SAR-260301 | |
| 5288 | PIK3C2G | PHOSPHATIDYLINOSITOL 3 KINASE, KINASE, DRUGGABLE GENOME, ENZYME, CLINICALLY ACTIONABLE | inhibitor | PX-866 | SONOLISIB | |
| 5288 | PIK3C2G | PHOSPHATIDYLINOSITOL 3 KINASE, KINASE, DRUGGABLE GENOME, ENZYME, CLINICALLY ACTIONABLE | inhibitor | PI-103 | PI-103 | |
| 5288 | PIK3C2G | PHOSPHATIDYLINOSITOL 3 KINASE, KINASE, DRUGGABLE GENOME, ENZYME, CLINICALLY ACTIONABLE | inhibitor | GSK2636771 | GSK-2636771 | |
| 5288 | PIK3C2G | PHOSPHATIDYLINOSITOL 3 KINASE, KINASE, DRUGGABLE GENOME, ENZYME, CLINICALLY ACTIONABLE | inhibitor | BKM120 | BUPARLISIB |
| Page: 1 2 |

Copyright 2023-Present -The University of Texas Health Science Center at Houston |