
|
|||||
|
 | |
| |
| |
| |
| |
| |
|
Gene: PIK3AP1 |
Gene summary for PIK3AP1 |
| Gene information | Species | Human | Gene symbol | PIK3AP1 | Gene ID | 118788 |
| Gene name | phosphoinositide-3-kinase adaptor protein 1 | |
| Gene Alias | BCAP | |
| Cytomap | 10q24.1 | |
| Gene Type | protein-coding | GO ID | GO:0002221 | UniProtAcc | Q6ZUJ8 |
Top |
Malignant transformation analysis |
| Identification of the aberrant gene expression in precancerous and cancerous lesions by comparing the gene expression of stem-like cells in diseased tissues with normal stem cells |
| Entrez ID | Symbol | Replicates | Species | Organ | Tissue | Adj P-value | Log2FC | Malignancy |
| 118788 | PIK3AP1 | S43 | Human | Liver | Cirrhotic | 3.86e-02 | -1.26e-01 | -0.0187 |
| 118788 | PIK3AP1 | HCC1_Meng | Human | Liver | HCC | 1.36e-26 | -2.10e-01 | 0.0246 |
| 118788 | PIK3AP1 | HCC2_Meng | Human | Liver | HCC | 7.52e-09 | -2.44e-01 | 0.0107 |
| 118788 | PIK3AP1 | cirrhotic2 | Human | Liver | Cirrhotic | 1.50e-07 | 1.05e-01 | 0.0201 |
| 118788 | PIK3AP1 | cirrhotic3 | Human | Liver | Cirrhotic | 3.68e-04 | -1.05e-01 | 0.0215 |
| 118788 | PIK3AP1 | HCC2 | Human | Liver | HCC | 3.96e-10 | 3.93e+00 | 0.5341 |
| 118788 | PIK3AP1 | Pt13.b | Human | Liver | HCC | 1.74e-05 | -1.46e-01 | 0.0251 |
| 118788 | PIK3AP1 | S014 | Human | Liver | HCC | 5.00e-06 | -3.10e-01 | 0.2254 |
| 118788 | PIK3AP1 | S015 | Human | Liver | HCC | 1.18e-03 | -3.10e-01 | 0.2375 |
| 118788 | PIK3AP1 | S016 | Human | Liver | HCC | 4.77e-08 | -3.10e-01 | 0.2243 |
| 118788 | PIK3AP1 | S028 | Human | Liver | HCC | 3.37e-04 | 5.44e-01 | 0.2503 |
| Page: 1 |
| Tissue | Expression Dynamics | Abbreviation |
| Liver | 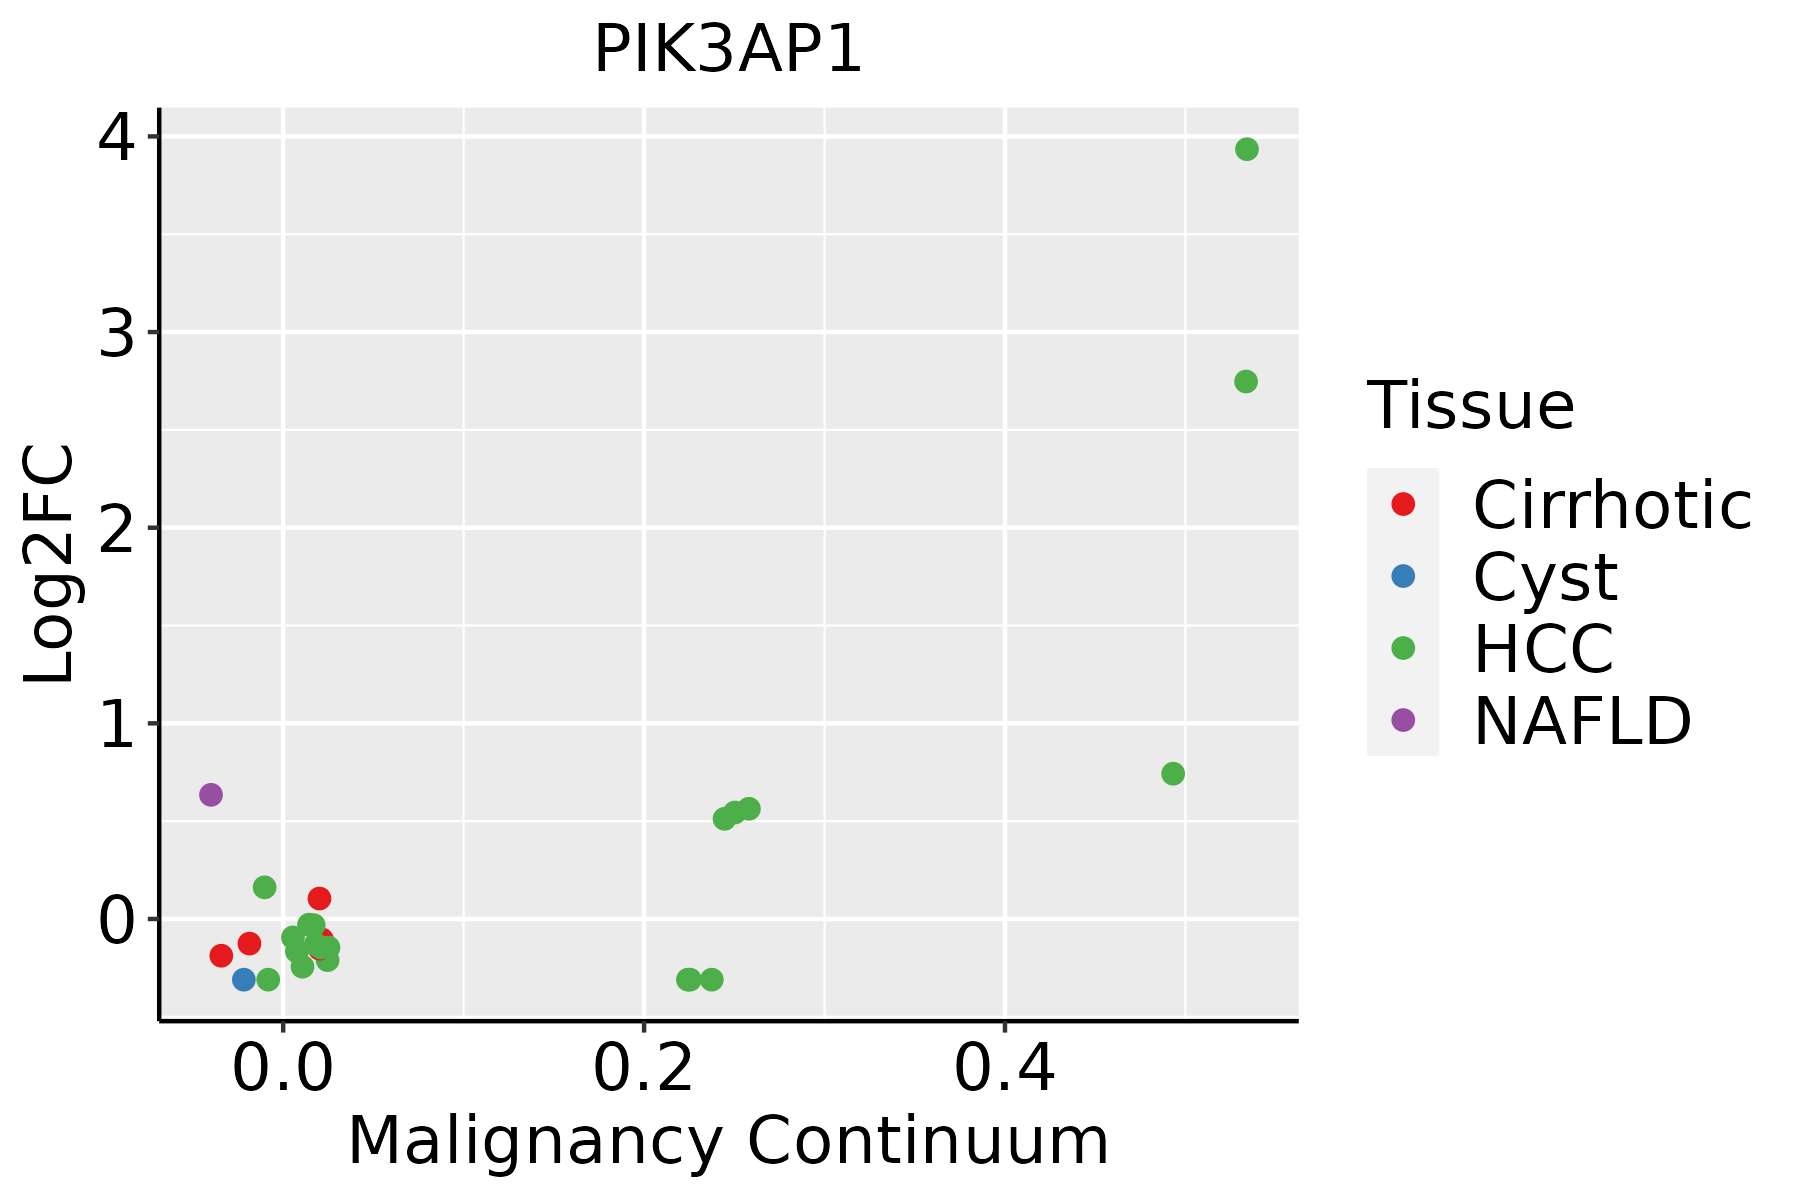 | HCC: Hepatocellular carcinoma |
| NAFLD: Non-alcoholic fatty liver disease |
| ∗log2FC in expression of this searched gene in stem-like cells from each diseased tissue sample relative to stem-like cells in normal samples in each tissue plotted against the malignancy continuum. Samples are colored based on if they are from different disease stage. |
Top |
Malignant transformation related pathway analysis |
| Find out the enriched GO biological processes and KEGG pathways involved in transition from healthy to precancer to cancer |
| Tissue | Disease Stage | Enriched GO biological Processes |
| Colorectum | AD |  |
| Colorectum | SER |  |
| Colorectum | MSS |  |
| Colorectum | MSI-H |  |
| Colorectum | FAP |  |
| ∗Top 15 enriched GO BP terms are showed in the bar plot of each disease state in each tissue. Each row represents a significant GO biological process which is colored according to the -log10(p.adjust). |
| Page: 1 2 3 4 5 6 7 8 9 |
| GO ID | Tissue | Disease Stage | Description | Gene Ratio | Bg Ratio | pvalue | p.adjust | Count |
| GO:00022211 | Liver | HCC | pattern recognition receptor signaling pathway | 107/7958 | 172/18723 | 1.37e-07 | 2.58e-06 | 107 |
| GO:0002224 | Liver | HCC | toll-like receptor signaling pathway | 67/7958 | 121/18723 | 2.87e-03 | 1.34e-02 | 67 |
| Page: 1 |
| Pathway ID | Tissue | Disease Stage | Description | Gene Ratio | Bg Ratio | pvalue | p.adjust | qvalue | Count |
| Page: 1 |
Top |
Cell-cell communication analysis |
| Identification of potential cell-cell interactions between two cell types and their ligand-receptor pairs for different disease states |
| Ligand | Receptor | LRpair | Pathway | Tissue | Disease Stage |
| Page: 1 |
Top |
Single-cell gene regulatory network inference analysis |
| Find out the significant the regulons (TFs) and the target genes of each regulon across cell types for different disease states |
| TF | Cell Type | Tissue | Disease Stage | Target Gene | RSS | Regulon Activity |
| ∗The dot plots of a searched regulon are shown for all cell subpopulations in each disease state of each tissue based on the regulon specific score inferred using pySCENIC and by calculating the average expression. |
| Page: 1 |
Top |
Somatic mutation of malignant transformation related genes |
| Annotation of somatic variants for genes involved in malignant transformation |
| Hugo Symbol | Variant Class | Variant Classification | dbSNP RS | HGVSc | HGVSp | HGVSp Short | SWISSPROT | BIOTYPE | SIFT | PolyPhen | Tumor Sample Barcode | Tissue | Histology | Sex | Age | Stage | Therapy Types | Drugs | Outcome |
| PIK3AP1 | SNV | Missense_Mutation | c.308N>A | p.Cys103Tyr | p.C103Y | Q6ZUJ8 | protein_coding | deleterious(0) | probably_damaging(0.998) | TCGA-A8-A09Z-01 | Breast | breast invasive carcinoma | Female | >=65 | I/II | Unknown | Unknown | SD | |
| PIK3AP1 | SNV | Missense_Mutation | rs199816410 | c.2027N>T | p.Thr676Met | p.T676M | Q6ZUJ8 | protein_coding | deleterious(0) | probably_damaging(0.998) | TCGA-OL-A97C-01 | Breast | breast invasive carcinoma | Female | >=65 | I/II | Unknown | Unknown | PD |
| PIK3AP1 | insertion | In_Frame_Ins | novel | c.1562_1563insTGGTCTTGAACT | p.Ala521_Phe522insGlyLeuGluLeu | p.A521_F522insGLEL | Q6ZUJ8 | protein_coding | TCGA-AN-A0FX-01 | Breast | breast invasive carcinoma | Female | <65 | I/II | Unknown | Unknown | SD | ||
| PIK3AP1 | insertion | In_Frame_Ins | novel | c.1560_1561insACAGGGTCTTGCTGTGTTGCCCAG | p.Glu520_Ala521insThrGlySerCysCysValAlaGln | p.E520_A521insTGSCCVAQ | Q6ZUJ8 | protein_coding | TCGA-AN-A0FX-01 | Breast | breast invasive carcinoma | Female | <65 | I/II | Unknown | Unknown | SD | ||
| PIK3AP1 | SNV | Missense_Mutation | novel | c.2221G>A | p.Gly741Arg | p.G741R | Q6ZUJ8 | protein_coding | deleterious(0) | probably_damaging(1) | TCGA-2W-A8YY-01 | Cervix | cervical & endocervical cancer | Female | <65 | I/II | Chemotherapy | cisplatin | CR |
| PIK3AP1 | SNV | Missense_Mutation | novel | c.1949T>G | p.Leu650Arg | p.L650R | Q6ZUJ8 | protein_coding | deleterious(0) | probably_damaging(0.999) | TCGA-2W-A8YY-01 | Cervix | cervical & endocervical cancer | Female | <65 | I/II | Chemotherapy | cisplatin | CR |
| PIK3AP1 | SNV | Missense_Mutation | rs778106731 | c.1880T>C | p.Leu627Pro | p.L627P | Q6ZUJ8 | protein_coding | deleterious(0.03) | probably_damaging(0.974) | TCGA-2W-A8YY-01 | Cervix | cervical & endocervical cancer | Female | <65 | I/II | Chemotherapy | cisplatin | CR |
| PIK3AP1 | SNV | Missense_Mutation | novel | c.160N>G | p.Ser54Ala | p.S54A | Q6ZUJ8 | protein_coding | tolerated(0.49) | benign(0.003) | TCGA-EA-A3HU-01 | Cervix | cervical & endocervical cancer | Female | <65 | I/II | Unknown | Unknown | SD |
| PIK3AP1 | SNV | Missense_Mutation | novel | c.2365N>G | p.Pro789Ala | p.P789A | Q6ZUJ8 | protein_coding | tolerated(0.69) | benign(0.01) | TCGA-HM-A4S6-01 | Cervix | cervical & endocervical cancer | Female | <65 | III/IV | Chemotherapy | cisplatin | CR |
| PIK3AP1 | SNV | Missense_Mutation | rs564621240 | c.1099G>A | p.Val367Met | p.V367M | Q6ZUJ8 | protein_coding | deleterious(0) | probably_damaging(0.999) | TCGA-JX-A5QV-01 | Cervix | cervical & endocervical cancer | Female | <65 | I/II | Unknown | Unknown | SD |
| Page: 1 2 3 4 5 6 7 8 9 10 11 |
Top |
Related drugs of malignant transformation related genes |
| Identification of chemicals and drugs interact with genes involved in malignant transfromation |
| (DGIdb 4.0) |
| Entrez ID | Symbol | Category | Interaction Types | Drug Claim Name | Drug Name | PMIDs |
| Page: 1 |

Copyright 2023-Present -The University of Texas Health Science Center at Houston |