
|
|||||
|
 | |
| |
| |
| |
| |
| |
|
Gene: PIH1D1 |
Gene summary for PIH1D1 |
| Gene information | Species | Human | Gene symbol | PIH1D1 | Gene ID | 55011 |
| Gene name | PIH1 domain containing 1 | |
| Gene Alias | DNAAF14 | |
| Cytomap | 19q13.33 | |
| Gene Type | protein-coding | GO ID | GO:0000491 | UniProtAcc | Q9NWS0 |
Top |
Malignant transformation analysis |
| Identification of the aberrant gene expression in precancerous and cancerous lesions by comparing the gene expression of stem-like cells in diseased tissues with normal stem cells |
| Entrez ID | Symbol | Replicates | Species | Organ | Tissue | Adj P-value | Log2FC | Malignancy |
| 55011 | PIH1D1 | HTA11_3410_2000001011 | Human | Colorectum | AD | 2.81e-02 | 1.63e-01 | 0.0155 |
| 55011 | PIH1D1 | HTA11_2487_2000001011 | Human | Colorectum | SER | 6.40e-09 | 4.48e-01 | -0.1808 |
| 55011 | PIH1D1 | HTA11_1938_2000001011 | Human | Colorectum | AD | 7.75e-06 | 4.80e-01 | -0.0811 |
| 55011 | PIH1D1 | HTA11_347_2000001011 | Human | Colorectum | AD | 8.39e-12 | 4.00e-01 | -0.1954 |
| 55011 | PIH1D1 | HTA11_3361_2000001011 | Human | Colorectum | AD | 6.08e-06 | 4.73e-01 | -0.1207 |
| 55011 | PIH1D1 | HTA11_83_2000001011 | Human | Colorectum | SER | 2.77e-03 | 4.23e-01 | -0.1526 |
| 55011 | PIH1D1 | HTA11_696_2000001011 | Human | Colorectum | AD | 1.57e-16 | 5.10e-01 | -0.1464 |
| 55011 | PIH1D1 | HTA11_866_2000001011 | Human | Colorectum | AD | 1.28e-06 | 2.98e-01 | -0.1001 |
| 55011 | PIH1D1 | HTA11_1391_2000001011 | Human | Colorectum | AD | 1.81e-19 | 7.36e-01 | -0.059 |
| 55011 | PIH1D1 | HTA11_2992_2000001011 | Human | Colorectum | SER | 5.19e-07 | 6.13e-01 | -0.1706 |
| 55011 | PIH1D1 | HTA11_546_2000001011 | Human | Colorectum | AD | 6.93e-07 | 5.61e-01 | -0.0842 |
| 55011 | PIH1D1 | HTA11_7862_2000001011 | Human | Colorectum | AD | 6.56e-03 | 4.18e-01 | -0.0179 |
| 55011 | PIH1D1 | HTA11_866_3004761011 | Human | Colorectum | AD | 8.22e-12 | 4.90e-01 | 0.096 |
| 55011 | PIH1D1 | HTA11_4255_2000001011 | Human | Colorectum | SER | 5.78e-04 | 4.74e-01 | 0.0446 |
| 55011 | PIH1D1 | HTA11_8622_2000001021 | Human | Colorectum | SER | 1.28e-02 | 4.45e-01 | 0.0528 |
| 55011 | PIH1D1 | HTA11_6801_2000001011 | Human | Colorectum | SER | 1.76e-02 | 3.78e-01 | 0.0171 |
| 55011 | PIH1D1 | HTA11_7696_3000711011 | Human | Colorectum | AD | 8.90e-25 | 6.13e-01 | 0.0674 |
| 55011 | PIH1D1 | HTA11_6818_2000001021 | Human | Colorectum | AD | 1.89e-12 | 5.02e-01 | 0.0588 |
| 55011 | PIH1D1 | HTA11_99999970781_79442 | Human | Colorectum | MSS | 1.54e-25 | 5.91e-01 | 0.294 |
| 55011 | PIH1D1 | HTA11_99999965062_69753 | Human | Colorectum | MSI-H | 4.51e-06 | 8.99e-01 | 0.3487 |
| Page: 1 2 3 4 5 6 7 8 |
| Tissue | Expression Dynamics | Abbreviation |
| Colorectum (GSE201348) |  | FAP: Familial adenomatous polyposis |
| CRC: Colorectal cancer | ||
| Colorectum (HTA11) |  | AD: Adenomas |
| SER: Sessile serrated lesions | ||
| MSI-H: Microsatellite-high colorectal cancer | ||
| MSS: Microsatellite stable colorectal cancer | ||
| Esophagus | 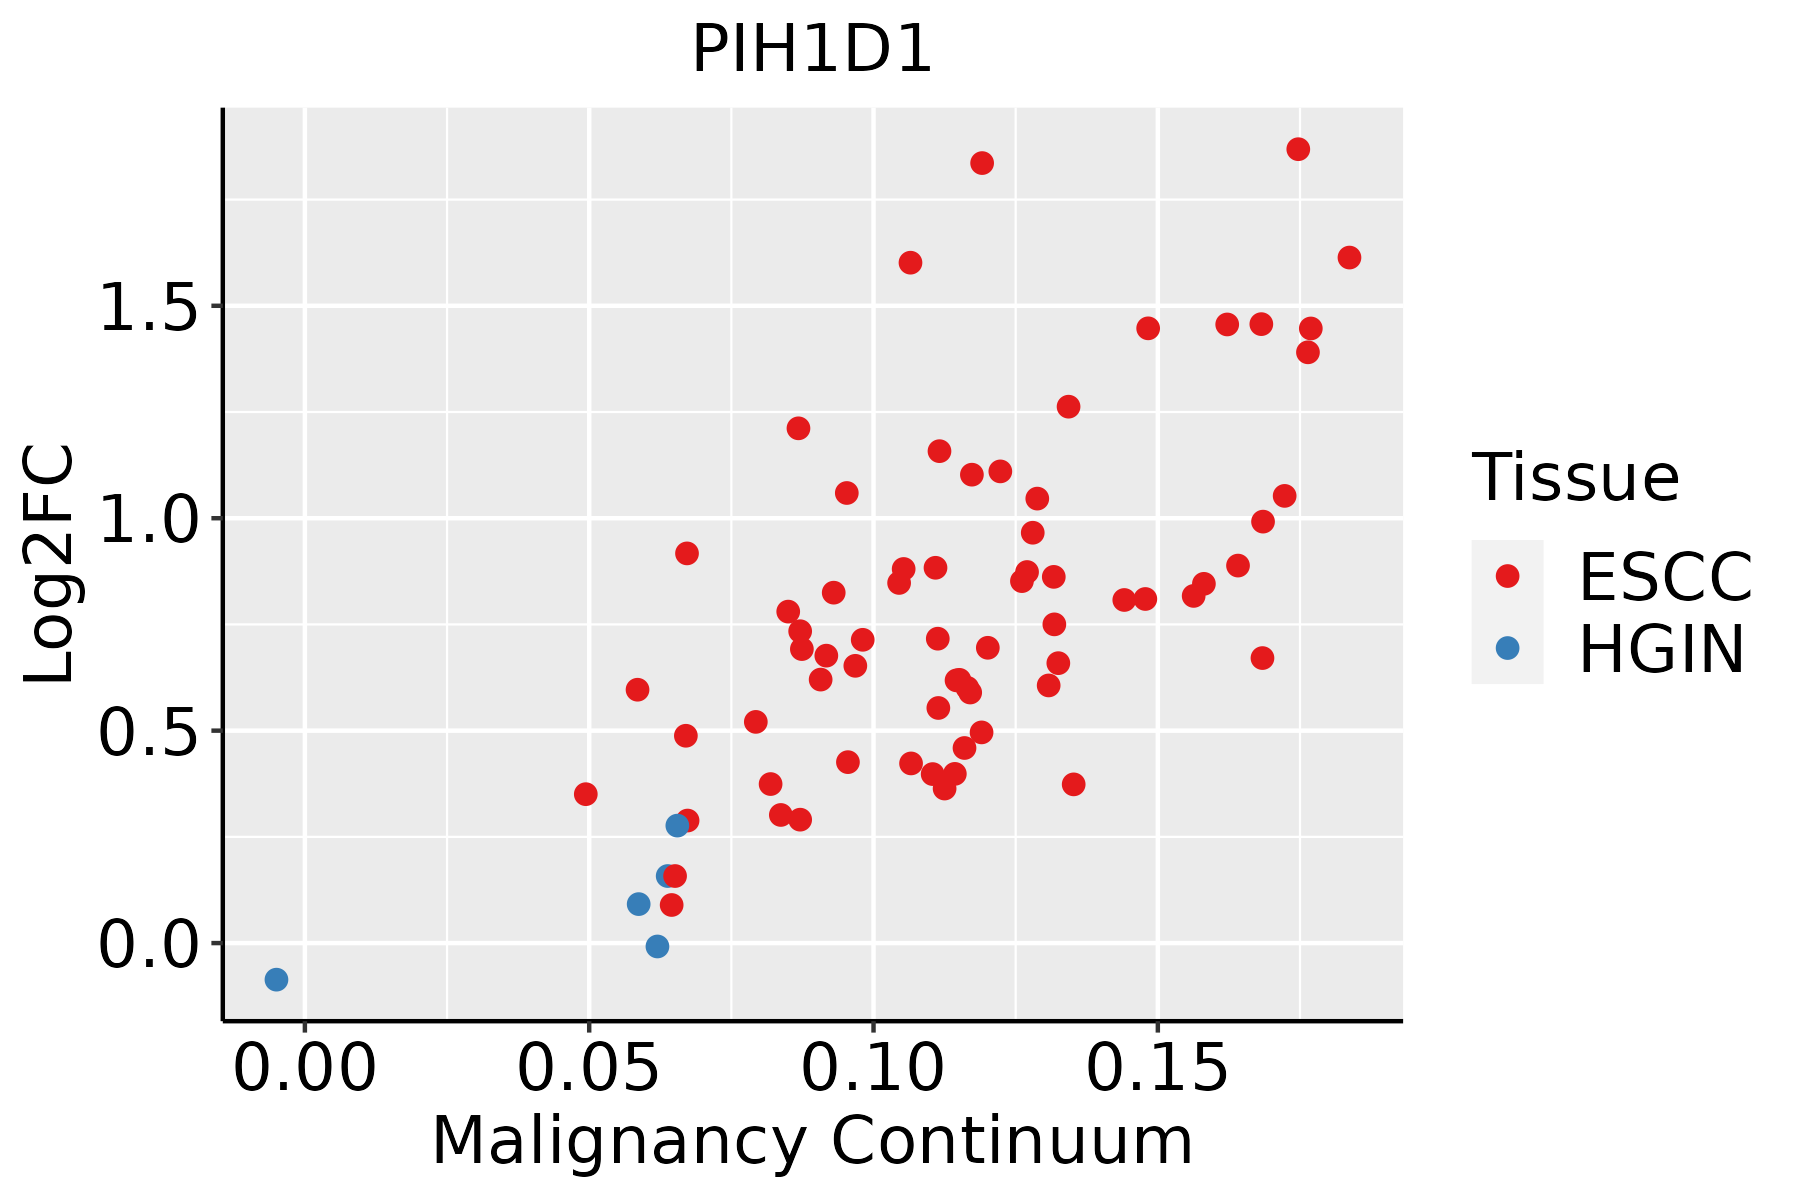 | ESCC: Esophageal squamous cell carcinoma |
| HGIN: High-grade intraepithelial neoplasias | ||
| LGIN: Low-grade intraepithelial neoplasias | ||
| Liver | 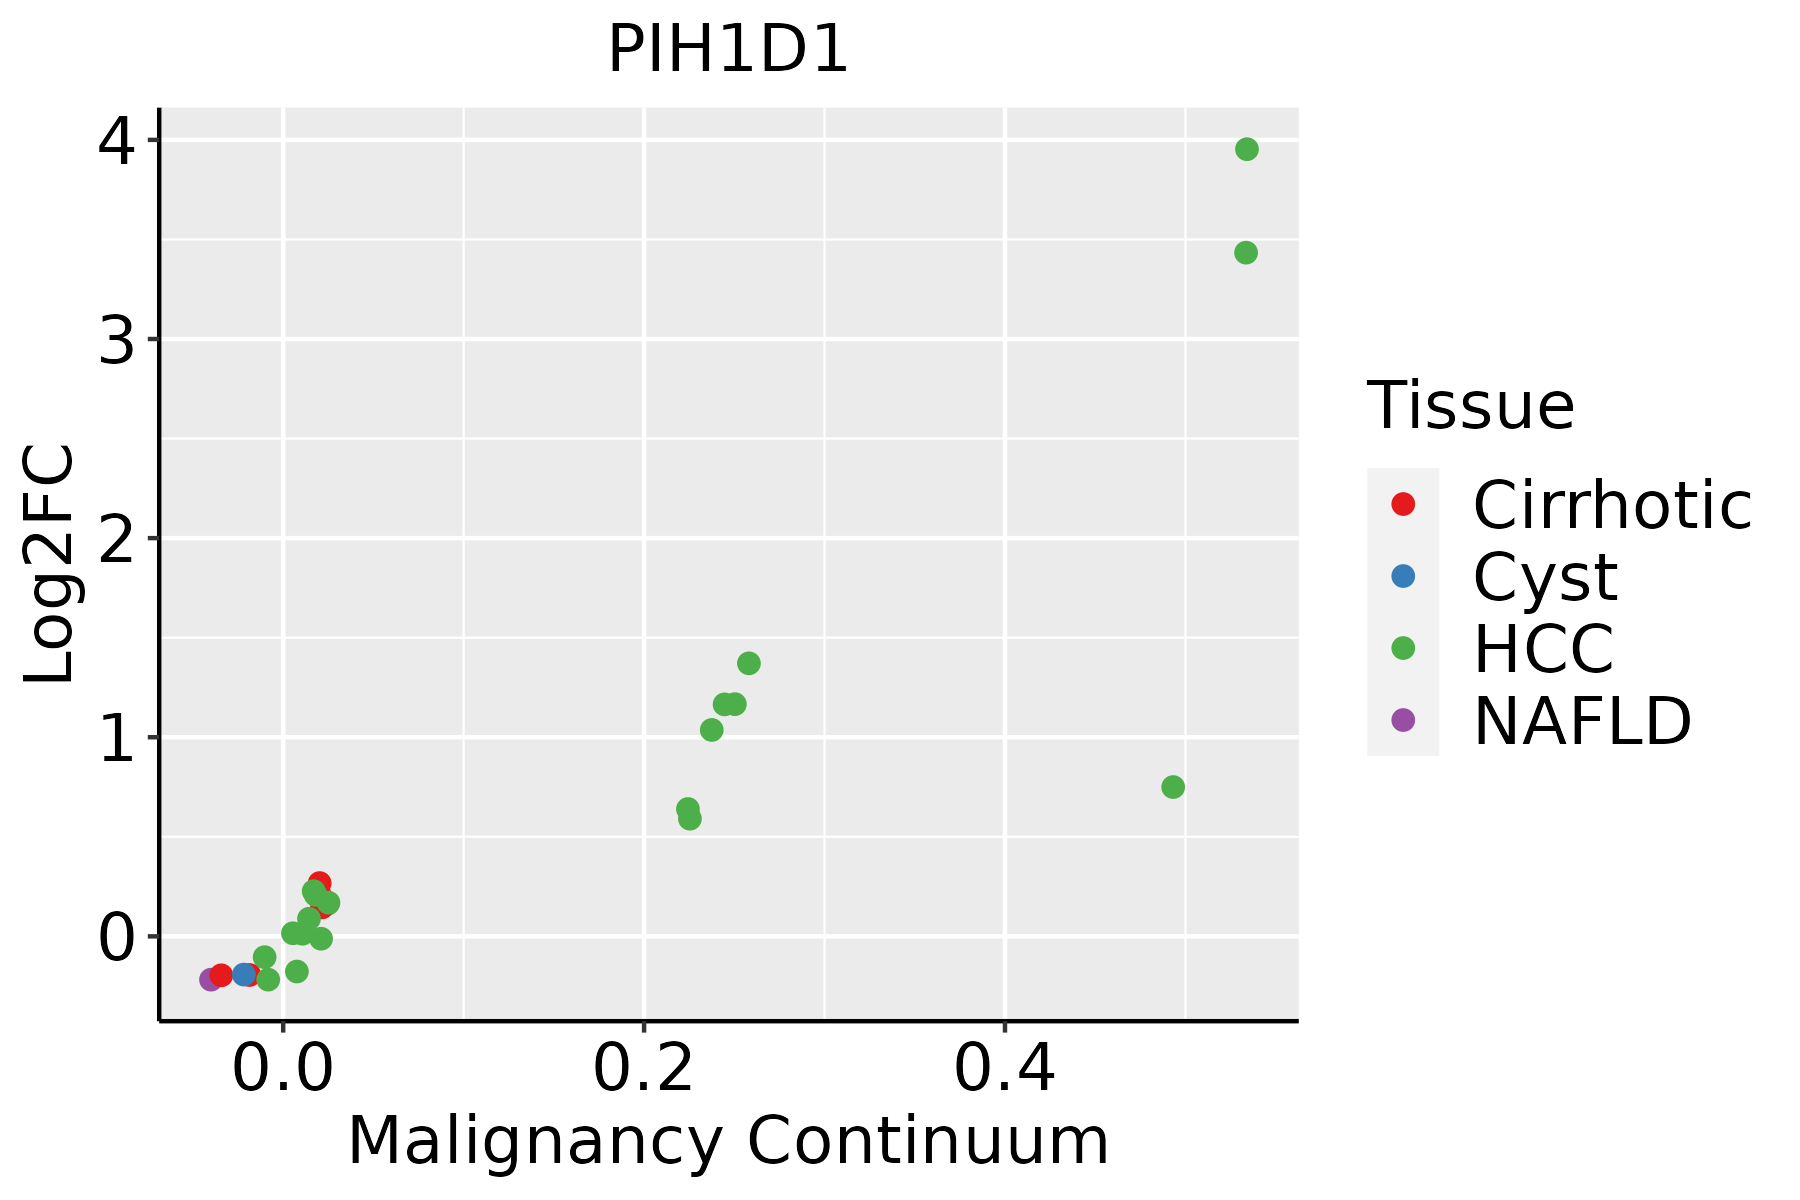 | HCC: Hepatocellular carcinoma |
| NAFLD: Non-alcoholic fatty liver disease | ||
| Oral Cavity | 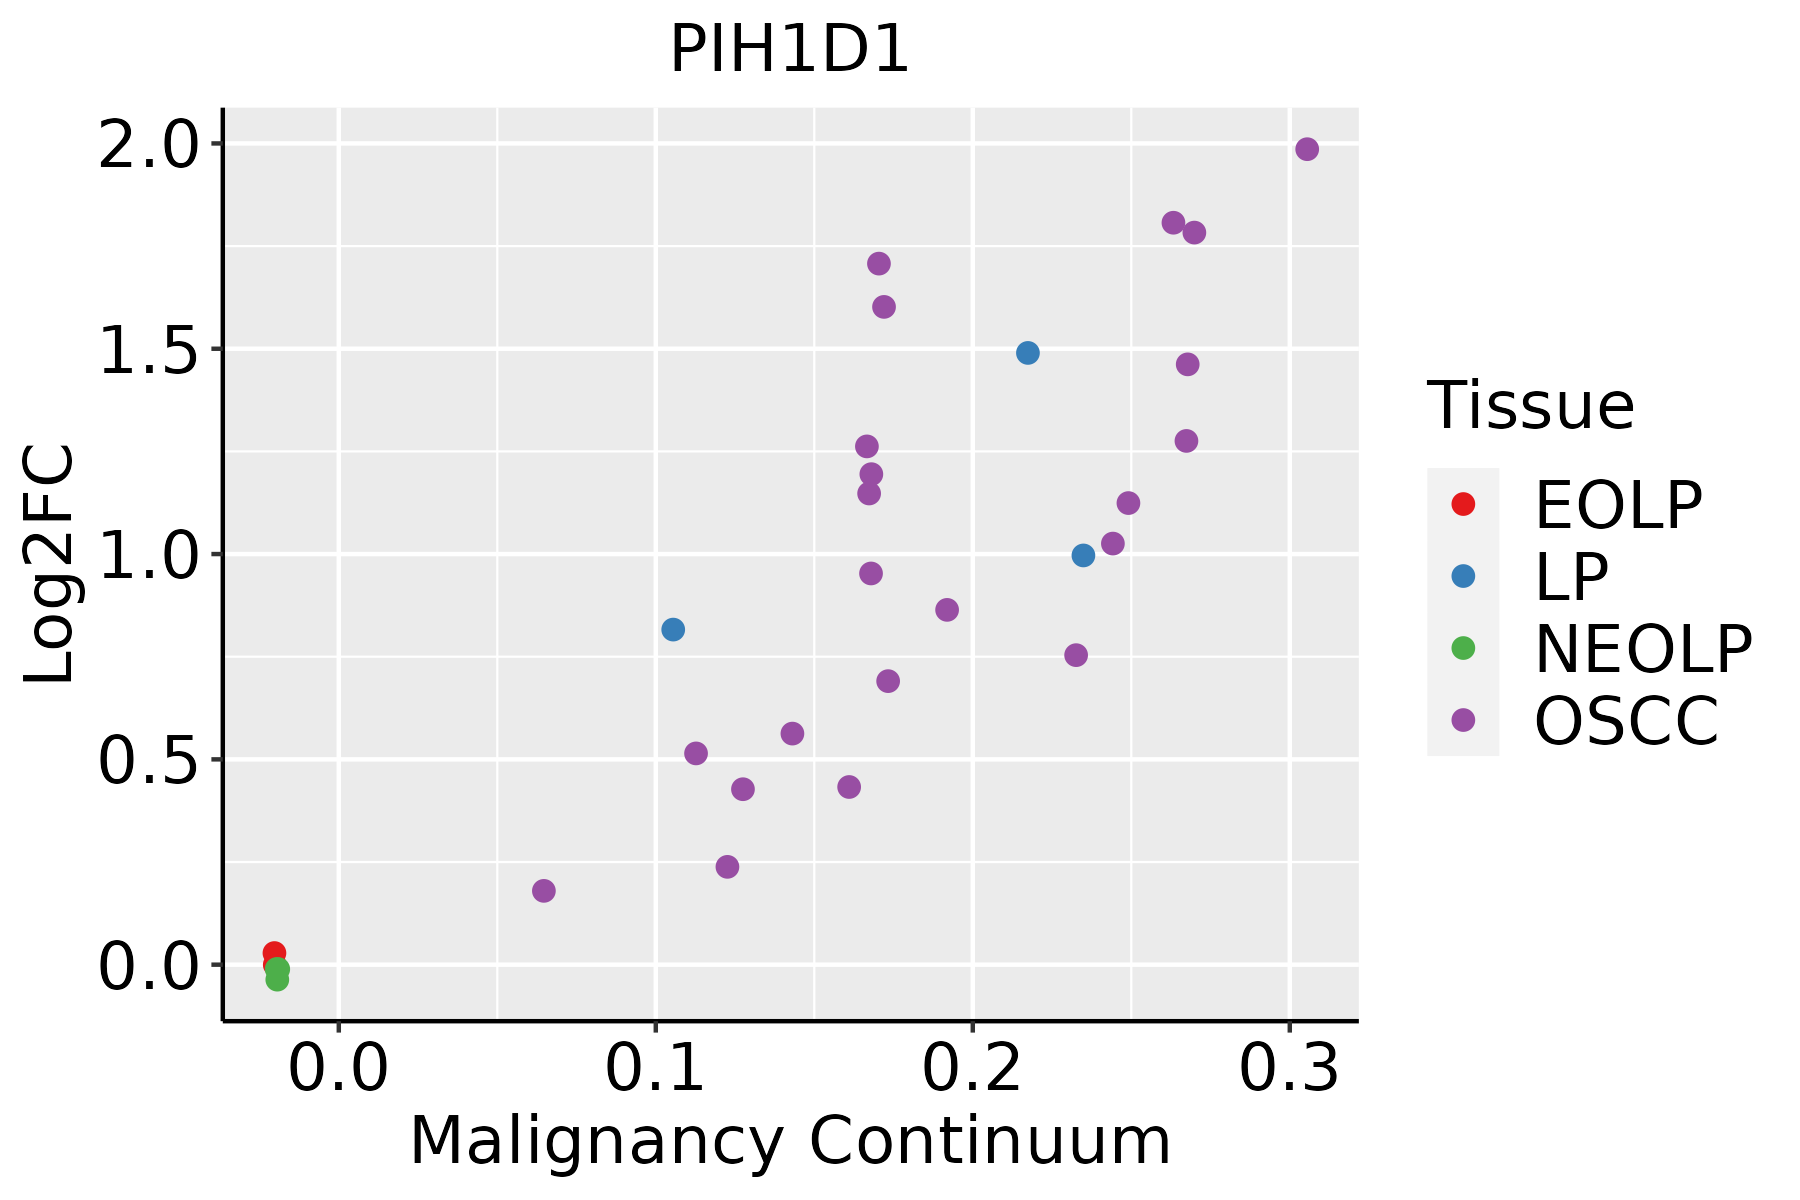 | EOLP: Erosive Oral lichen planus |
| LP: leukoplakia | ||
| NEOLP: Non-erosive oral lichen planus | ||
| OSCC: Oral squamous cell carcinoma | ||
| Skin | 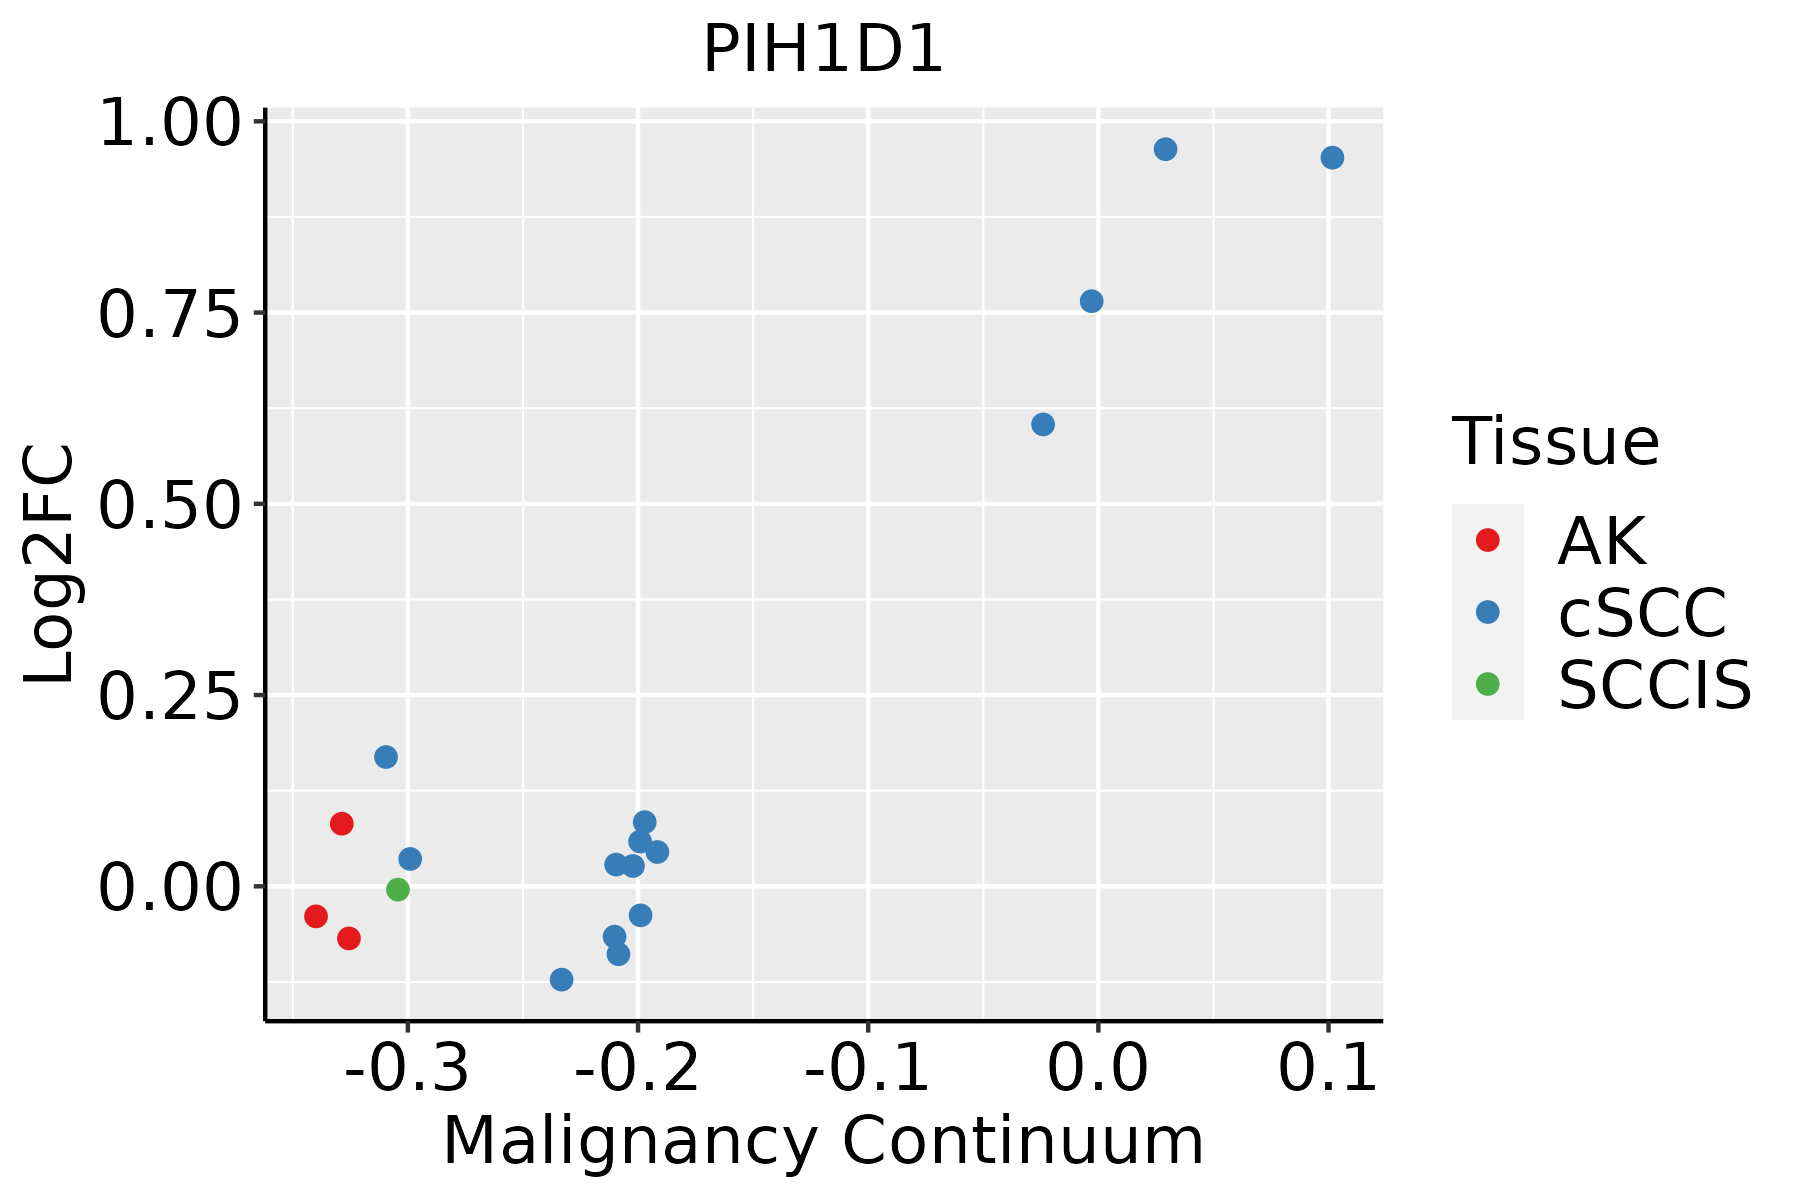 | AK: Actinic keratosis |
| cSCC: Cutaneous squamous cell carcinoma | ||
| SCCIS:squamous cell carcinoma in situ | ||
| Thyroid |  | ATC: Anaplastic thyroid cancer |
| HT: Hashimoto's thyroiditis | ||
| PTC: Papillary thyroid cancer |
| ∗log2FC in expression of this searched gene in stem-like cells from each diseased tissue sample relative to stem-like cells in normal samples in each tissue plotted against the malignancy continuum. Samples are colored based on if they are from different disease stage. |
Top |
Malignant transformation related pathway analysis |
| Find out the enriched GO biological processes and KEGG pathways involved in transition from healthy to precancer to cancer |
| Tissue | Disease Stage | Enriched GO biological Processes |
| Colorectum | AD |  |
| Colorectum | SER |  |
| Colorectum | MSS |  |
| Colorectum | MSI-H |  |
| Colorectum | FAP |  |
| ∗Top 15 enriched GO BP terms are showed in the bar plot of each disease state in each tissue. Each row represents a significant GO biological process which is colored according to the -log10(p.adjust). |
| Page: 1 2 3 4 5 6 7 8 9 |
| GO ID | Tissue | Disease Stage | Description | Gene Ratio | Bg Ratio | pvalue | p.adjust | Count |
| GO:0022618 | Colorectum | AD | ribonucleoprotein complex assembly | 92/3918 | 220/18723 | 1.49e-12 | 2.60e-10 | 92 |
| GO:0071826 | Colorectum | AD | ribonucleoprotein complex subunit organization | 94/3918 | 227/18723 | 1.70e-12 | 2.87e-10 | 94 |
| GO:0072594 | Colorectum | AD | establishment of protein localization to organelle | 148/3918 | 422/18723 | 7.95e-12 | 1.04e-09 | 148 |
| GO:0043254 | Colorectum | AD | regulation of protein-containing complex assembly | 148/3918 | 428/18723 | 2.64e-11 | 3.18e-09 | 148 |
| GO:0031334 | Colorectum | AD | positive regulation of protein-containing complex assembly | 91/3918 | 237/18723 | 4.78e-10 | 3.99e-08 | 91 |
| GO:0022613 | Colorectum | AD | ribonucleoprotein complex biogenesis | 151/3918 | 463/18723 | 1.96e-09 | 1.39e-07 | 151 |
| GO:2001233 | Colorectum | AD | regulation of apoptotic signaling pathway | 119/3918 | 356/18723 | 2.14e-08 | 1.21e-06 | 119 |
| GO:0009743 | Colorectum | AD | response to carbohydrate | 86/3918 | 253/18723 | 8.43e-07 | 2.90e-05 | 86 |
| GO:0006403 | Colorectum | AD | RNA localization | 71/3918 | 201/18723 | 1.54e-06 | 4.76e-05 | 71 |
| GO:0043281 | Colorectum | AD | regulation of cysteine-type endopeptidase activity involved in apoptotic process | 72/3918 | 209/18723 | 3.70e-06 | 1.03e-04 | 72 |
| GO:2000116 | Colorectum | AD | regulation of cysteine-type endopeptidase activity | 79/3918 | 235/18723 | 3.74e-06 | 1.03e-04 | 79 |
| GO:0052547 | Colorectum | AD | regulation of peptidase activity | 137/3918 | 461/18723 | 4.12e-06 | 1.12e-04 | 137 |
| GO:0034284 | Colorectum | AD | response to monosaccharide | 76/3918 | 225/18723 | 4.64e-06 | 1.23e-04 | 76 |
| GO:0033500 | Colorectum | AD | carbohydrate homeostasis | 84/3918 | 259/18723 | 9.10e-06 | 2.15e-04 | 84 |
| GO:0009746 | Colorectum | AD | response to hexose | 73/3918 | 219/18723 | 1.20e-05 | 2.65e-04 | 73 |
| GO:0009749 | Colorectum | AD | response to glucose | 71/3918 | 212/18723 | 1.31e-05 | 2.85e-04 | 71 |
| GO:0042593 | Colorectum | AD | glucose homeostasis | 83/3918 | 258/18723 | 1.44e-05 | 3.11e-04 | 83 |
| GO:2001234 | Colorectum | AD | negative regulation of apoptotic signaling pathway | 74/3918 | 224/18723 | 1.49e-05 | 3.18e-04 | 74 |
| GO:0001678 | Colorectum | AD | cellular glucose homeostasis | 60/3918 | 172/18723 | 1.49e-05 | 3.18e-04 | 60 |
| GO:0045861 | Colorectum | AD | negative regulation of proteolysis | 106/3918 | 351/18723 | 2.33e-05 | 4.57e-04 | 106 |
| Page: 1 2 3 4 5 6 7 8 9 10 11 12 13 14 15 16 17 18 19 20 21 22 23 24 25 26 27 28 29 30 31 32 33 34 35 36 37 38 39 |
| Pathway ID | Tissue | Disease Stage | Description | Gene Ratio | Bg Ratio | pvalue | p.adjust | qvalue | Count |
| Page: 1 |
Top |
Cell-cell communication analysis |
| Identification of potential cell-cell interactions between two cell types and their ligand-receptor pairs for different disease states |
| Ligand | Receptor | LRpair | Pathway | Tissue | Disease Stage |
| Page: 1 |
Top |
Single-cell gene regulatory network inference analysis |
| Find out the significant the regulons (TFs) and the target genes of each regulon across cell types for different disease states |
| TF | Cell Type | Tissue | Disease Stage | Target Gene | RSS | Regulon Activity |
| ∗The dot plots of a searched regulon are shown for all cell subpopulations in each disease state of each tissue based on the regulon specific score inferred using pySCENIC and by calculating the average expression. |
| Page: 1 |
Top |
Somatic mutation of malignant transformation related genes |
| Annotation of somatic variants for genes involved in malignant transformation |
| Hugo Symbol | Variant Class | Variant Classification | dbSNP RS | HGVSc | HGVSp | HGVSp Short | SWISSPROT | BIOTYPE | SIFT | PolyPhen | Tumor Sample Barcode | Tissue | Histology | Sex | Age | Stage | Therapy Types | Drugs | Outcome |
| PIH1D1 | SNV | Missense_Mutation | novel | c.307N>G | p.Leu103Val | p.L103V | Q9NWS0 | protein_coding | deleterious(0.01) | possibly_damaging(0.833) | TCGA-B6-A40C-01 | Breast | breast invasive carcinoma | Female | <65 | I/II | Hormone Therapy | cyclophosphamide | SD |
| PIH1D1 | SNV | Missense_Mutation | novel | c.311N>T | p.Gly104Val | p.G104V | Q9NWS0 | protein_coding | deleterious(0) | probably_damaging(1) | TCGA-BH-A0B6-01 | Breast | breast invasive carcinoma | Female | <65 | I/II | Unknown | Unknown | SD |
| PIH1D1 | SNV | Missense_Mutation | novel | c.356N>A | p.Ala119Asp | p.A119D | Q9NWS0 | protein_coding | deleterious(0) | probably_damaging(0.986) | TCGA-BH-A8FZ-01 | Breast | breast invasive carcinoma | Female | <65 | I/II | Unknown | Unknown | SD |
| PIH1D1 | SNV | Missense_Mutation | c.100G>A | p.Glu34Lys | p.E34K | Q9NWS0 | protein_coding | tolerated(0.22) | benign(0.012) | TCGA-A6-2675-01 | Colorectum | colon adenocarcinoma | Male | >=65 | I/II | Unknown | Unknown | SD | |
| PIH1D1 | SNV | Missense_Mutation | c.680N>A | p.Pro227His | p.P227H | Q9NWS0 | protein_coding | deleterious(0) | possibly_damaging(0.889) | TCGA-A6-2686-01 | Colorectum | colon adenocarcinoma | Female | >=65 | I/II | Unknown | Unknown | SD | |
| PIH1D1 | SNV | Missense_Mutation | rs564302977 | c.235N>A | p.Ala79Thr | p.A79T | Q9NWS0 | protein_coding | tolerated(0.18) | benign(0.014) | TCGA-A6-6780-01 | Colorectum | colon adenocarcinoma | Male | >=65 | I/II | Unknown | Unknown | SD |
| PIH1D1 | SNV | Missense_Mutation | rs748132366 | c.851N>T | p.Pro284Leu | p.P284L | Q9NWS0 | protein_coding | deleterious(0) | probably_damaging(0.999) | TCGA-AA-3492-01 | Colorectum | colon adenocarcinoma | Female | >=65 | I/II | Unknown | Unknown | SD |
| PIH1D1 | SNV | Missense_Mutation | novel | c.361N>A | p.Asp121Asn | p.D121N | Q9NWS0 | protein_coding | deleterious(0) | probably_damaging(0.971) | TCGA-AG-A002-01 | Colorectum | rectum adenocarcinoma | Male | <65 | I/II | Unknown | Unknown | SD |
| PIH1D1 | SNV | Missense_Mutation | rs745816366 | c.667N>A | p.Glu223Lys | p.E223K | Q9NWS0 | protein_coding | deleterious(0.05) | probably_damaging(0.995) | TCGA-EI-6917-01 | Colorectum | rectum adenocarcinoma | Male | <65 | III/IV | Chemotherapy | 5fluorouracil+oxaciplatina+l-folinian | SD |
| PIH1D1 | SNV | Missense_Mutation | novel | c.838A>C | p.Met280Leu | p.M280L | Q9NWS0 | protein_coding | tolerated(0.52) | benign(0) | TCGA-F5-6814-01 | Colorectum | rectum adenocarcinoma | Male | <65 | I/II | Unknown | Unknown | SD |
| Page: 1 2 3 4 |
Top |
Related drugs of malignant transformation related genes |
| Identification of chemicals and drugs interact with genes involved in malignant transfromation |
| (DGIdb 4.0) |
| Entrez ID | Symbol | Category | Interaction Types | Drug Claim Name | Drug Name | PMIDs |
| Page: 1 |

Copyright 2023-Present -The University of Texas Health Science Center at Houston |