
|
|||||
|
 | |
| |
| |
| |
| |
| |
|
Gene: PIGZ |
Gene summary for PIGZ |
| Gene information | Species | Human | Gene symbol | PIGZ | Gene ID | 80235 |
| Gene name | phosphatidylinositol glycan anchor biosynthesis class Z | |
| Gene Alias | GPI-MT-IV | |
| Cytomap | 3q29 | |
| Gene Type | protein-coding | GO ID | GO:0006464 | UniProtAcc | B4DL68 |
Top |
Malignant transformation analysis |
| Identification of the aberrant gene expression in precancerous and cancerous lesions by comparing the gene expression of stem-like cells in diseased tissues with normal stem cells |
| Entrez ID | Symbol | Replicates | Species | Organ | Tissue | Adj P-value | Log2FC | Malignancy |
| 80235 | PIGZ | HTA11_2487_2000001011 | Human | Colorectum | SER | 3.16e-02 | 4.35e-01 | -0.1808 |
| 80235 | PIGZ | HTA11_1938_2000001011 | Human | Colorectum | AD | 3.37e-17 | 9.64e-01 | -0.0811 |
| 80235 | PIGZ | HTA11_78_2000001011 | Human | Colorectum | AD | 5.93e-06 | 5.61e-01 | -0.1088 |
| 80235 | PIGZ | HTA11_347_2000001011 | Human | Colorectum | AD | 9.07e-34 | 1.14e+00 | -0.1954 |
| 80235 | PIGZ | HTA11_411_2000001011 | Human | Colorectum | SER | 1.50e-03 | 8.58e-01 | -0.2602 |
| 80235 | PIGZ | HTA11_83_2000001011 | Human | Colorectum | SER | 1.34e-02 | 5.11e-01 | -0.1526 |
| 80235 | PIGZ | HTA11_696_2000001011 | Human | Colorectum | AD | 1.39e-04 | 4.75e-01 | -0.1464 |
| 80235 | PIGZ | HTA11_866_2000001011 | Human | Colorectum | AD | 1.34e-08 | 5.55e-01 | -0.1001 |
| 80235 | PIGZ | HTA11_546_2000001011 | Human | Colorectum | AD | 1.31e-02 | 6.20e-01 | -0.0842 |
| 80235 | PIGZ | HTA11_99999970781_79442 | Human | Colorectum | MSS | 3.35e-09 | -4.36e-01 | 0.294 |
| 80235 | PIGZ | HTA11_99999971662_82457 | Human | Colorectum | MSS | 2.98e-04 | -4.40e-01 | 0.3859 |
| 80235 | PIGZ | HTA11_99999973899_84307 | Human | Colorectum | MSS | 1.42e-02 | -5.42e-01 | 0.2585 |
| 80235 | PIGZ | HTA11_99999974143_84620 | Human | Colorectum | MSS | 1.80e-08 | -4.68e-01 | 0.3005 |
| 80235 | PIGZ | F007 | Human | Colorectum | FAP | 1.46e-03 | -3.40e-01 | 0.1176 |
| 80235 | PIGZ | A002-C-010 | Human | Colorectum | FAP | 9.75e-03 | -2.45e-01 | 0.242 |
| 80235 | PIGZ | A001-C-207 | Human | Colorectum | FAP | 1.99e-02 | -2.80e-01 | 0.1278 |
| 80235 | PIGZ | A015-C-203 | Human | Colorectum | FAP | 3.27e-17 | -2.25e-01 | -0.1294 |
| 80235 | PIGZ | A015-C-204 | Human | Colorectum | FAP | 2.30e-05 | -2.12e-01 | -0.0228 |
| 80235 | PIGZ | A014-C-040 | Human | Colorectum | FAP | 2.89e-04 | -3.38e-01 | -0.1184 |
| 80235 | PIGZ | A002-C-201 | Human | Colorectum | FAP | 2.86e-11 | -3.70e-01 | 0.0324 |
| Page: 1 2 3 4 5 6 |
| Tissue | Expression Dynamics | Abbreviation |
| Colorectum (GSE201348) | 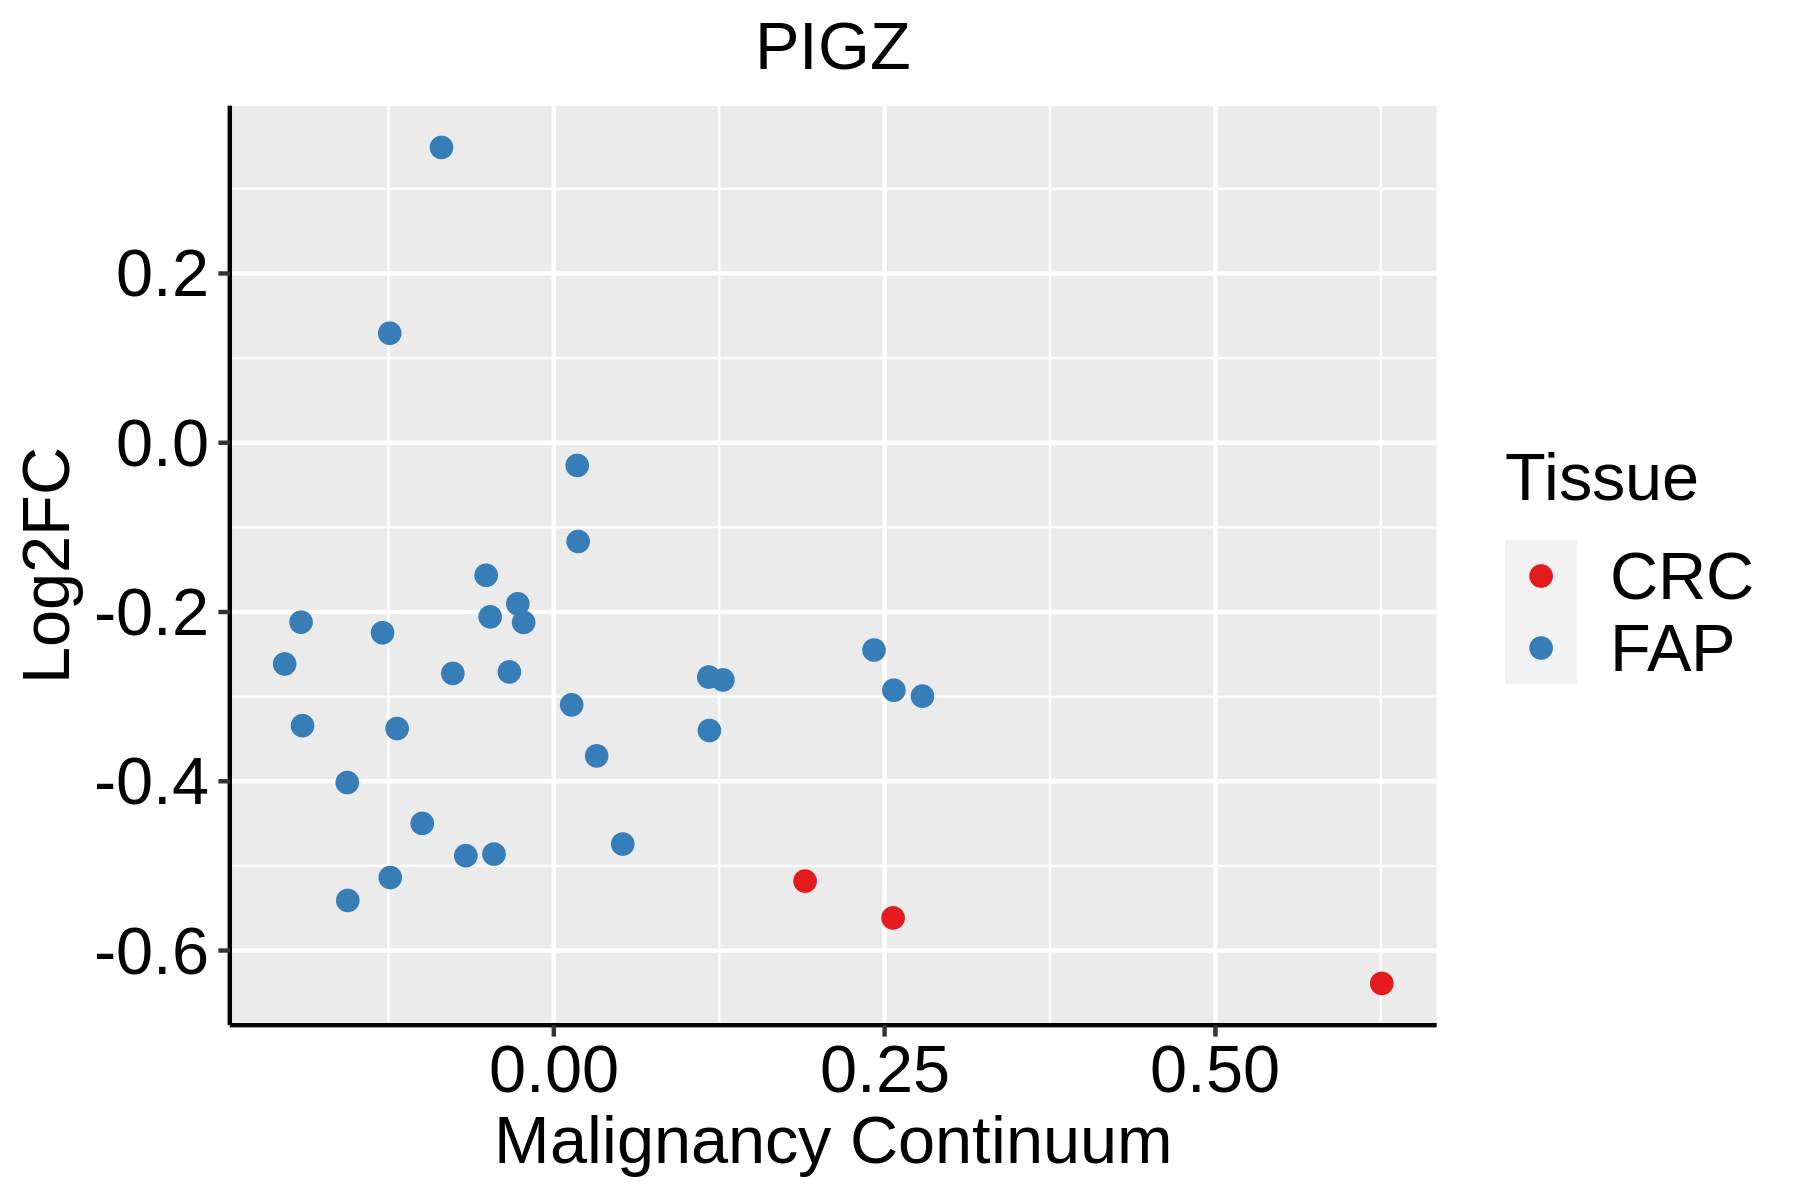 | FAP: Familial adenomatous polyposis |
| CRC: Colorectal cancer | ||
| Colorectum (HTA11) | 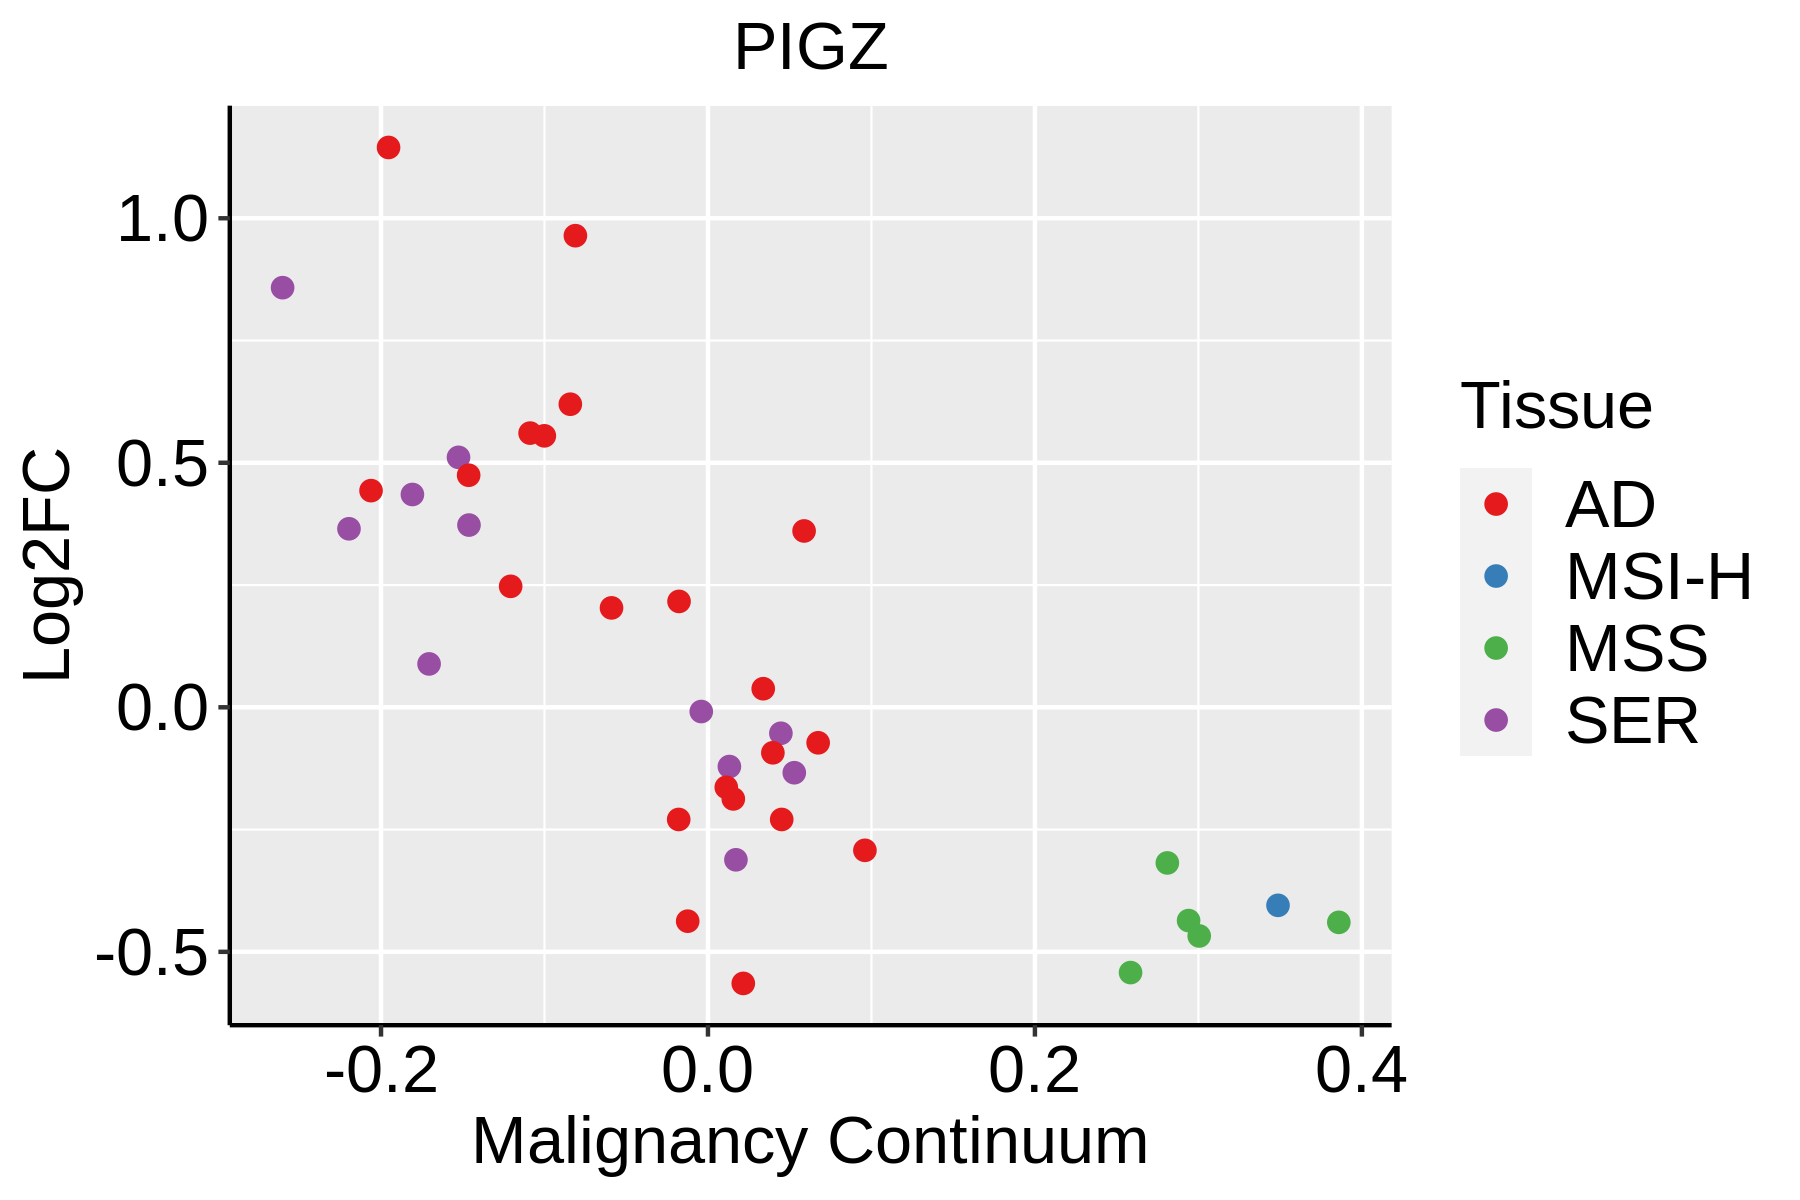 | AD: Adenomas |
| SER: Sessile serrated lesions | ||
| MSI-H: Microsatellite-high colorectal cancer | ||
| MSS: Microsatellite stable colorectal cancer | ||
| Esophagus | 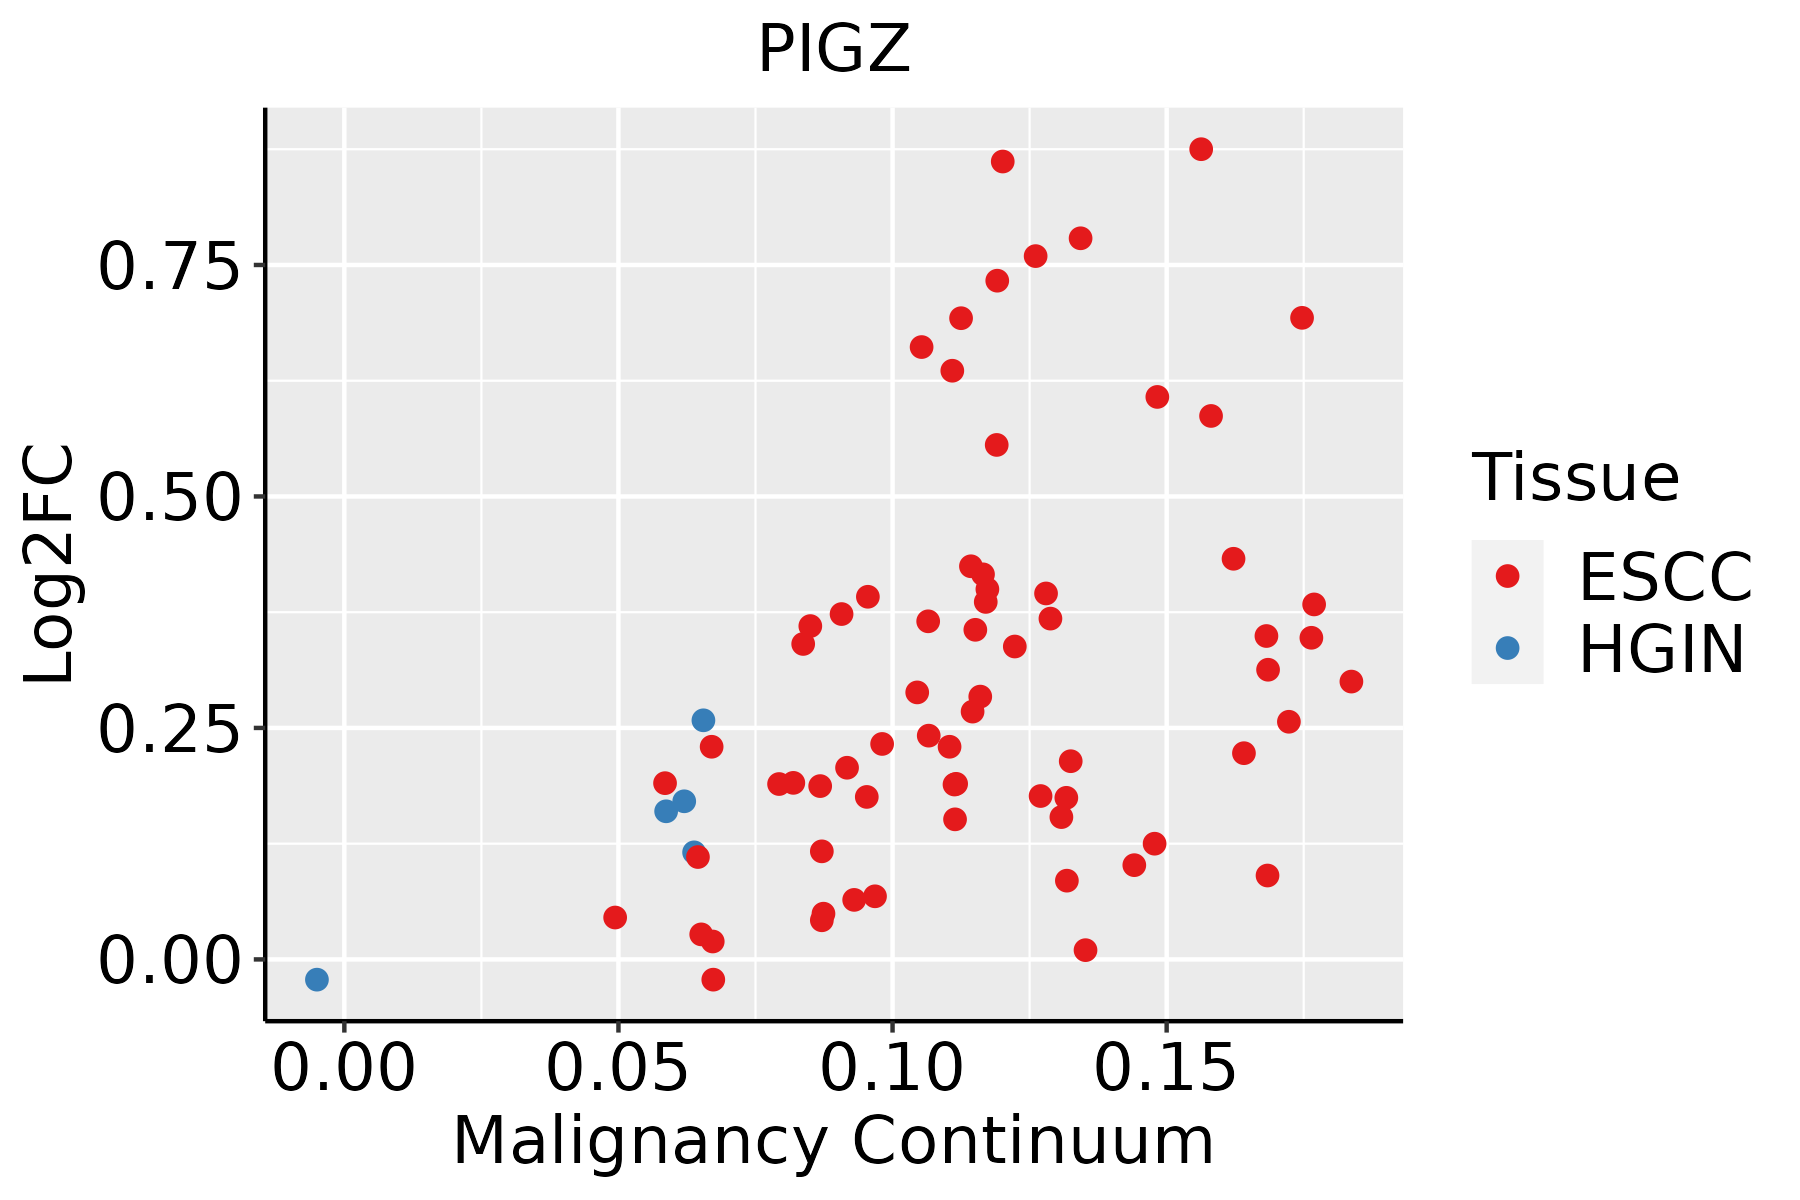 | ESCC: Esophageal squamous cell carcinoma |
| HGIN: High-grade intraepithelial neoplasias | ||
| LGIN: Low-grade intraepithelial neoplasias | ||
| Liver | 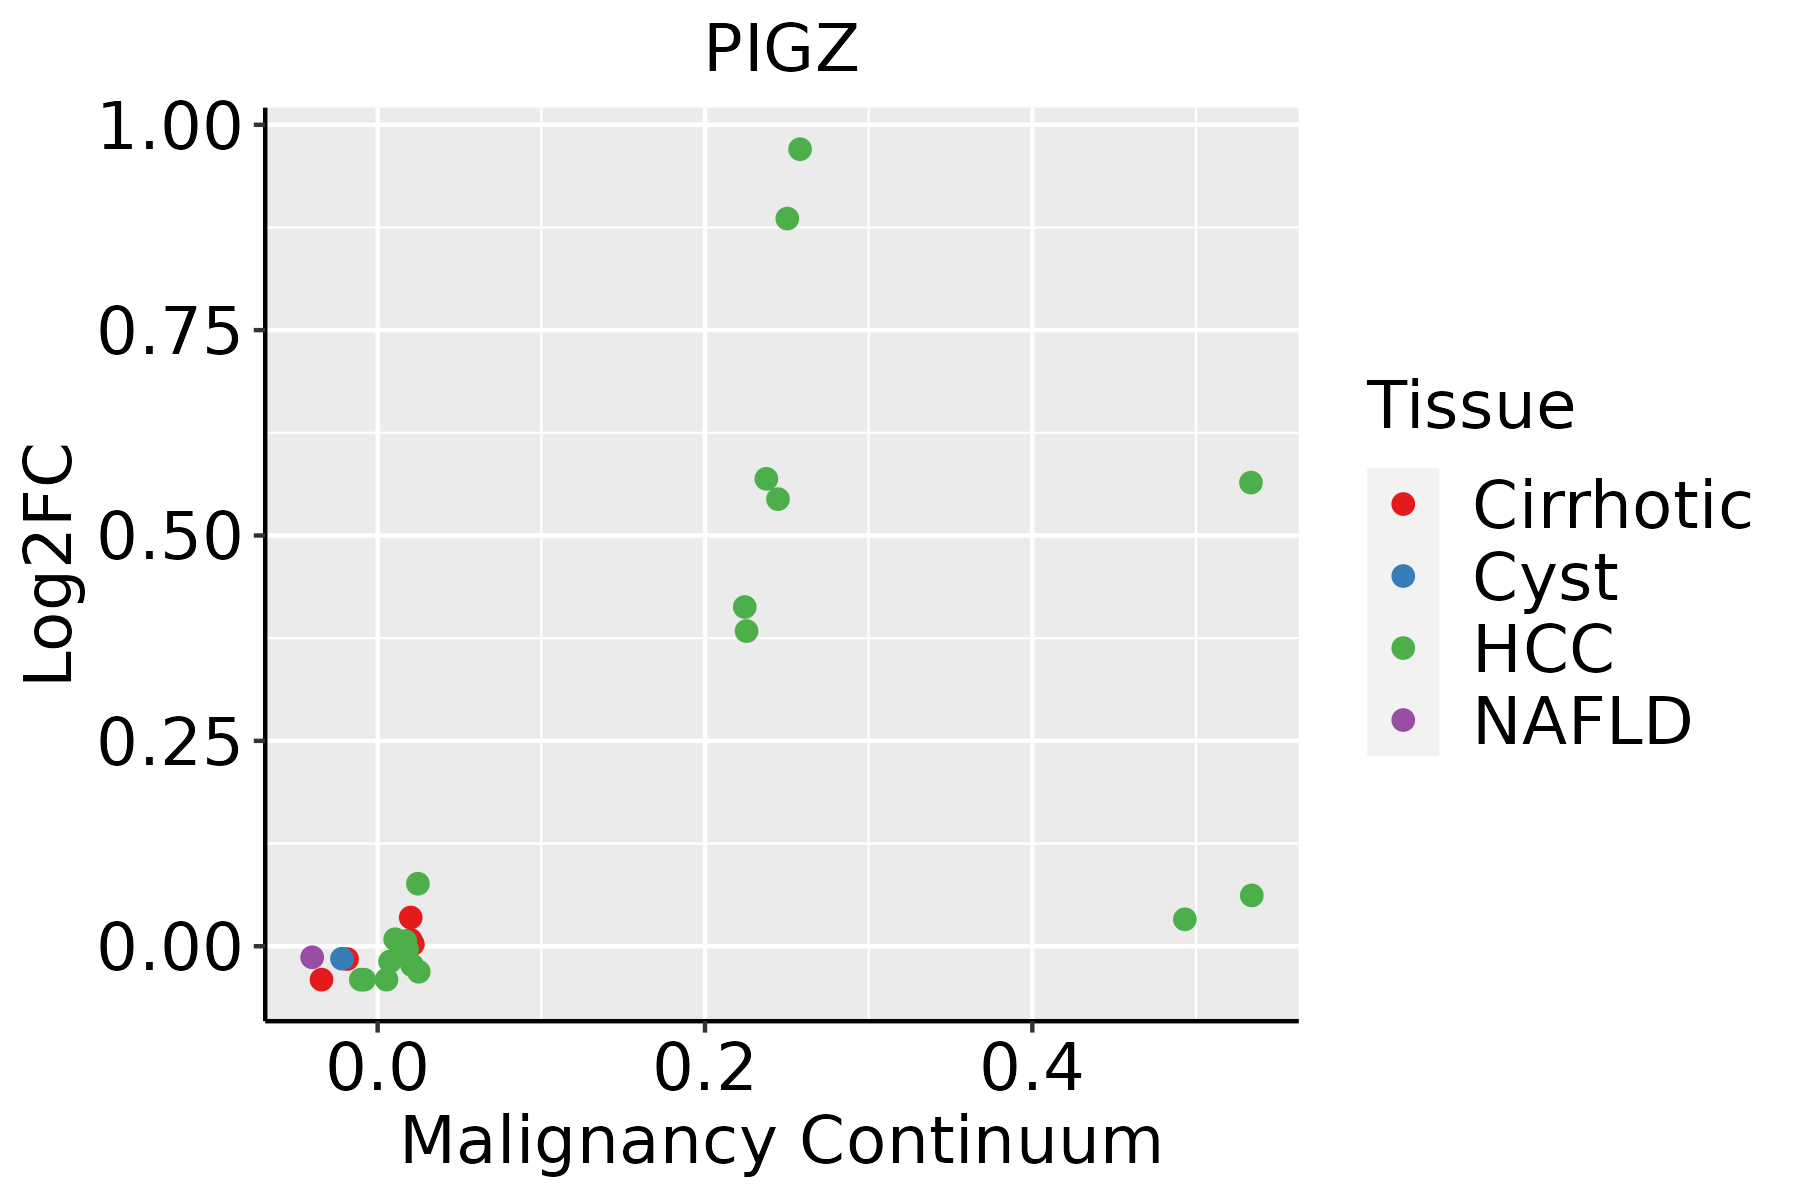 | HCC: Hepatocellular carcinoma |
| NAFLD: Non-alcoholic fatty liver disease |
| ∗log2FC in expression of this searched gene in stem-like cells from each diseased tissue sample relative to stem-like cells in normal samples in each tissue plotted against the malignancy continuum. Samples are colored based on if they are from different disease stage. |
Top |
Malignant transformation related pathway analysis |
| Find out the enriched GO biological processes and KEGG pathways involved in transition from healthy to precancer to cancer |
| Tissue | Disease Stage | Enriched GO biological Processes |
| Colorectum | AD |  |
| Colorectum | SER |  |
| Colorectum | MSS |  |
| Colorectum | MSI-H |  |
| Colorectum | FAP |  |
| ∗Top 15 enriched GO BP terms are showed in the bar plot of each disease state in each tissue. Each row represents a significant GO biological process which is colored according to the -log10(p.adjust). |
| Page: 1 2 3 4 5 6 7 8 9 |
| GO ID | Tissue | Disease Stage | Description | Gene Ratio | Bg Ratio | pvalue | p.adjust | Count |
| GO:0006650 | Colorectum | AD | glycerophospholipid metabolic process | 83/3918 | 306/18723 | 5.40e-03 | 3.55e-02 | 83 |
| GO:0070085 | Colorectum | AD | glycosylation | 67/3918 | 240/18723 | 5.78e-03 | 3.67e-02 | 67 |
| GO:0006644 | Colorectum | AD | phospholipid metabolic process | 101/3918 | 383/18723 | 5.80e-03 | 3.67e-02 | 101 |
| GO:0045017 | Colorectum | AD | glycerolipid biosynthetic process | 69/3918 | 252/18723 | 8.33e-03 | 4.88e-02 | 69 |
| GO:0046486 | Colorectum | SER | glycerolipid metabolic process | 82/2897 | 392/18723 | 2.26e-03 | 2.17e-02 | 82 |
| GO:00066441 | Colorectum | SER | phospholipid metabolic process | 79/2897 | 383/18723 | 3.94e-03 | 3.24e-02 | 79 |
| GO:00450171 | Colorectum | SER | glycerolipid biosynthetic process | 55/2897 | 252/18723 | 4.47e-03 | 3.56e-02 | 55 |
| GO:00066501 | Colorectum | SER | glycerophospholipid metabolic process | 64/2897 | 306/18723 | 6.41e-03 | 4.60e-02 | 64 |
| GO:0008654 | Colorectum | FAP | phospholipid biosynthetic process | 54/2622 | 253/18723 | 8.88e-04 | 9.08e-03 | 54 |
| GO:00066502 | Colorectum | FAP | glycerophospholipid metabolic process | 62/2622 | 306/18723 | 1.54e-03 | 1.38e-02 | 62 |
| GO:00066442 | Colorectum | FAP | phospholipid metabolic process | 74/2622 | 383/18723 | 2.24e-03 | 1.83e-02 | 74 |
| GO:00700851 | Colorectum | FAP | glycosylation | 50/2622 | 240/18723 | 2.30e-03 | 1.85e-02 | 50 |
| GO:0046474 | Colorectum | FAP | glycerophospholipid biosynthetic process | 44/2622 | 211/18723 | 3.98e-03 | 2.76e-02 | 44 |
| GO:00450172 | Colorectum | FAP | glycerolipid biosynthetic process | 50/2622 | 252/18723 | 6.32e-03 | 3.95e-02 | 50 |
| GO:00086541 | Colorectum | CRC | phospholipid biosynthetic process | 49/2078 | 253/18723 | 7.07e-05 | 1.51e-03 | 49 |
| GO:00066503 | Colorectum | CRC | glycerophospholipid metabolic process | 55/2078 | 306/18723 | 2.10e-04 | 3.55e-03 | 55 |
| GO:00450173 | Colorectum | CRC | glycerolipid biosynthetic process | 47/2078 | 252/18723 | 2.47e-04 | 4.06e-03 | 47 |
| GO:00066443 | Colorectum | CRC | phospholipid metabolic process | 65/2078 | 383/18723 | 3.21e-04 | 4.95e-03 | 65 |
| GO:00464741 | Colorectum | CRC | glycerophospholipid biosynthetic process | 40/2078 | 211/18723 | 4.91e-04 | 7.02e-03 | 40 |
| GO:00464861 | Colorectum | CRC | glycerolipid metabolic process | 64/2078 | 392/18723 | 1.01e-03 | 1.19e-02 | 64 |
| Page: 1 2 3 |
| Pathway ID | Tissue | Disease Stage | Description | Gene Ratio | Bg Ratio | pvalue | p.adjust | qvalue | Count |
| hsa005632 | Esophagus | ESCC | Glycosylphosphatidylinositol (GPI)-anchor biosynthesis | 21/4205 | 26/8465 | 1.10e-03 | 3.42e-03 | 1.75e-03 | 21 |
| hsa0056311 | Esophagus | ESCC | Glycosylphosphatidylinositol (GPI)-anchor biosynthesis | 21/4205 | 26/8465 | 1.10e-03 | 3.42e-03 | 1.75e-03 | 21 |
| Page: 1 |
Top |
Cell-cell communication analysis |
| Identification of potential cell-cell interactions between two cell types and their ligand-receptor pairs for different disease states |
| Ligand | Receptor | LRpair | Pathway | Tissue | Disease Stage |
| Page: 1 |
Top |
Single-cell gene regulatory network inference analysis |
| Find out the significant the regulons (TFs) and the target genes of each regulon across cell types for different disease states |
| TF | Cell Type | Tissue | Disease Stage | Target Gene | RSS | Regulon Activity |
| ∗The dot plots of a searched regulon are shown for all cell subpopulations in each disease state of each tissue based on the regulon specific score inferred using pySCENIC and by calculating the average expression. |
| Page: 1 |
Top |
Somatic mutation of malignant transformation related genes |
| Annotation of somatic variants for genes involved in malignant transformation |
| Hugo Symbol | Variant Class | Variant Classification | dbSNP RS | HGVSc | HGVSp | HGVSp Short | SWISSPROT | BIOTYPE | SIFT | PolyPhen | Tumor Sample Barcode | Tissue | Histology | Sex | Age | Stage | Therapy Types | Drugs | Outcome |
| PIGZ | SNV | Missense_Mutation | rs202160888 | c.604C>T | p.Arg202Cys | p.R202C | Q86VD9 | protein_coding | tolerated(0.13) | benign(0.001) | TCGA-A8-A08X-01 | Breast | breast invasive carcinoma | Female | <65 | III/IV | Chemotherapy | doxorubicin | PD |
| PIGZ | SNV | Missense_Mutation | rs752266694 | c.488N>G | p.Ser163Cys | p.S163C | Q86VD9 | protein_coding | deleterious(0.01) | possibly_damaging(0.754) | TCGA-AR-A24H-01 | Breast | breast invasive carcinoma | Female | >=65 | I/II | Hormone Therapy | tamoxiphen | SD |
| PIGZ | SNV | Missense_Mutation | c.700N>A | p.Ala234Thr | p.A234T | Q86VD9 | protein_coding | deleterious(0.01) | probably_damaging(0.99) | TCGA-D8-A1JK-01 | Breast | breast invasive carcinoma | Female | >=65 | I/II | Unknown | Unknown | SD | |
| PIGZ | insertion | Frame_Shift_Ins | novel | c.1431_1432insACCCA | p.Leu478ThrfsTer24 | p.L478Tfs*24 | Q86VD9 | protein_coding | TCGA-AO-A0JB-01 | Breast | breast invasive carcinoma | Female | <65 | III/IV | Chemotherapy | cyclophosphamide | SD | ||
| PIGZ | insertion | Frame_Shift_Ins | novel | c.1429_1430insACAATATGACAGA | p.Gly477AspfsTer19 | p.G477Dfs*19 | Q86VD9 | protein_coding | TCGA-AO-A0JB-01 | Breast | breast invasive carcinoma | Female | <65 | III/IV | Chemotherapy | cyclophosphamide | SD | ||
| PIGZ | deletion | Frame_Shift_Del | c.457delN | p.Ala153ArgfsTer44 | p.A153Rfs*44 | Q86VD9 | protein_coding | TCGA-D8-A27V-01 | Breast | breast invasive carcinoma | Female | <65 | I/II | Hormone Therapy | tamoxiphen | SD | |||
| PIGZ | deletion | Frame_Shift_Del | rs774420515 | c.1467delN | p.Thr490LeufsTer10 | p.T490Lfs*10 | Q86VD9 | protein_coding | TCGA-EA-A410-01 | Cervix | cervical & endocervical cancer | Female | <65 | I/II | Unknown | Unknown | SD | ||
| PIGZ | SNV | Missense_Mutation | c.1267N>A | p.Gly423Ser | p.G423S | Q86VD9 | protein_coding | deleterious(0.03) | possibly_damaging(0.548) | TCGA-AA-3492-01 | Colorectum | colon adenocarcinoma | Female | >=65 | I/II | Unknown | Unknown | SD | |
| PIGZ | SNV | Missense_Mutation | novel | c.1320N>T | p.Glu440Asp | p.E440D | Q86VD9 | protein_coding | tolerated(0.62) | benign(0.062) | TCGA-CA-6717-01 | Colorectum | colon adenocarcinoma | Male | <65 | I/II | Chemotherapy | oxaliplatin | CR |
| PIGZ | deletion | Frame_Shift_Del | rs774420515 | c.1467delN | p.Thr490LeufsTer10 | p.T490Lfs*10 | Q86VD9 | protein_coding | TCGA-A6-A565-01 | Colorectum | colon adenocarcinoma | Female | <65 | III/IV | Unspecific | 5FU | PD |
| Page: 1 2 3 4 5 6 |
Top |
Related drugs of malignant transformation related genes |
| Identification of chemicals and drugs interact with genes involved in malignant transfromation |
| (DGIdb 4.0) |
| Entrez ID | Symbol | Category | Interaction Types | Drug Claim Name | Drug Name | PMIDs |
| Page: 1 |

Copyright 2023-Present -The University of Texas Health Science Center at Houston |