
|
|||||
|
 | |
| |
| |
| |
| |
| |
|
Gene: PIGN |
Gene summary for PIGN |
| Gene information | Species | Human | Gene symbol | PIGN | Gene ID | 23556 |
| Gene name | phosphatidylinositol glycan anchor biosynthesis class N | |
| Gene Alias | MCAHS | |
| Cytomap | 18q21.33 | |
| Gene Type | protein-coding | GO ID | GO:0006464 | UniProtAcc | A0A024R2C3 |
Top |
Malignant transformation analysis |
| Identification of the aberrant gene expression in precancerous and cancerous lesions by comparing the gene expression of stem-like cells in diseased tissues with normal stem cells |
| Entrez ID | Symbol | Replicates | Species | Organ | Tissue | Adj P-value | Log2FC | Malignancy |
| 23556 | PIGN | CCI_1 | Human | Cervix | CC | 1.60e-03 | 5.07e-01 | 0.528 |
| 23556 | PIGN | CCI_2 | Human | Cervix | CC | 3.50e-06 | 6.00e-01 | 0.5249 |
| 23556 | PIGN | HTA11_3410_2000001011 | Human | Colorectum | AD | 4.46e-12 | -4.36e-01 | 0.0155 |
| 23556 | PIGN | HTA11_2487_2000001011 | Human | Colorectum | SER | 4.09e-03 | -3.72e-01 | -0.1808 |
| 23556 | PIGN | HTA11_866_3004761011 | Human | Colorectum | AD | 1.90e-09 | -4.74e-01 | 0.096 |
| 23556 | PIGN | HTA11_10711_2000001011 | Human | Colorectum | AD | 4.17e-05 | -4.11e-01 | 0.0338 |
| 23556 | PIGN | HTA11_7696_3000711011 | Human | Colorectum | AD | 4.75e-04 | -3.74e-01 | 0.0674 |
| 23556 | PIGN | HTA11_6818_2000001021 | Human | Colorectum | AD | 4.93e-03 | -3.74e-01 | 0.0588 |
| 23556 | PIGN | HTA11_99999971662_82457 | Human | Colorectum | MSS | 1.95e-08 | -4.65e-01 | 0.3859 |
| 23556 | PIGN | HTA11_99999973899_84307 | Human | Colorectum | MSS | 4.35e-02 | -4.69e-01 | 0.2585 |
| 23556 | PIGN | HTA11_99999974143_84620 | Human | Colorectum | MSS | 8.87e-11 | -4.87e-01 | 0.3005 |
| 23556 | PIGN | A001-C-207 | Human | Colorectum | FAP | 3.62e-02 | -1.63e-01 | 0.1278 |
| 23556 | PIGN | A015-C-203 | Human | Colorectum | FAP | 1.49e-21 | -4.33e-01 | -0.1294 |
| 23556 | PIGN | A015-C-204 | Human | Colorectum | FAP | 2.66e-05 | -2.85e-01 | -0.0228 |
| 23556 | PIGN | A014-C-040 | Human | Colorectum | FAP | 8.63e-05 | -4.69e-01 | -0.1184 |
| 23556 | PIGN | A002-C-201 | Human | Colorectum | FAP | 1.09e-16 | -4.01e-01 | 0.0324 |
| 23556 | PIGN | A001-C-119 | Human | Colorectum | FAP | 5.05e-10 | -4.30e-01 | -0.1557 |
| 23556 | PIGN | A001-C-108 | Human | Colorectum | FAP | 6.35e-14 | -3.73e-01 | -0.0272 |
| 23556 | PIGN | A002-C-205 | Human | Colorectum | FAP | 1.26e-24 | -4.82e-01 | -0.1236 |
| 23556 | PIGN | A001-C-104 | Human | Colorectum | FAP | 1.90e-03 | -2.61e-01 | 0.0184 |
| Page: 1 2 3 |
| Tissue | Expression Dynamics | Abbreviation |
| Cervix | 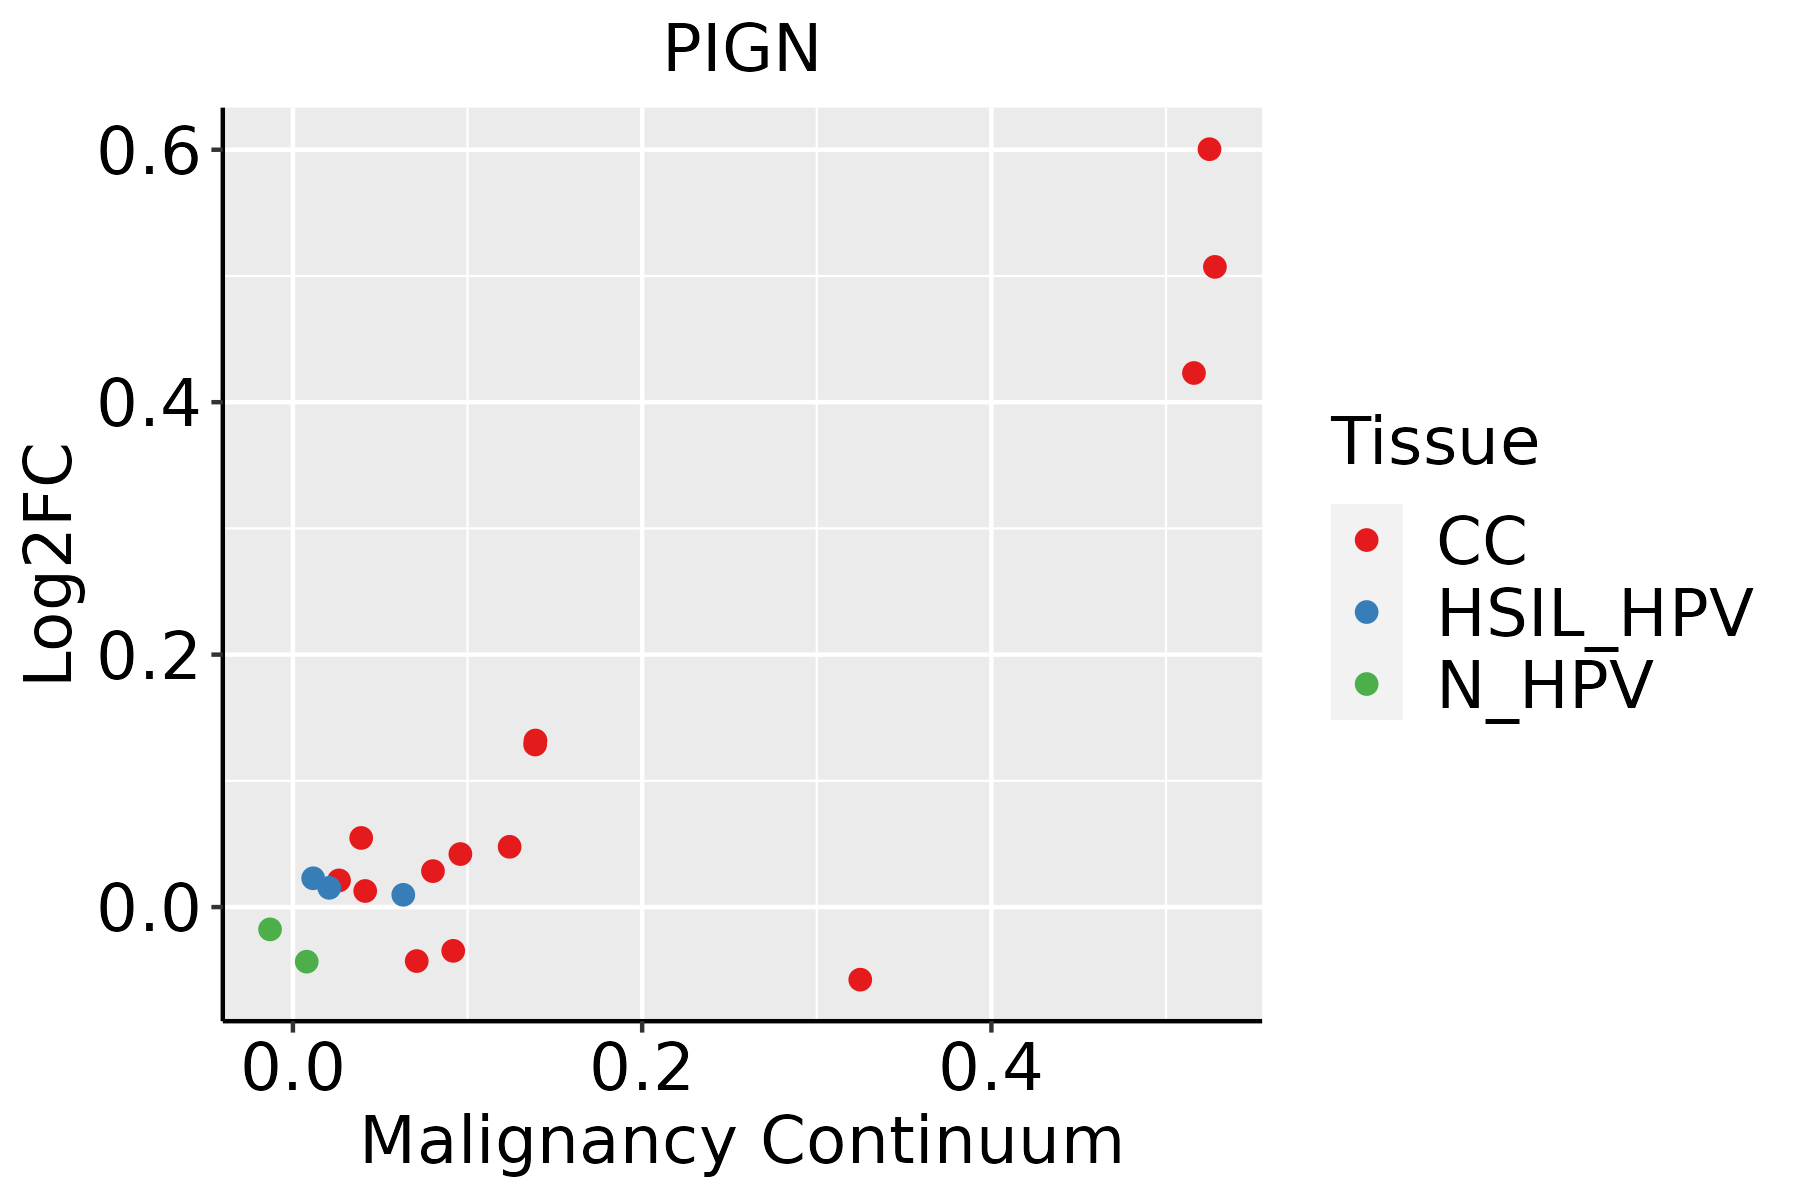 | CC: Cervix cancer |
| HSIL_HPV: HPV-infected high-grade squamous intraepithelial lesions | ||
| N_HPV: HPV-infected normal cervix | ||
| Colorectum (GSE201348) | 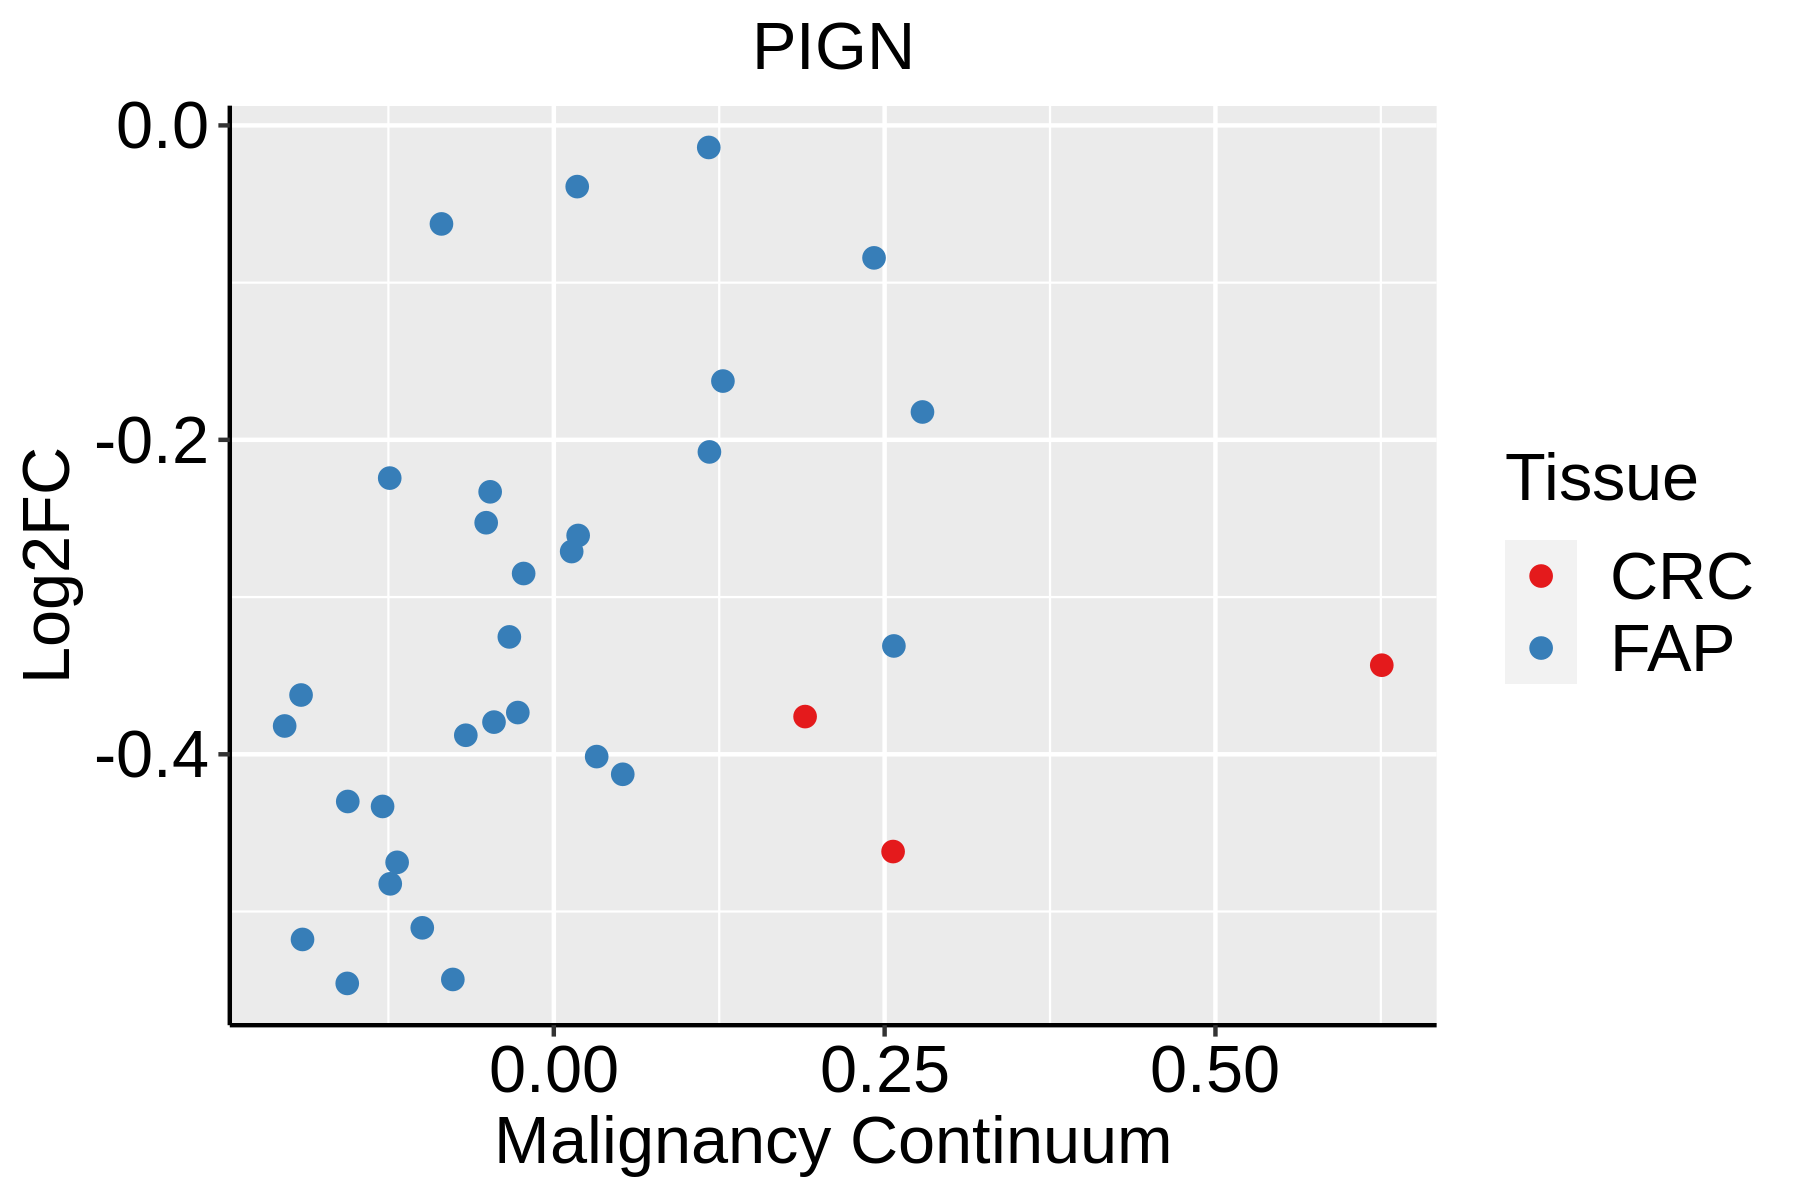 | FAP: Familial adenomatous polyposis |
| CRC: Colorectal cancer | ||
| Colorectum (HTA11) |  | AD: Adenomas |
| SER: Sessile serrated lesions | ||
| MSI-H: Microsatellite-high colorectal cancer | ||
| MSS: Microsatellite stable colorectal cancer | ||
| Lung | 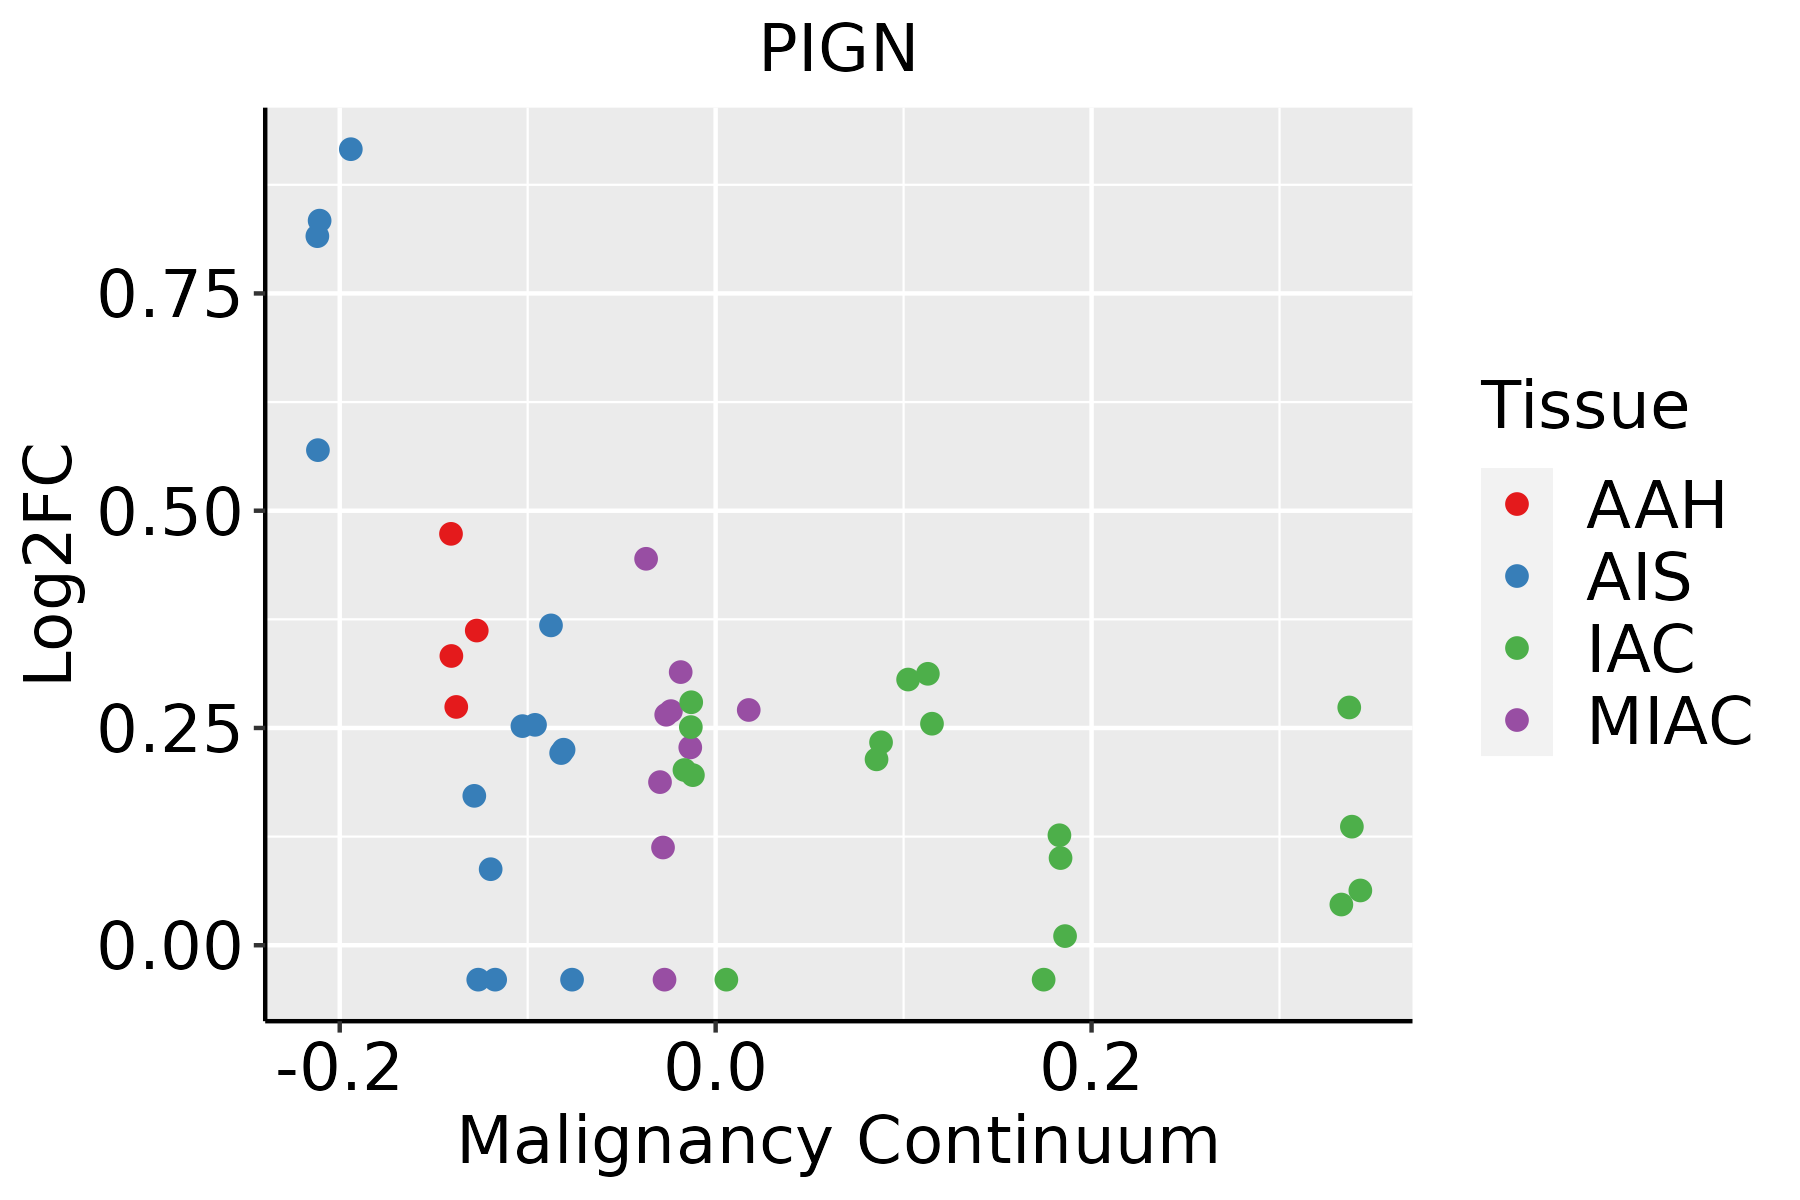 | AAH: Atypical adenomatous hyperplasia |
| AIS: Adenocarcinoma in situ | ||
| IAC: Invasive lung adenocarcinoma | ||
| MIA: Minimally invasive adenocarcinoma |
| ∗log2FC in expression of this searched gene in stem-like cells from each diseased tissue sample relative to stem-like cells in normal samples in each tissue plotted against the malignancy continuum. Samples are colored based on if they are from different disease stage. |
Top |
Malignant transformation related pathway analysis |
| Find out the enriched GO biological processes and KEGG pathways involved in transition from healthy to precancer to cancer |
| Tissue | Disease Stage | Enriched GO biological Processes |
| Colorectum | AD |  |
| Colorectum | SER |  |
| Colorectum | MSS |  |
| Colorectum | MSI-H |  |
| Colorectum | FAP |  |
| ∗Top 15 enriched GO BP terms are showed in the bar plot of each disease state in each tissue. Each row represents a significant GO biological process which is colored according to the -log10(p.adjust). |
| Page: 1 2 3 4 5 6 7 8 9 |
| GO ID | Tissue | Disease Stage | Description | Gene Ratio | Bg Ratio | pvalue | p.adjust | Count |
| GO:0006650 | Colorectum | AD | glycerophospholipid metabolic process | 83/3918 | 306/18723 | 5.40e-03 | 3.55e-02 | 83 |
| GO:0006644 | Colorectum | AD | phospholipid metabolic process | 101/3918 | 383/18723 | 5.80e-03 | 3.67e-02 | 101 |
| GO:0045017 | Colorectum | AD | glycerolipid biosynthetic process | 69/3918 | 252/18723 | 8.33e-03 | 4.88e-02 | 69 |
| GO:0046486 | Colorectum | SER | glycerolipid metabolic process | 82/2897 | 392/18723 | 2.26e-03 | 2.17e-02 | 82 |
| GO:00066441 | Colorectum | SER | phospholipid metabolic process | 79/2897 | 383/18723 | 3.94e-03 | 3.24e-02 | 79 |
| GO:00450171 | Colorectum | SER | glycerolipid biosynthetic process | 55/2897 | 252/18723 | 4.47e-03 | 3.56e-02 | 55 |
| GO:00066501 | Colorectum | SER | glycerophospholipid metabolic process | 64/2897 | 306/18723 | 6.41e-03 | 4.60e-02 | 64 |
| GO:0008654 | Colorectum | FAP | phospholipid biosynthetic process | 54/2622 | 253/18723 | 8.88e-04 | 9.08e-03 | 54 |
| GO:00066502 | Colorectum | FAP | glycerophospholipid metabolic process | 62/2622 | 306/18723 | 1.54e-03 | 1.38e-02 | 62 |
| GO:00066442 | Colorectum | FAP | phospholipid metabolic process | 74/2622 | 383/18723 | 2.24e-03 | 1.83e-02 | 74 |
| GO:0046474 | Colorectum | FAP | glycerophospholipid biosynthetic process | 44/2622 | 211/18723 | 3.98e-03 | 2.76e-02 | 44 |
| GO:00450172 | Colorectum | FAP | glycerolipid biosynthetic process | 50/2622 | 252/18723 | 6.32e-03 | 3.95e-02 | 50 |
| GO:00086541 | Colorectum | CRC | phospholipid biosynthetic process | 49/2078 | 253/18723 | 7.07e-05 | 1.51e-03 | 49 |
| GO:00066503 | Colorectum | CRC | glycerophospholipid metabolic process | 55/2078 | 306/18723 | 2.10e-04 | 3.55e-03 | 55 |
| GO:00450173 | Colorectum | CRC | glycerolipid biosynthetic process | 47/2078 | 252/18723 | 2.47e-04 | 4.06e-03 | 47 |
| GO:00066443 | Colorectum | CRC | phospholipid metabolic process | 65/2078 | 383/18723 | 3.21e-04 | 4.95e-03 | 65 |
| GO:00464741 | Colorectum | CRC | glycerophospholipid biosynthetic process | 40/2078 | 211/18723 | 4.91e-04 | 7.02e-03 | 40 |
| GO:00464861 | Colorectum | CRC | glycerolipid metabolic process | 64/2078 | 392/18723 | 1.01e-03 | 1.19e-02 | 64 |
| Page: 1 |
| Pathway ID | Tissue | Disease Stage | Description | Gene Ratio | Bg Ratio | pvalue | p.adjust | qvalue | Count |
| Page: 1 |
Top |
Cell-cell communication analysis |
| Identification of potential cell-cell interactions between two cell types and their ligand-receptor pairs for different disease states |
| Ligand | Receptor | LRpair | Pathway | Tissue | Disease Stage |
| Page: 1 |
Top |
Single-cell gene regulatory network inference analysis |
| Find out the significant the regulons (TFs) and the target genes of each regulon across cell types for different disease states |
| TF | Cell Type | Tissue | Disease Stage | Target Gene | RSS | Regulon Activity |
| ∗The dot plots of a searched regulon are shown for all cell subpopulations in each disease state of each tissue based on the regulon specific score inferred using pySCENIC and by calculating the average expression. |
| Page: 1 |
Top |
Somatic mutation of malignant transformation related genes |
| Annotation of somatic variants for genes involved in malignant transformation |
| Hugo Symbol | Variant Class | Variant Classification | dbSNP RS | HGVSc | HGVSp | HGVSp Short | SWISSPROT | BIOTYPE | SIFT | PolyPhen | Tumor Sample Barcode | Tissue | Histology | Sex | Age | Stage | Therapy Types | Drugs | Outcome |
| PIGN | SNV | Missense_Mutation | c.2299N>C | p.Phe767Leu | p.F767L | protein_coding | deleterious(0) | possibly_damaging(0.872) | TCGA-A8-A09Z-01 | Breast | breast invasive carcinoma | Female | >=65 | I/II | Unknown | Unknown | SD | ||
| PIGN | SNV | Missense_Mutation | novel | c.2108C>A | p.Ser703Tyr | p.S703Y | protein_coding | tolerated(0.05) | possibly_damaging(0.815) | TCGA-BH-A5IZ-01 | Breast | breast invasive carcinoma | Female | <65 | I/II | Chemotherapy | adriamycin | CR | |
| PIGN | SNV | Missense_Mutation | rs780781469 | c.2567C>T | p.Ser856Leu | p.S856L | protein_coding | deleterious(0.01) | probably_damaging(0.972) | TCGA-EW-A1J2-01 | Breast | breast invasive carcinoma | Female | <65 | I/II | Chemotherapy | taxotere | SD | |
| PIGN | SNV | Missense_Mutation | novel | c.1910C>T | p.Ser637Phe | p.S637F | protein_coding | tolerated(0.79) | benign(0.037) | TCGA-GM-A3NW-01 | Breast | breast invasive carcinoma | Female | <65 | I/II | Chemotherapy | fluorouracil | SD | |
| PIGN | SNV | Missense_Mutation | novel | c.1568N>G | p.Leu523Arg | p.L523R | protein_coding | deleterious(0) | probably_damaging(0.917) | TCGA-LD-A9QF-01 | Breast | breast invasive carcinoma | Female | >=65 | I/II | Chemotherapy | taxol | SD | |
| PIGN | SNV | Missense_Mutation | c.2631N>G | p.Phe877Leu | p.F877L | protein_coding | deleterious(0) | probably_damaging(0.917) | TCGA-FU-A23K-01 | Cervix | cervical & endocervical cancer | Female | <65 | III/IV | Unknown | Unknown | SD | ||
| PIGN | SNV | Missense_Mutation | rs753014750 | c.212C>T | p.Pro71Leu | p.P71L | protein_coding | deleterious(0) | probably_damaging(1) | TCGA-A6-A566-01 | Colorectum | colon adenocarcinoma | Female | <65 | III/IV | Chemotherapy | oxaliplatin | PD | |
| PIGN | SNV | Missense_Mutation | c.2741N>G | p.Leu914Arg | p.L914R | protein_coding | deleterious(0) | benign(0.245) | TCGA-CM-5348-01 | Colorectum | colon adenocarcinoma | Male | >=65 | III/IV | Unknown | Unknown | SD | ||
| PIGN | SNV | Missense_Mutation | rs201242848 | c.265C>T | p.Arg89Cys | p.R89C | protein_coding | deleterious(0) | probably_damaging(0.997) | TCGA-D5-6530-01 | Colorectum | colon adenocarcinoma | Male | <65 | I/II | Unknown | Unknown | SD | |
| PIGN | SNV | Missense_Mutation | c.2552T>C | p.Leu851Ser | p.L851S | protein_coding | tolerated(0.08) | benign(0.122) | TCGA-D5-6928-01 | Colorectum | colon adenocarcinoma | Male | >=65 | I/II | Unknown | Unknown | SD |
| Page: 1 2 3 4 5 6 7 |
Top |
Related drugs of malignant transformation related genes |
| Identification of chemicals and drugs interact with genes involved in malignant transfromation |
| (DGIdb 4.0) |
| Entrez ID | Symbol | Category | Interaction Types | Drug Claim Name | Drug Name | PMIDs |
| Page: 1 |

Copyright 2023-Present -The University of Texas Health Science Center at Houston |