
|
|||||
|
 | |
| |
| |
| |
| |
| |
|
Gene: PIGM |
Gene summary for PIGM |
| Gene information | Species | Human | Gene symbol | PIGM | Gene ID | 93183 |
| Gene name | phosphatidylinositol glycan anchor biosynthesis class M | |
| Gene Alias | GPI-MT-I | |
| Cytomap | 1q23.2 | |
| Gene Type | protein-coding | GO ID | GO:0006464 | UniProtAcc | Q9H3S5 |
Top |
Malignant transformation analysis |
| Identification of the aberrant gene expression in precancerous and cancerous lesions by comparing the gene expression of stem-like cells in diseased tissues with normal stem cells |
| Entrez ID | Symbol | Replicates | Species | Organ | Tissue | Adj P-value | Log2FC | Malignancy |
| 93183 | PIGM | HTA11_3410_2000001011 | Human | Colorectum | AD | 6.00e-08 | 1.93e-01 | 0.0155 |
| 93183 | PIGM | HTA11_2487_2000001011 | Human | Colorectum | SER | 7.05e-06 | 1.89e-01 | -0.1808 |
| 93183 | PIGM | HTA11_1938_2000001011 | Human | Colorectum | AD | 3.43e-08 | 2.65e-01 | -0.0811 |
| 93183 | PIGM | HTA11_78_2000001011 | Human | Colorectum | AD | 2.54e-12 | 3.32e-01 | -0.1088 |
| 93183 | PIGM | HTA11_347_2000001011 | Human | Colorectum | AD | 2.45e-20 | 4.03e-01 | -0.1954 |
| 93183 | PIGM | HTA11_3361_2000001011 | Human | Colorectum | AD | 1.34e-03 | 2.02e-01 | -0.1207 |
| 93183 | PIGM | HTA11_696_2000001011 | Human | Colorectum | AD | 1.96e-10 | 2.05e-01 | -0.1464 |
| 93183 | PIGM | HTA11_866_2000001011 | Human | Colorectum | AD | 9.04e-05 | 1.31e-01 | -0.1001 |
| 93183 | PIGM | HTA11_1391_2000001011 | Human | Colorectum | AD | 2.86e-09 | 2.38e-01 | -0.059 |
| 93183 | PIGM | HTA11_7862_2000001011 | Human | Colorectum | AD | 7.36e-06 | 2.52e-01 | -0.0179 |
| 93183 | PIGM | HTA11_866_3004761011 | Human | Colorectum | AD | 9.05e-12 | 2.55e-01 | 0.096 |
| 93183 | PIGM | HTA11_8622_2000001021 | Human | Colorectum | SER | 4.45e-03 | 1.83e-01 | 0.0528 |
| 93183 | PIGM | HTA11_10623_2000001011 | Human | Colorectum | AD | 6.46e-07 | 3.00e-01 | -0.0177 |
| 93183 | PIGM | HTA11_10711_2000001011 | Human | Colorectum | AD | 7.11e-07 | 2.02e-01 | 0.0338 |
| 93183 | PIGM | HTA11_7696_3000711011 | Human | Colorectum | AD | 3.52e-13 | 2.41e-01 | 0.0674 |
| 93183 | PIGM | HTA11_7469_2000001011 | Human | Colorectum | AD | 1.45e-04 | 3.33e-01 | -0.0124 |
| 93183 | PIGM | HTA11_6818_2000001021 | Human | Colorectum | AD | 1.54e-06 | 2.42e-01 | 0.0588 |
| 93183 | PIGM | HTA11_99999970781_79442 | Human | Colorectum | MSS | 1.15e-20 | 3.70e-01 | 0.294 |
| 93183 | PIGM | HTA11_99999965062_69753 | Human | Colorectum | MSI-H | 3.42e-04 | 4.33e-01 | 0.3487 |
| 93183 | PIGM | HTA11_99999965104_69814 | Human | Colorectum | MSS | 7.13e-20 | 5.64e-01 | 0.281 |
| Page: 1 2 3 4 5 |
| Tissue | Expression Dynamics | Abbreviation |
| Colorectum (GSE201348) |  | FAP: Familial adenomatous polyposis |
| CRC: Colorectal cancer | ||
| Colorectum (HTA11) |  | AD: Adenomas |
| SER: Sessile serrated lesions | ||
| MSI-H: Microsatellite-high colorectal cancer | ||
| MSS: Microsatellite stable colorectal cancer | ||
| Esophagus |  | ESCC: Esophageal squamous cell carcinoma |
| HGIN: High-grade intraepithelial neoplasias | ||
| LGIN: Low-grade intraepithelial neoplasias | ||
| Liver | 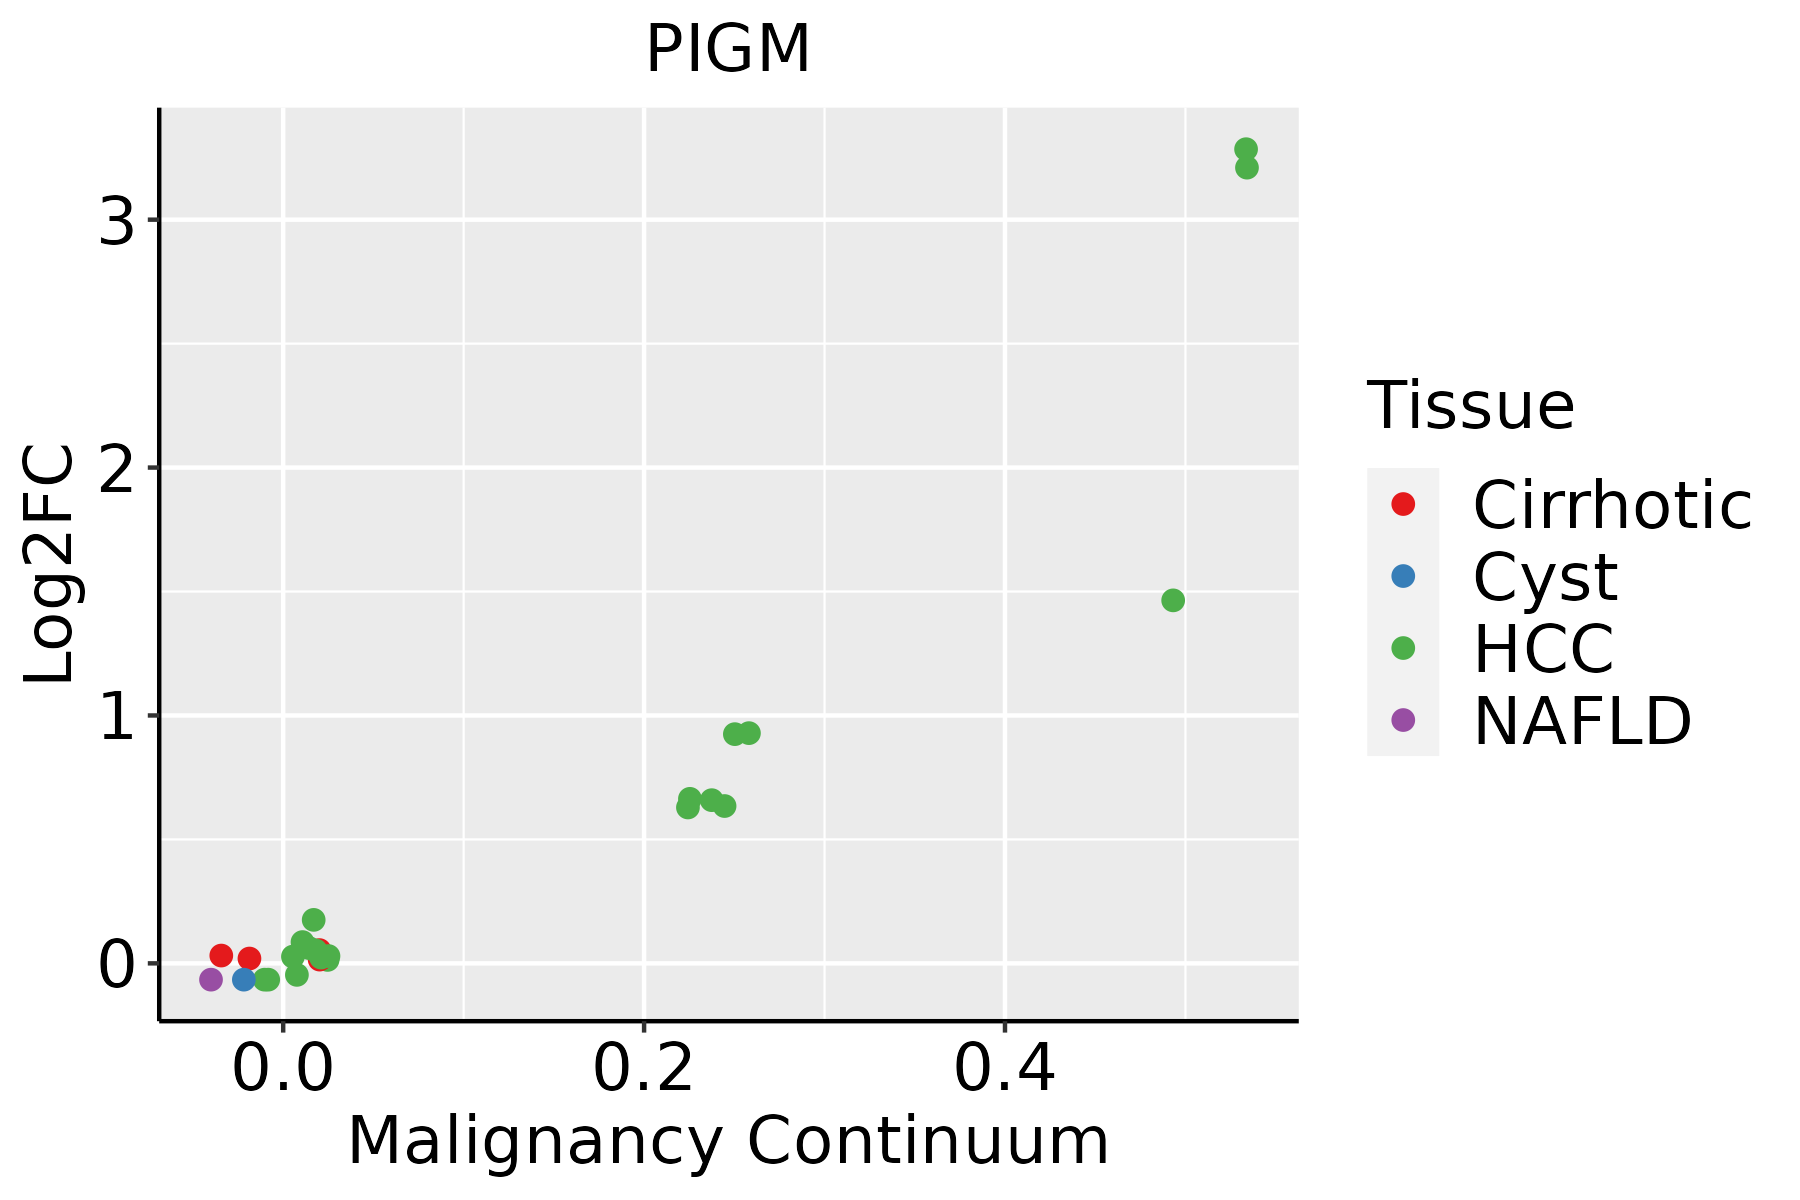 | HCC: Hepatocellular carcinoma |
| NAFLD: Non-alcoholic fatty liver disease | ||
| Prostate | 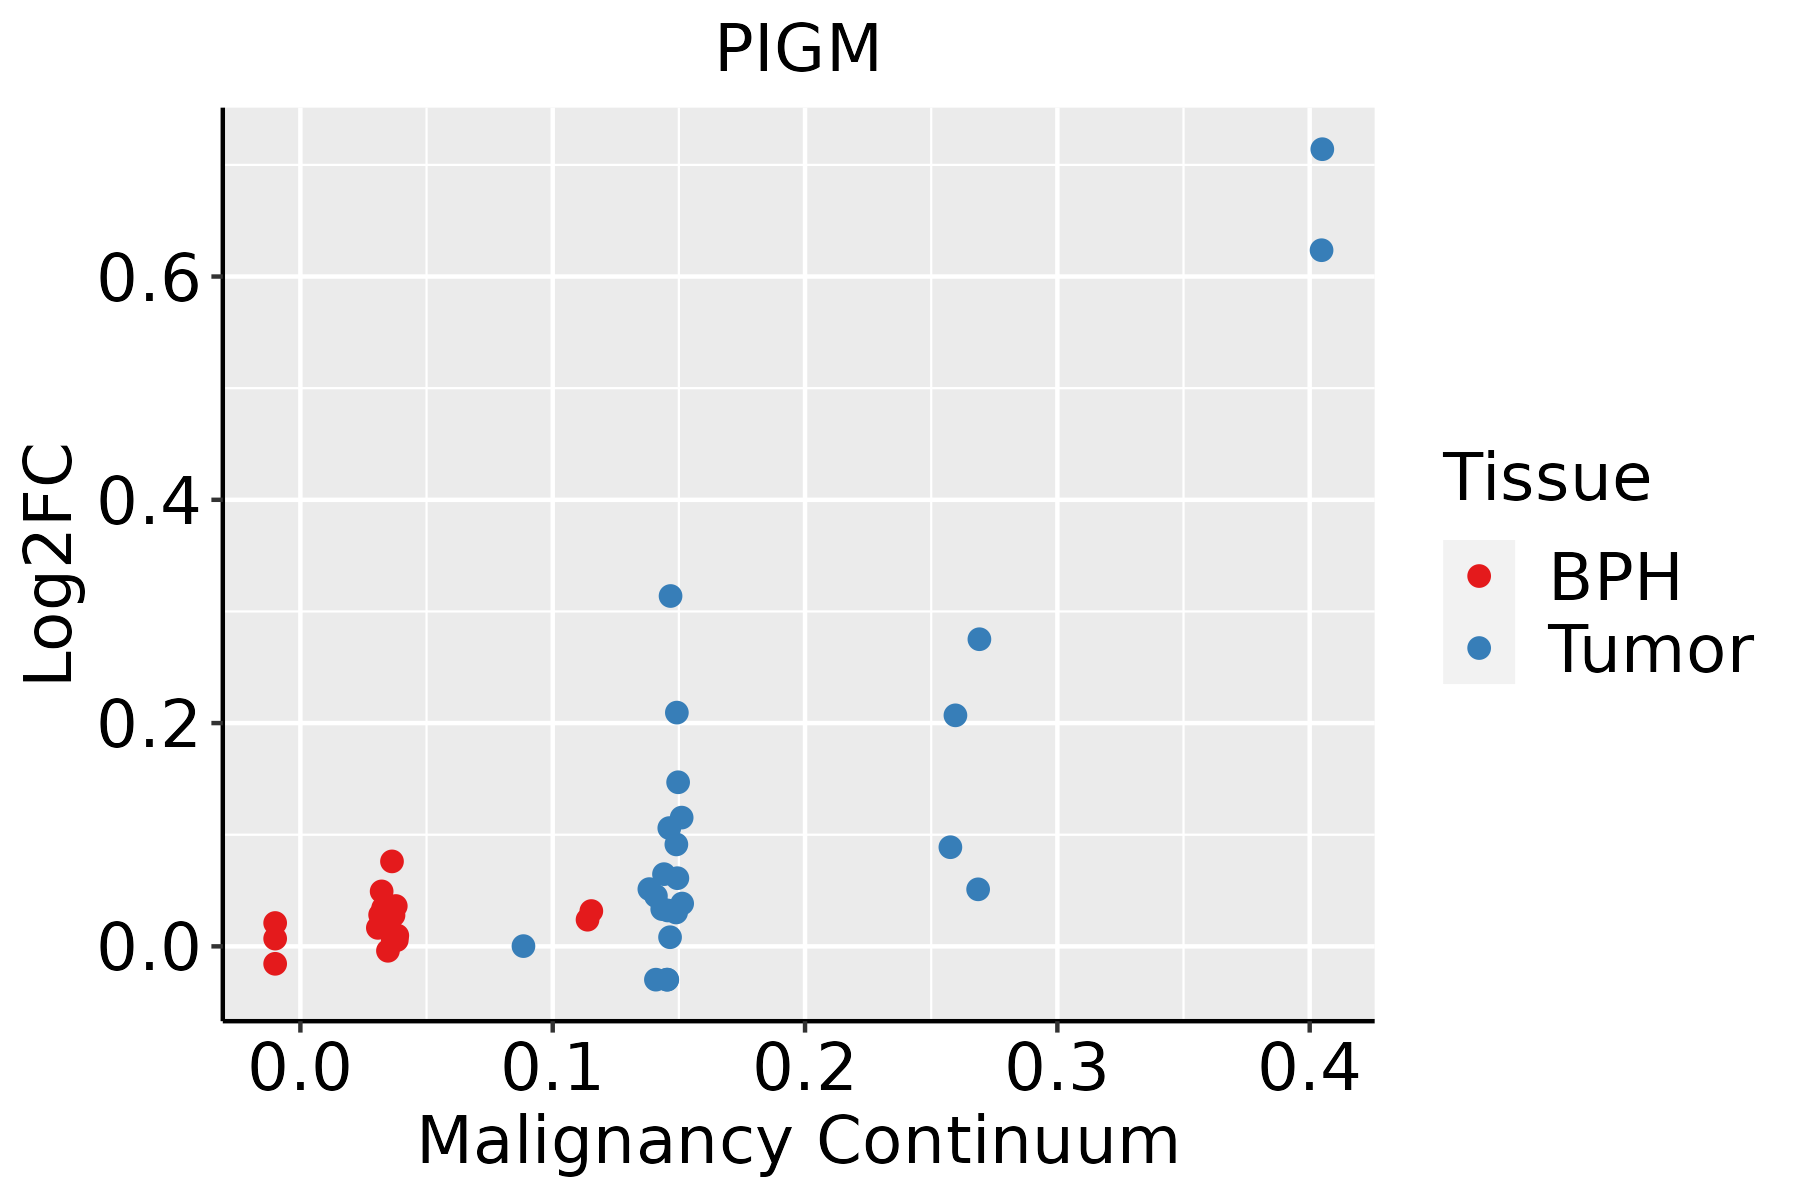 | BPH: Benign Prostatic Hyperplasia |
| ∗log2FC in expression of this searched gene in stem-like cells from each diseased tissue sample relative to stem-like cells in normal samples in each tissue plotted against the malignancy continuum. Samples are colored based on if they are from different disease stage. |
Top |
Malignant transformation related pathway analysis |
| Find out the enriched GO biological processes and KEGG pathways involved in transition from healthy to precancer to cancer |
| Tissue | Disease Stage | Enriched GO biological Processes |
| Colorectum | AD |  |
| Colorectum | SER |  |
| Colorectum | MSS |  |
| Colorectum | MSI-H |  |
| Colorectum | FAP |  |
| ∗Top 15 enriched GO BP terms are showed in the bar plot of each disease state in each tissue. Each row represents a significant GO biological process which is colored according to the -log10(p.adjust). |
| Page: 1 2 3 4 5 6 7 8 9 |
| GO ID | Tissue | Disease Stage | Description | Gene Ratio | Bg Ratio | pvalue | p.adjust | Count |
| GO:0006650 | Colorectum | AD | glycerophospholipid metabolic process | 83/3918 | 306/18723 | 5.40e-03 | 3.55e-02 | 83 |
| GO:0070085 | Colorectum | AD | glycosylation | 67/3918 | 240/18723 | 5.78e-03 | 3.67e-02 | 67 |
| GO:0006644 | Colorectum | AD | phospholipid metabolic process | 101/3918 | 383/18723 | 5.80e-03 | 3.67e-02 | 101 |
| GO:0045017 | Colorectum | AD | glycerolipid biosynthetic process | 69/3918 | 252/18723 | 8.33e-03 | 4.88e-02 | 69 |
| GO:0046486 | Colorectum | SER | glycerolipid metabolic process | 82/2897 | 392/18723 | 2.26e-03 | 2.17e-02 | 82 |
| GO:00066441 | Colorectum | SER | phospholipid metabolic process | 79/2897 | 383/18723 | 3.94e-03 | 3.24e-02 | 79 |
| GO:00450171 | Colorectum | SER | glycerolipid biosynthetic process | 55/2897 | 252/18723 | 4.47e-03 | 3.56e-02 | 55 |
| GO:00066501 | Colorectum | SER | glycerophospholipid metabolic process | 64/2897 | 306/18723 | 6.41e-03 | 4.60e-02 | 64 |
| GO:00086544 | Esophagus | ESCC | phospholipid biosynthetic process | 162/8552 | 253/18723 | 2.59e-09 | 5.73e-08 | 162 |
| GO:00464744 | Esophagus | ESCC | glycerophospholipid biosynthetic process | 135/8552 | 211/18723 | 5.75e-08 | 1.02e-06 | 135 |
| GO:00066433 | Esophagus | ESCC | membrane lipid metabolic process | 130/8552 | 203/18723 | 9.29e-08 | 1.54e-06 | 130 |
| GO:00450175 | Esophagus | ESCC | glycerolipid biosynthetic process | 154/8552 | 252/18723 | 5.20e-07 | 6.96e-06 | 154 |
| GO:00700854 | Esophagus | ESCC | glycosylation | 144/8552 | 240/18723 | 5.12e-06 | 5.38e-05 | 144 |
| GO:00066446 | Esophagus | ESCC | phospholipid metabolic process | 218/8552 | 383/18723 | 5.37e-06 | 5.59e-05 | 218 |
| GO:00464673 | Esophagus | ESCC | membrane lipid biosynthetic process | 91/8552 | 142/18723 | 7.19e-06 | 7.19e-05 | 91 |
| GO:00421573 | Esophagus | ESCC | lipoprotein metabolic process | 86/8552 | 135/18723 | 1.78e-05 | 1.57e-04 | 86 |
| GO:00064973 | Esophagus | ESCC | protein lipidation | 62/8552 | 92/18723 | 2.08e-05 | 1.80e-04 | 62 |
| GO:00421583 | Esophagus | ESCC | lipoprotein biosynthetic process | 64/8552 | 96/18723 | 2.61e-05 | 2.20e-04 | 64 |
| GO:00065063 | Esophagus | ESCC | GPI anchor biosynthetic process | 26/8552 | 32/18723 | 3.97e-05 | 3.21e-04 | 26 |
| GO:00066505 | Esophagus | ESCC | glycerophospholipid metabolic process | 174/8552 | 306/18723 | 4.92e-05 | 3.85e-04 | 174 |
| Page: 1 2 3 |
| Pathway ID | Tissue | Disease Stage | Description | Gene Ratio | Bg Ratio | pvalue | p.adjust | qvalue | Count |
| hsa005632 | Esophagus | ESCC | Glycosylphosphatidylinositol (GPI)-anchor biosynthesis | 21/4205 | 26/8465 | 1.10e-03 | 3.42e-03 | 1.75e-03 | 21 |
| hsa0056311 | Esophagus | ESCC | Glycosylphosphatidylinositol (GPI)-anchor biosynthesis | 21/4205 | 26/8465 | 1.10e-03 | 3.42e-03 | 1.75e-03 | 21 |
| hsa00563 | Liver | HCC | Glycosylphosphatidylinositol (GPI)-anchor biosynthesis | 18/4020 | 26/8465 | 2.08e-02 | 4.81e-02 | 2.68e-02 | 18 |
| hsa005631 | Liver | HCC | Glycosylphosphatidylinositol (GPI)-anchor biosynthesis | 18/4020 | 26/8465 | 2.08e-02 | 4.81e-02 | 2.68e-02 | 18 |
| Page: 1 |
Top |
Cell-cell communication analysis |
| Identification of potential cell-cell interactions between two cell types and their ligand-receptor pairs for different disease states |
| Ligand | Receptor | LRpair | Pathway | Tissue | Disease Stage |
| Page: 1 |
Top |
Single-cell gene regulatory network inference analysis |
| Find out the significant the regulons (TFs) and the target genes of each regulon across cell types for different disease states |
| TF | Cell Type | Tissue | Disease Stage | Target Gene | RSS | Regulon Activity |
| ∗The dot plots of a searched regulon are shown for all cell subpopulations in each disease state of each tissue based on the regulon specific score inferred using pySCENIC and by calculating the average expression. |
| Page: 1 |
Top |
Somatic mutation of malignant transformation related genes |
| Annotation of somatic variants for genes involved in malignant transformation |
| Hugo Symbol | Variant Class | Variant Classification | dbSNP RS | HGVSc | HGVSp | HGVSp Short | SWISSPROT | BIOTYPE | SIFT | PolyPhen | Tumor Sample Barcode | Tissue | Histology | Sex | Age | Stage | Therapy Types | Drugs | Outcome |
| PIGM | SNV | Missense_Mutation | novel | c.212N>C | p.Arg71Thr | p.R71T | Q9H3S5 | protein_coding | deleterious(0) | probably_damaging(0.992) | TCGA-B6-A3ZX-01 | Breast | breast invasive carcinoma | Female | <65 | III/IV | Chemotherapy | cyclophosphamide | PD |
| PIGM | SNV | Missense_Mutation | rs756019403 | c.825N>G | p.Phe275Leu | p.F275L | Q9H3S5 | protein_coding | deleterious(0) | probably_damaging(1) | TCGA-EW-A1PB-01 | Breast | breast invasive carcinoma | Female | >=65 | III/IV | Unknown | Unknown | SD |
| PIGM | deletion | Frame_Shift_Del | novel | c.536delT | p.Met179ArgfsTer6 | p.M179Rfs*6 | Q9H3S5 | protein_coding | TCGA-EW-A2FV-01 | Breast | breast invasive carcinoma | Female | <65 | III/IV | Chemotherapy | docetaxel | SD | ||
| PIGM | SNV | Missense_Mutation | c.1268A>G | p.Asp423Gly | p.D423G | Q9H3S5 | protein_coding | deleterious_low_confidence(0.01) | benign(0.307) | TCGA-FU-A3HZ-01 | Cervix | cervical & endocervical cancer | Female | <65 | I/II | Chemotherapy | cisplatin | CR | |
| PIGM | SNV | Missense_Mutation | novel | c.188N>G | p.Thr63Arg | p.T63R | Q9H3S5 | protein_coding | deleterious(0.02) | benign(0.037) | TCGA-MA-AA43-01 | Cervix | cervical & endocervical cancer | Female | <65 | III/IV | Unknown | Unknown | SD |
| PIGM | SNV | Missense_Mutation | c.292N>G | p.Leu98Val | p.L98V | Q9H3S5 | protein_coding | tolerated(0.1) | benign(0.127) | TCGA-ZJ-AAXU-01 | Cervix | cervical & endocervical cancer | Female | <65 | I/II | Unknown | Unknown | SD | |
| PIGM | insertion | In_Frame_Ins | novel | c.299_300insAGAATA | p.Ile100_Ser101insGluTyr | p.I100_S101insEY | Q9H3S5 | protein_coding | TCGA-DS-A1OB-01 | Cervix | cervical & endocervical cancer | Female | <65 | I/II | Chemotherapy | carboplatin | PD | ||
| PIGM | SNV | Missense_Mutation | novel | c.1152N>A | p.Asn384Lys | p.N384K | Q9H3S5 | protein_coding | deleterious(0) | probably_damaging(0.984) | TCGA-AA-A01P-01 | Colorectum | colon adenocarcinoma | Female | >=65 | III/IV | Unknown | Unknown | PD |
| PIGM | SNV | Missense_Mutation | rs758854084 | c.292N>A | p.Leu98Ile | p.L98I | Q9H3S5 | protein_coding | tolerated(0.13) | benign(0.223) | TCGA-CA-6718-01 | Colorectum | colon adenocarcinoma | Male | <65 | I/II | Unknown | Unknown | PD |
| PIGM | SNV | Missense_Mutation | c.587N>T | p.Pro196Leu | p.P196L | Q9H3S5 | protein_coding | tolerated(0.13) | benign(0) | TCGA-G4-6293-01 | Colorectum | colon adenocarcinoma | Female | <65 | III/IV | Chemotherapy | fluorouracil | SD |
| Page: 1 2 3 4 |
Top |
Related drugs of malignant transformation related genes |
| Identification of chemicals and drugs interact with genes involved in malignant transfromation |
| (DGIdb 4.0) |
| Entrez ID | Symbol | Category | Interaction Types | Drug Claim Name | Drug Name | PMIDs |
| 93183 | PIGM | NA | methylphenidate | METHYLPHENIDATE | 29382897 |
| Page: 1 |

Copyright 2023-Present -The University of Texas Health Science Center at Houston |