
|
|||||
|
 | |
| |
| |
| |
| |
| |
|
Gene: PIGK |
Gene summary for PIGK |
| Gene information | Species | Human | Gene symbol | PIGK | Gene ID | 10026 |
| Gene name | phosphatidylinositol glycan anchor biosynthesis class K | |
| Gene Alias | GPI8 | |
| Cytomap | 1p31.1 | |
| Gene Type | protein-coding | GO ID | GO:0006464 | UniProtAcc | Q92643 |
Top |
Malignant transformation analysis |
| Identification of the aberrant gene expression in precancerous and cancerous lesions by comparing the gene expression of stem-like cells in diseased tissues with normal stem cells |
| Entrez ID | Symbol | Replicates | Species | Organ | Tissue | Adj P-value | Log2FC | Malignancy |
| 10026 | PIGK | HTA11_347_2000001011 | Human | Colorectum | AD | 3.08e-02 | 3.17e-01 | -0.1954 |
| 10026 | PIGK | HTA11_866_3004761011 | Human | Colorectum | AD | 1.13e-03 | 1.42e-01 | 0.096 |
| 10026 | PIGK | A015-C-104 | Human | Colorectum | FAP | 7.83e-04 | -1.50e-01 | -0.1899 |
| 10026 | PIGK | LZE8T | Human | Esophagus | ESCC | 5.78e-04 | 9.10e-02 | 0.067 |
| 10026 | PIGK | LZE24T | Human | Esophagus | ESCC | 4.40e-05 | 7.77e-02 | 0.0596 |
| 10026 | PIGK | P2T-E | Human | Esophagus | ESCC | 6.26e-22 | 2.60e-01 | 0.1177 |
| 10026 | PIGK | P4T-E | Human | Esophagus | ESCC | 1.14e-07 | 2.02e-01 | 0.1323 |
| 10026 | PIGK | P5T-E | Human | Esophagus | ESCC | 2.08e-07 | 1.45e-01 | 0.1327 |
| 10026 | PIGK | P8T-E | Human | Esophagus | ESCC | 1.20e-10 | 1.92e-01 | 0.0889 |
| 10026 | PIGK | P9T-E | Human | Esophagus | ESCC | 1.11e-04 | 4.32e-02 | 0.1131 |
| 10026 | PIGK | P10T-E | Human | Esophagus | ESCC | 2.07e-16 | 1.84e-01 | 0.116 |
| 10026 | PIGK | P11T-E | Human | Esophagus | ESCC | 8.27e-11 | 3.37e-01 | 0.1426 |
| 10026 | PIGK | P12T-E | Human | Esophagus | ESCC | 1.66e-20 | 2.13e-01 | 0.1122 |
| 10026 | PIGK | P15T-E | Human | Esophagus | ESCC | 1.16e-06 | 2.14e-01 | 0.1149 |
| 10026 | PIGK | P16T-E | Human | Esophagus | ESCC | 1.09e-12 | 1.94e-01 | 0.1153 |
| 10026 | PIGK | P17T-E | Human | Esophagus | ESCC | 6.67e-06 | 2.50e-01 | 0.1278 |
| 10026 | PIGK | P19T-E | Human | Esophagus | ESCC | 3.23e-06 | 5.07e-01 | 0.1662 |
| 10026 | PIGK | P20T-E | Human | Esophagus | ESCC | 2.63e-09 | 1.91e-01 | 0.1124 |
| 10026 | PIGK | P21T-E | Human | Esophagus | ESCC | 3.50e-14 | 2.68e-01 | 0.1617 |
| 10026 | PIGK | P22T-E | Human | Esophagus | ESCC | 1.18e-03 | 1.59e-02 | 0.1236 |
| Page: 1 2 3 4 5 |
| Tissue | Expression Dynamics | Abbreviation |
| Colorectum (GSE201348) |  | FAP: Familial adenomatous polyposis |
| CRC: Colorectal cancer | ||
| Colorectum (HTA11) | 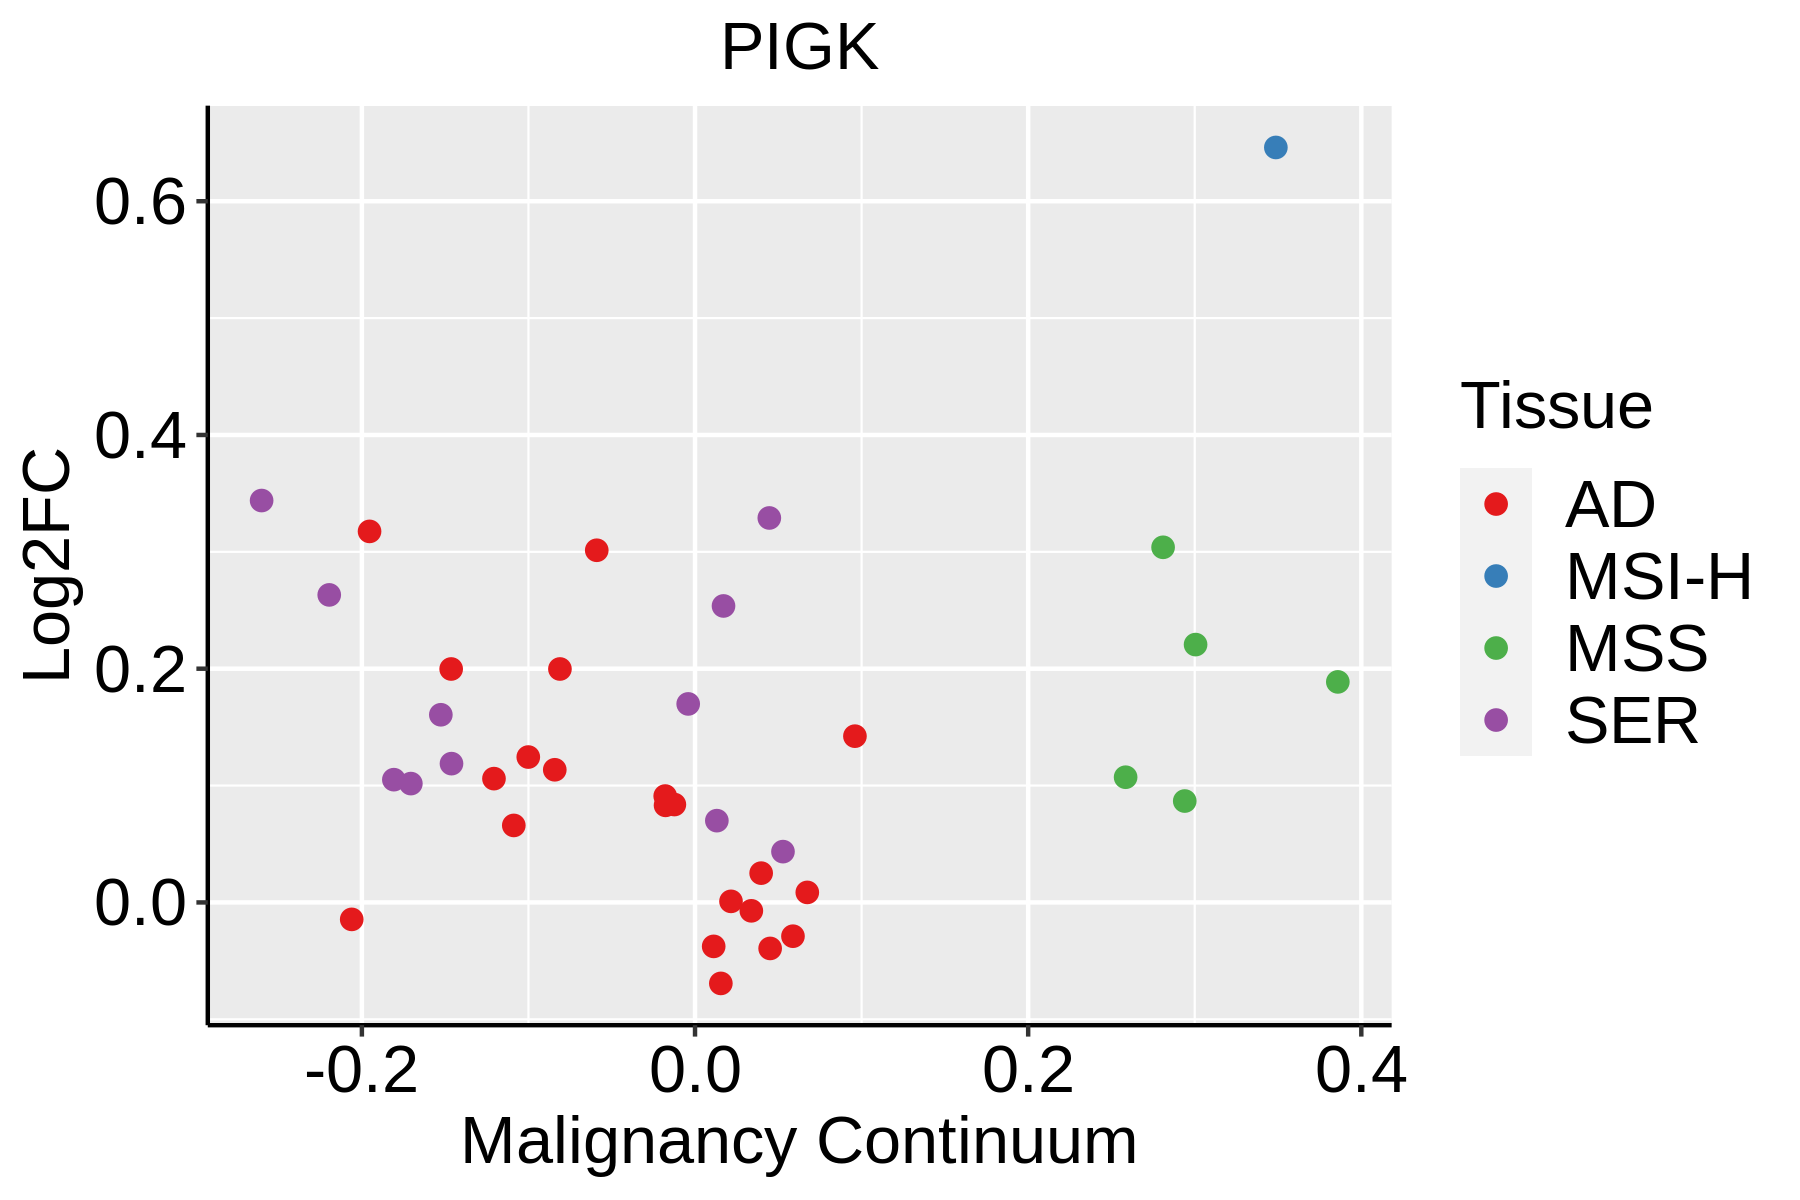 | AD: Adenomas |
| SER: Sessile serrated lesions | ||
| MSI-H: Microsatellite-high colorectal cancer | ||
| MSS: Microsatellite stable colorectal cancer | ||
| Esophagus | 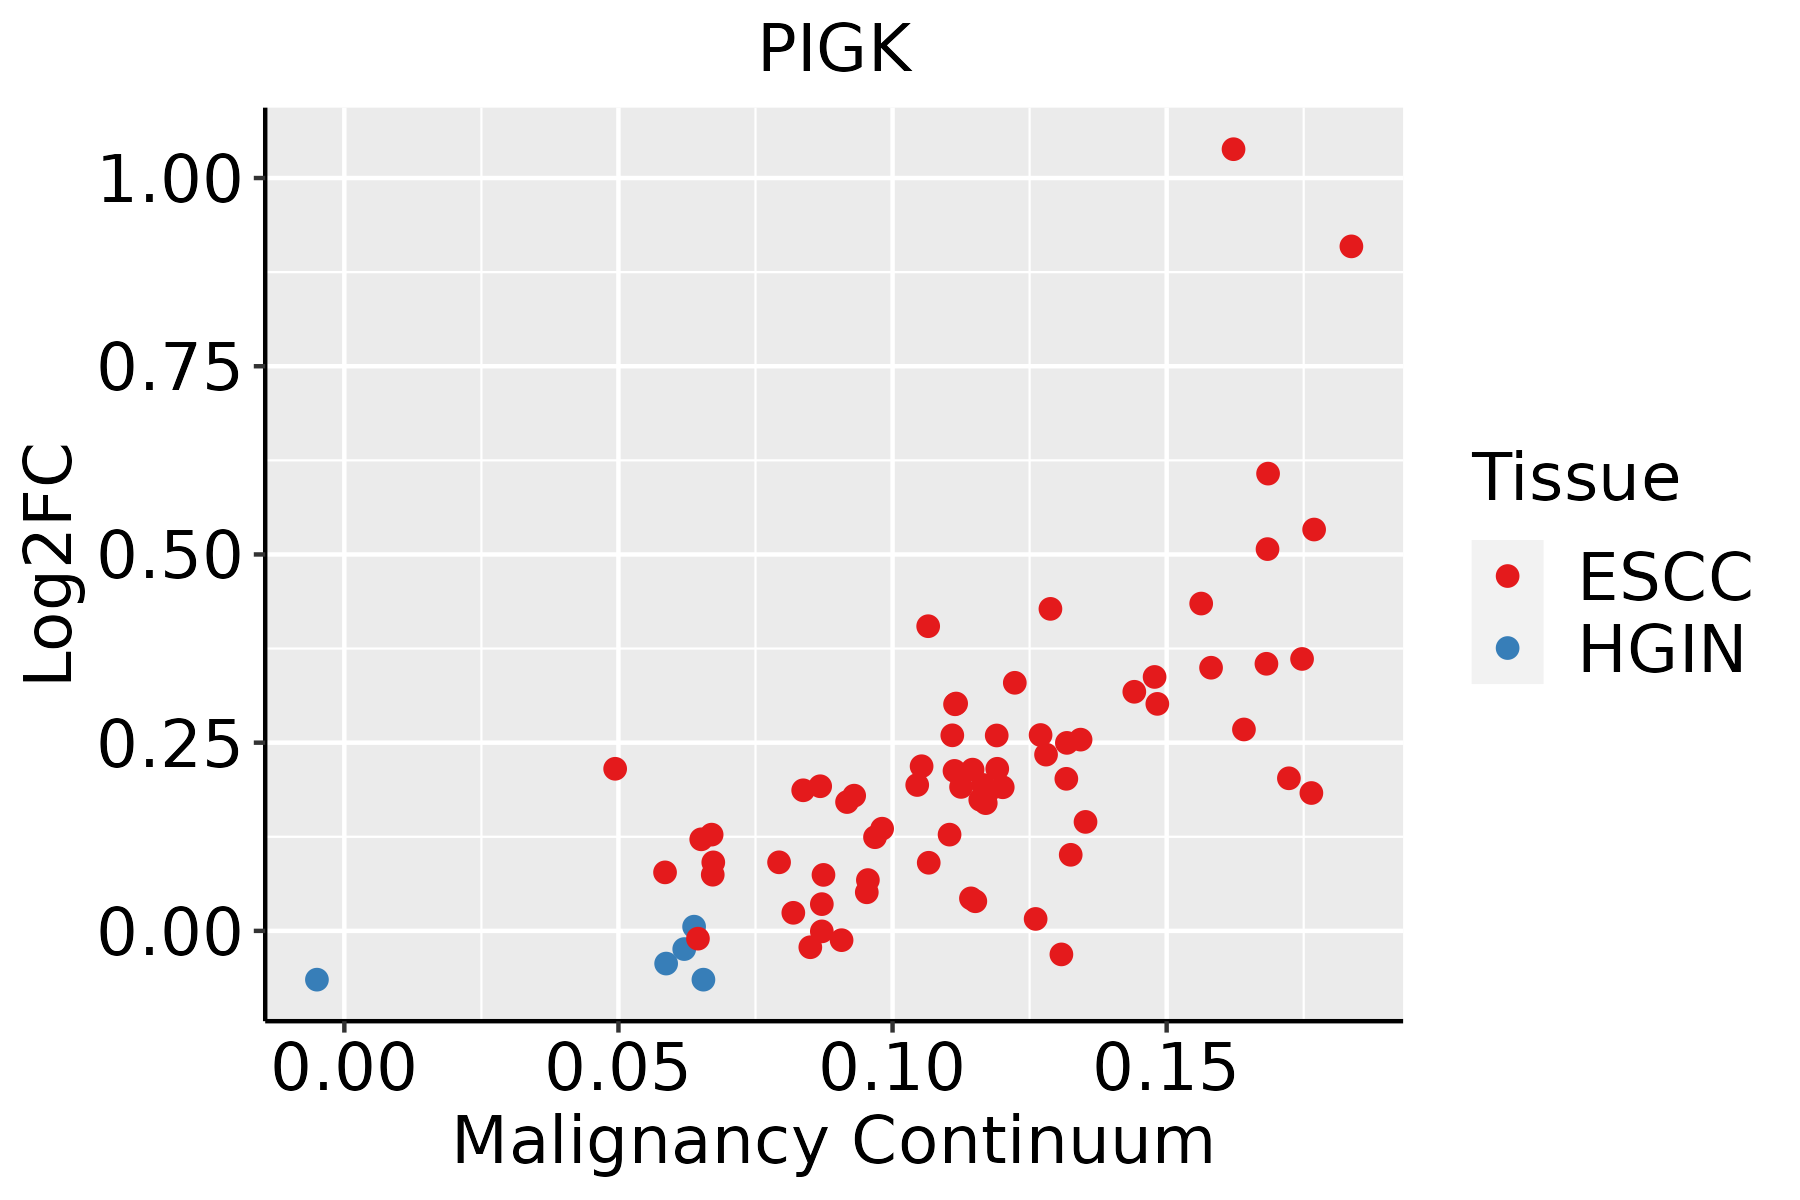 | ESCC: Esophageal squamous cell carcinoma |
| HGIN: High-grade intraepithelial neoplasias | ||
| LGIN: Low-grade intraepithelial neoplasias | ||
| Liver |  | HCC: Hepatocellular carcinoma |
| NAFLD: Non-alcoholic fatty liver disease | ||
| Oral Cavity | 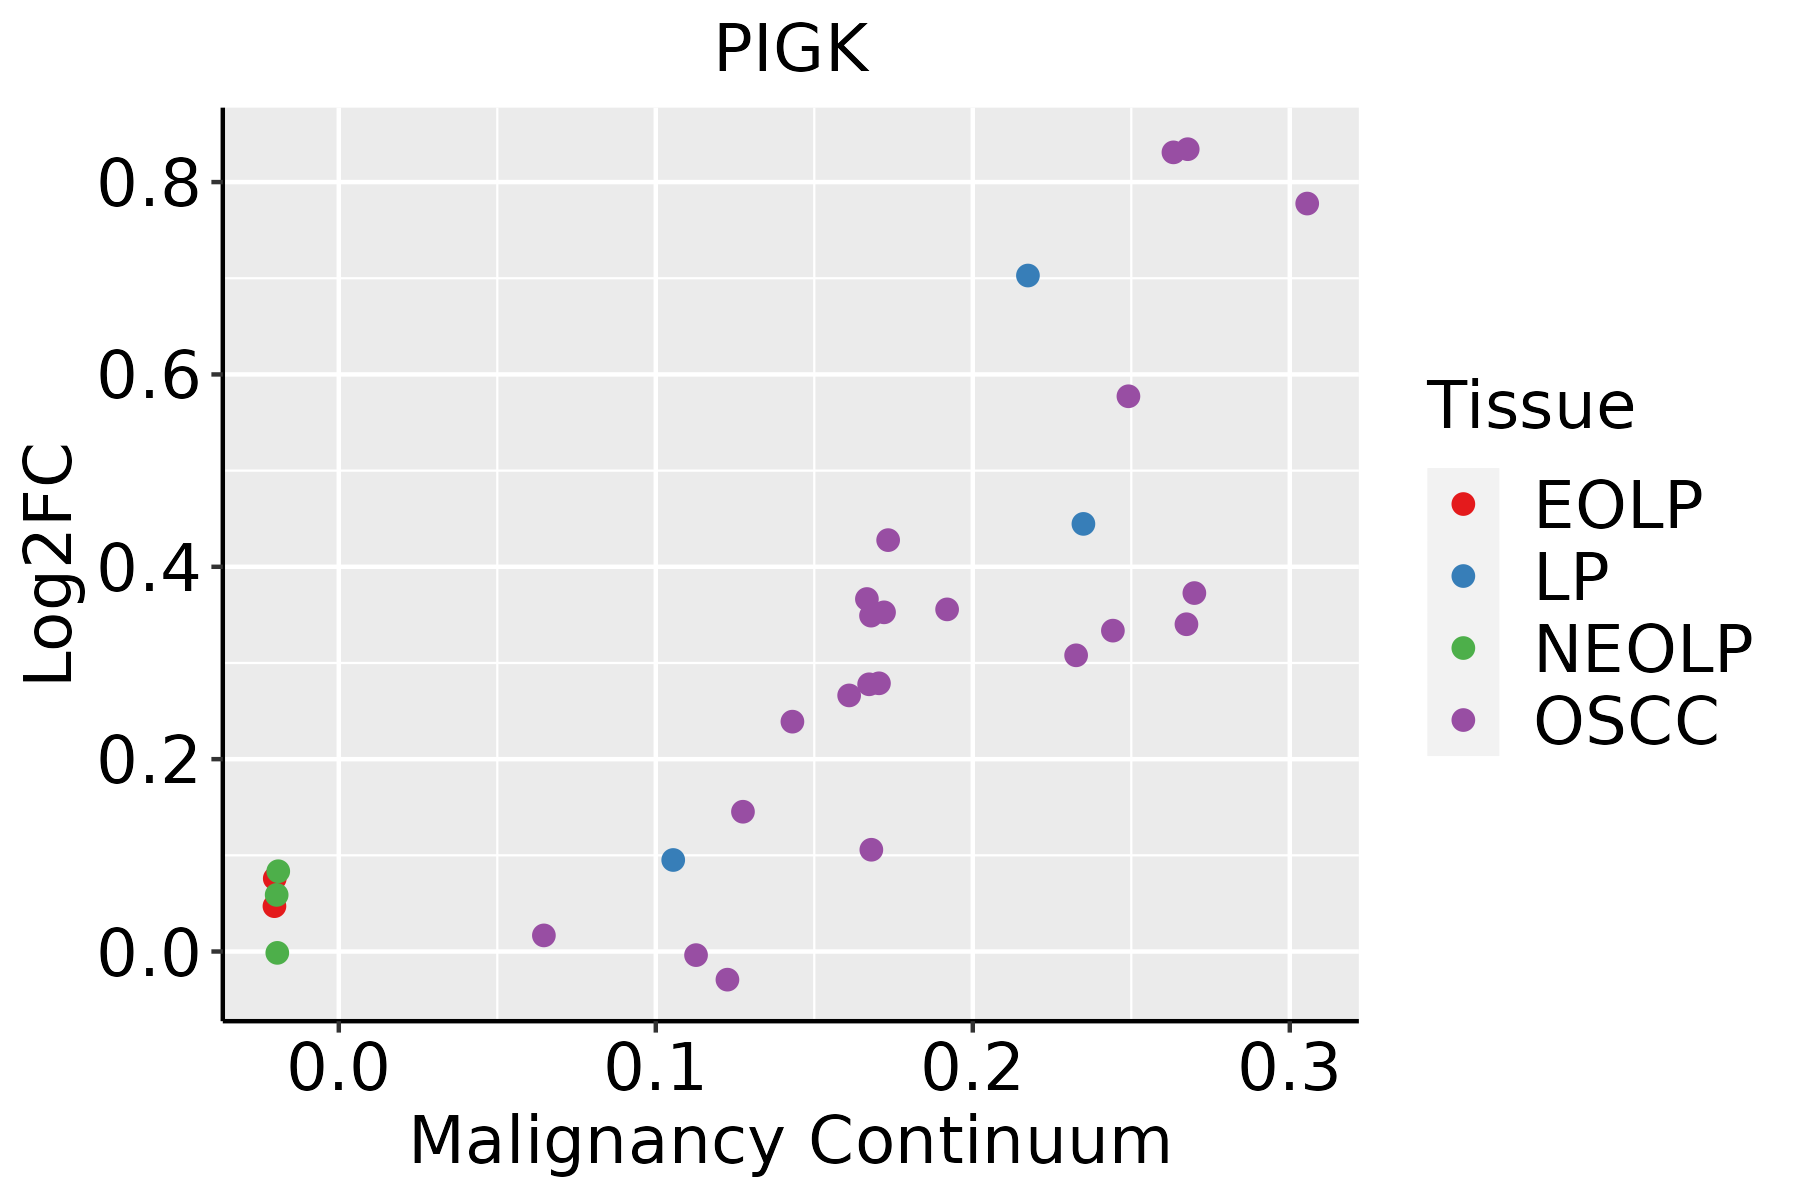 | EOLP: Erosive Oral lichen planus |
| LP: leukoplakia | ||
| NEOLP: Non-erosive oral lichen planus | ||
| OSCC: Oral squamous cell carcinoma | ||
| Skin | 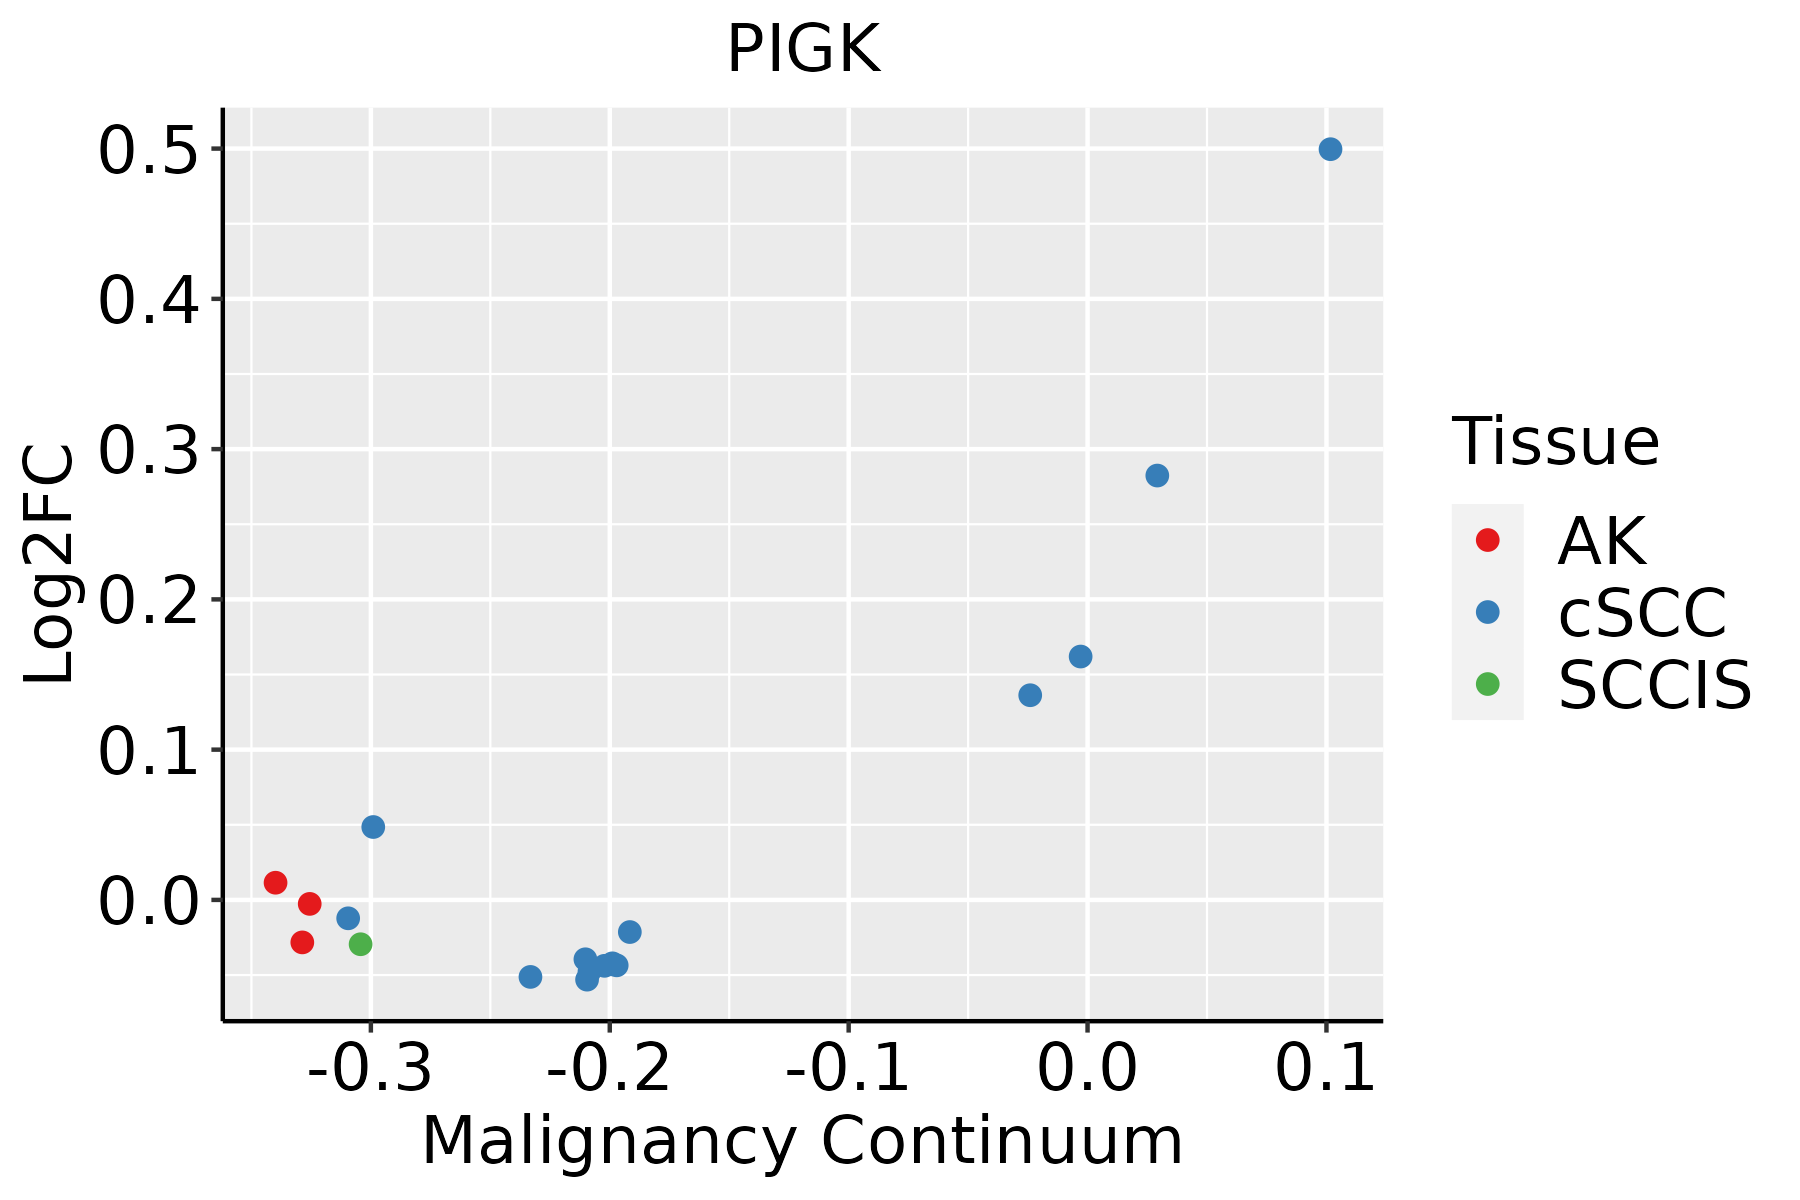 | AK: Actinic keratosis |
| cSCC: Cutaneous squamous cell carcinoma | ||
| SCCIS:squamous cell carcinoma in situ |
| ∗log2FC in expression of this searched gene in stem-like cells from each diseased tissue sample relative to stem-like cells in normal samples in each tissue plotted against the malignancy continuum. Samples are colored based on if they are from different disease stage. |
Top |
Malignant transformation related pathway analysis |
| Find out the enriched GO biological processes and KEGG pathways involved in transition from healthy to precancer to cancer |
| Tissue | Disease Stage | Enriched GO biological Processes |
| Colorectum | AD |  |
| Colorectum | SER |  |
| Colorectum | MSS |  |
| Colorectum | MSI-H |  |
| Colorectum | FAP |  |
| ∗Top 15 enriched GO BP terms are showed in the bar plot of each disease state in each tissue. Each row represents a significant GO biological process which is colored according to the -log10(p.adjust). |
| Page: 1 2 3 4 5 6 7 8 9 |
| GO ID | Tissue | Disease Stage | Description | Gene Ratio | Bg Ratio | pvalue | p.adjust | Count |
| GO:0034394 | Colorectum | AD | protein localization to cell surface | 24/3918 | 68/18723 | 4.33e-03 | 2.97e-02 | 24 |
| GO:0006650 | Colorectum | AD | glycerophospholipid metabolic process | 83/3918 | 306/18723 | 5.40e-03 | 3.55e-02 | 83 |
| GO:0006644 | Colorectum | AD | phospholipid metabolic process | 101/3918 | 383/18723 | 5.80e-03 | 3.67e-02 | 101 |
| GO:0045017 | Colorectum | AD | glycerolipid biosynthetic process | 69/3918 | 252/18723 | 8.33e-03 | 4.88e-02 | 69 |
| GO:0008654 | Colorectum | FAP | phospholipid biosynthetic process | 54/2622 | 253/18723 | 8.88e-04 | 9.08e-03 | 54 |
| GO:00066502 | Colorectum | FAP | glycerophospholipid metabolic process | 62/2622 | 306/18723 | 1.54e-03 | 1.38e-02 | 62 |
| GO:00066442 | Colorectum | FAP | phospholipid metabolic process | 74/2622 | 383/18723 | 2.24e-03 | 1.83e-02 | 74 |
| GO:0046474 | Colorectum | FAP | glycerophospholipid biosynthetic process | 44/2622 | 211/18723 | 3.98e-03 | 2.76e-02 | 44 |
| GO:00450172 | Colorectum | FAP | glycerolipid biosynthetic process | 50/2622 | 252/18723 | 6.32e-03 | 3.95e-02 | 50 |
| GO:00086544 | Esophagus | ESCC | phospholipid biosynthetic process | 162/8552 | 253/18723 | 2.59e-09 | 5.73e-08 | 162 |
| GO:00464744 | Esophagus | ESCC | glycerophospholipid biosynthetic process | 135/8552 | 211/18723 | 5.75e-08 | 1.02e-06 | 135 |
| GO:00066433 | Esophagus | ESCC | membrane lipid metabolic process | 130/8552 | 203/18723 | 9.29e-08 | 1.54e-06 | 130 |
| GO:00450175 | Esophagus | ESCC | glycerolipid biosynthetic process | 154/8552 | 252/18723 | 5.20e-07 | 6.96e-06 | 154 |
| GO:00066446 | Esophagus | ESCC | phospholipid metabolic process | 218/8552 | 383/18723 | 5.37e-06 | 5.59e-05 | 218 |
| GO:00464673 | Esophagus | ESCC | membrane lipid biosynthetic process | 91/8552 | 142/18723 | 7.19e-06 | 7.19e-05 | 91 |
| GO:00421573 | Esophagus | ESCC | lipoprotein metabolic process | 86/8552 | 135/18723 | 1.78e-05 | 1.57e-04 | 86 |
| GO:00064973 | Esophagus | ESCC | protein lipidation | 62/8552 | 92/18723 | 2.08e-05 | 1.80e-04 | 62 |
| GO:00421583 | Esophagus | ESCC | lipoprotein biosynthetic process | 64/8552 | 96/18723 | 2.61e-05 | 2.20e-04 | 64 |
| GO:00065063 | Esophagus | ESCC | GPI anchor biosynthetic process | 26/8552 | 32/18723 | 3.97e-05 | 3.21e-04 | 26 |
| GO:00066505 | Esophagus | ESCC | glycerophospholipid metabolic process | 174/8552 | 306/18723 | 4.92e-05 | 3.85e-04 | 174 |
| Page: 1 2 3 4 |
| Pathway ID | Tissue | Disease Stage | Description | Gene Ratio | Bg Ratio | pvalue | p.adjust | qvalue | Count |
| hsa005632 | Esophagus | ESCC | Glycosylphosphatidylinositol (GPI)-anchor biosynthesis | 21/4205 | 26/8465 | 1.10e-03 | 3.42e-03 | 1.75e-03 | 21 |
| hsa0056311 | Esophagus | ESCC | Glycosylphosphatidylinositol (GPI)-anchor biosynthesis | 21/4205 | 26/8465 | 1.10e-03 | 3.42e-03 | 1.75e-03 | 21 |
| hsa00563 | Liver | HCC | Glycosylphosphatidylinositol (GPI)-anchor biosynthesis | 18/4020 | 26/8465 | 2.08e-02 | 4.81e-02 | 2.68e-02 | 18 |
| hsa005631 | Liver | HCC | Glycosylphosphatidylinositol (GPI)-anchor biosynthesis | 18/4020 | 26/8465 | 2.08e-02 | 4.81e-02 | 2.68e-02 | 18 |
| Page: 1 |
Top |
Cell-cell communication analysis |
| Identification of potential cell-cell interactions between two cell types and their ligand-receptor pairs for different disease states |
| Ligand | Receptor | LRpair | Pathway | Tissue | Disease Stage |
| Page: 1 |
Top |
Single-cell gene regulatory network inference analysis |
| Find out the significant the regulons (TFs) and the target genes of each regulon across cell types for different disease states |
| TF | Cell Type | Tissue | Disease Stage | Target Gene | RSS | Regulon Activity |
| ∗The dot plots of a searched regulon are shown for all cell subpopulations in each disease state of each tissue based on the regulon specific score inferred using pySCENIC and by calculating the average expression. |
| Page: 1 |
Top |
Somatic mutation of malignant transformation related genes |
| Annotation of somatic variants for genes involved in malignant transformation |
| Hugo Symbol | Variant Class | Variant Classification | dbSNP RS | HGVSc | HGVSp | HGVSp Short | SWISSPROT | BIOTYPE | SIFT | PolyPhen | Tumor Sample Barcode | Tissue | Histology | Sex | Age | Stage | Therapy Types | Drugs | Outcome |
| PIGK | insertion | In_Frame_Ins | novel | c.688_689insCTATAATTCAACACATAAAAC | p.Glu230delinsAlaIleIleGlnHisIleLysGln | p.E230delinsAIIQHIKQ | Q92643 | protein_coding | TCGA-AR-A0TU-01 | Breast | breast invasive carcinoma | Female | <65 | I/II | Unspecific | Doxorubicin | SD | ||
| PIGK | SNV | Missense_Mutation | novel | c.892N>A | p.Val298Ile | p.V298I | Q92643 | protein_coding | tolerated(0.06) | benign(0.201) | TCGA-C5-A907-01 | Cervix | cervical & endocervical cancer | Female | <65 | I/II | Chemotherapy | cisplatin | SD |
| PIGK | SNV | Missense_Mutation | novel | c.686N>C | p.Gly229Ala | p.G229A | Q92643 | protein_coding | deleterious(0) | possibly_damaging(0.908) | TCGA-JW-A5VL-01 | Cervix | cervical & endocervical cancer | Female | <65 | I/II | Unknown | Unknown | SD |
| PIGK | SNV | Missense_Mutation | rs565004204 | c.860G>A | p.Arg287His | p.R287H | Q92643 | protein_coding | deleterious(0) | probably_damaging(0.996) | TCGA-MA-AA42-01 | Cervix | cervical & endocervical cancer | Female | >=65 | I/II | Unknown | Unknown | SD |
| PIGK | SNV | Missense_Mutation | rs755599930 | c.387G>T | p.Glu129Asp | p.E129D | Q92643 | protein_coding | deleterious(0.01) | possibly_damaging(0.477) | TCGA-AA-3510-01 | Colorectum | colon adenocarcinoma | Male | >=65 | I/II | Unknown | Unknown | SD |
| PIGK | SNV | Missense_Mutation | rs146489857 | c.161G>A | p.Arg54Gln | p.R54Q | Q92643 | protein_coding | deleterious(0) | probably_damaging(0.99) | TCGA-AA-3864-01 | Colorectum | colon adenocarcinoma | Male | >=65 | I/II | Unknown | Unknown | SD |
| PIGK | SNV | Missense_Mutation | c.329T>G | p.Leu110Arg | p.L110R | Q92643 | protein_coding | deleterious(0) | benign(0.411) | TCGA-AA-3977-01 | Colorectum | colon adenocarcinoma | Male | >=65 | I/II | Unknown | Unknown | SD | |
| PIGK | SNV | Missense_Mutation | rs751082508 | c.737N>C | p.Met246Thr | p.M246T | Q92643 | protein_coding | deleterious(0.01) | benign(0.001) | TCGA-AD-6888-01 | Colorectum | colon adenocarcinoma | Male | >=65 | III/IV | Unknown | Unknown | PD |
| PIGK | SNV | Missense_Mutation | c.633N>A | p.Met211Ile | p.M211I | Q92643 | protein_coding | deleterious(0) | possibly_damaging(0.656) | TCGA-D5-6930-01 | Colorectum | colon adenocarcinoma | Male | >=65 | I/II | Unknown | Unknown | SD | |
| PIGK | deletion | Frame_Shift_Del | c.873delN | p.Gln292ArgfsTer8 | p.Q292Rfs*8 | Q92643 | protein_coding | TCGA-AA-3663-01 | Colorectum | colon adenocarcinoma | Male | <65 | I/II | Unknown | Unknown | SD |
| Page: 1 2 3 4 5 |
Top |
Related drugs of malignant transformation related genes |
| Identification of chemicals and drugs interact with genes involved in malignant transfromation |
| (DGIdb 4.0) |
| Entrez ID | Symbol | Category | Interaction Types | Drug Claim Name | Drug Name | PMIDs |
| Page: 1 |

Copyright 2023-Present -The University of Texas Health Science Center at Houston |