
|
|||||
|
 | |
| |
| |
| |
| |
| |
|
Gene: PIGC |
Gene summary for PIGC |
| Gene information | Species | Human | Gene symbol | PIGC | Gene ID | 5279 |
| Gene name | phosphatidylinositol glycan anchor biosynthesis class C | |
| Gene Alias | GPI2 | |
| Cytomap | 1q24.3 | |
| Gene Type | protein-coding | GO ID | GO:0006464 | UniProtAcc | Q92535 |
Top |
Malignant transformation analysis |
| Identification of the aberrant gene expression in precancerous and cancerous lesions by comparing the gene expression of stem-like cells in diseased tissues with normal stem cells |
| Entrez ID | Symbol | Replicates | Species | Organ | Tissue | Adj P-value | Log2FC | Malignancy |
| 5279 | PIGC | LZE2T | Human | Esophagus | ESCC | 5.21e-04 | 6.18e-01 | 0.082 |
| 5279 | PIGC | LZE4T | Human | Esophagus | ESCC | 3.73e-13 | 2.85e-01 | 0.0811 |
| 5279 | PIGC | LZE7T | Human | Esophagus | ESCC | 3.79e-17 | 6.97e-01 | 0.0667 |
| 5279 | PIGC | LZE8T | Human | Esophagus | ESCC | 2.02e-07 | 3.19e-01 | 0.067 |
| 5279 | PIGC | LZE20T | Human | Esophagus | ESCC | 1.03e-04 | 1.63e-01 | 0.0662 |
| 5279 | PIGC | LZE22D1 | Human | Esophagus | HGIN | 7.51e-04 | 2.14e-01 | 0.0595 |
| 5279 | PIGC | LZE22T | Human | Esophagus | ESCC | 4.79e-09 | 6.18e-01 | 0.068 |
| 5279 | PIGC | LZE24T | Human | Esophagus | ESCC | 3.30e-31 | 7.06e-01 | 0.0596 |
| 5279 | PIGC | LZE6T | Human | Esophagus | ESCC | 2.08e-12 | 4.77e-01 | 0.0845 |
| 5279 | PIGC | P1T-E | Human | Esophagus | ESCC | 8.98e-10 | 3.70e-01 | 0.0875 |
| 5279 | PIGC | P2T-E | Human | Esophagus | ESCC | 1.10e-31 | 5.08e-01 | 0.1177 |
| 5279 | PIGC | P4T-E | Human | Esophagus | ESCC | 4.83e-50 | 9.89e-01 | 0.1323 |
| 5279 | PIGC | P5T-E | Human | Esophagus | ESCC | 2.16e-26 | 4.80e-01 | 0.1327 |
| 5279 | PIGC | P8T-E | Human | Esophagus | ESCC | 1.90e-35 | 5.30e-01 | 0.0889 |
| 5279 | PIGC | P9T-E | Human | Esophagus | ESCC | 2.90e-23 | 5.00e-01 | 0.1131 |
| 5279 | PIGC | P10T-E | Human | Esophagus | ESCC | 8.13e-43 | 7.44e-01 | 0.116 |
| 5279 | PIGC | P11T-E | Human | Esophagus | ESCC | 1.18e-15 | 5.42e-01 | 0.1426 |
| 5279 | PIGC | P12T-E | Human | Esophagus | ESCC | 3.13e-30 | 4.24e-01 | 0.1122 |
| 5279 | PIGC | P15T-E | Human | Esophagus | ESCC | 2.94e-28 | 5.44e-01 | 0.1149 |
| 5279 | PIGC | P16T-E | Human | Esophagus | ESCC | 1.25e-51 | 8.52e-01 | 0.1153 |
| Page: 1 2 3 4 5 |
| Tissue | Expression Dynamics | Abbreviation |
| Esophagus | 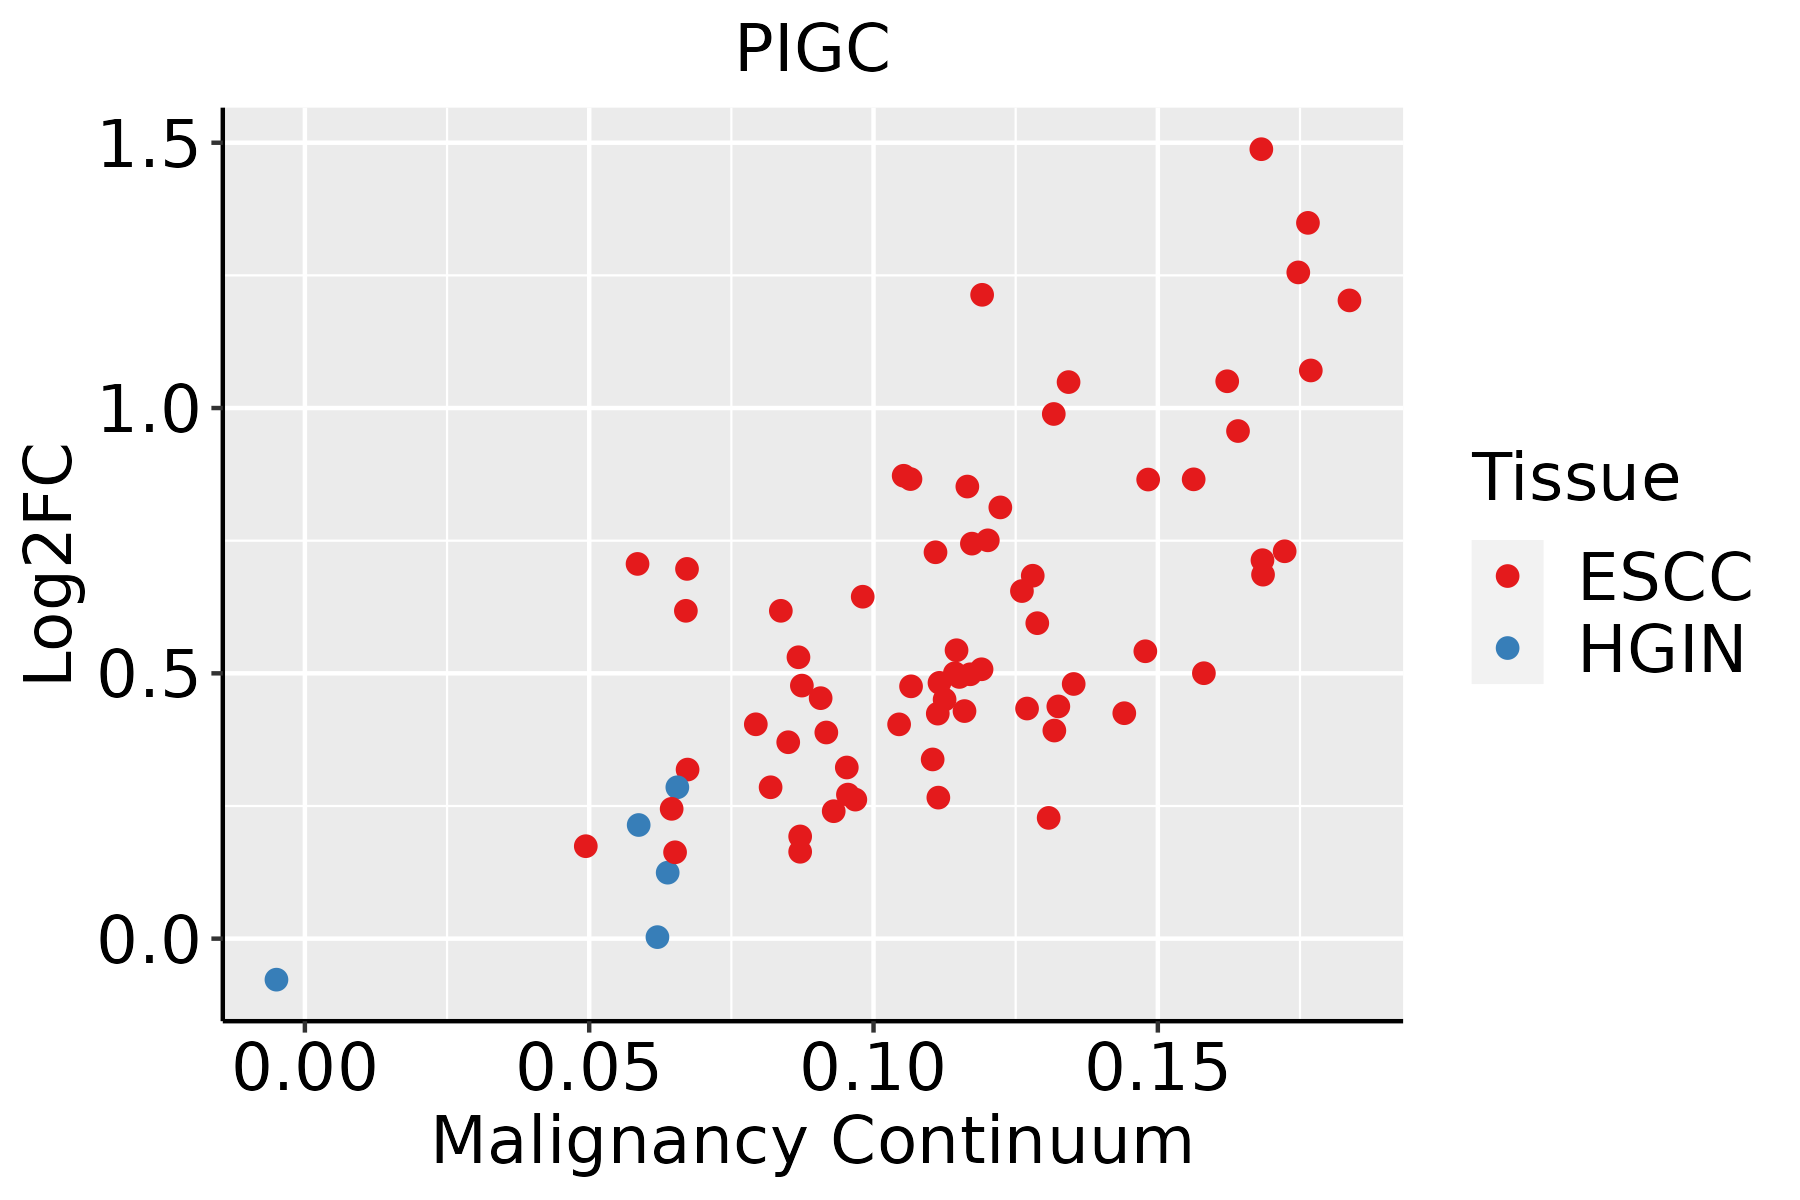 | ESCC: Esophageal squamous cell carcinoma |
| HGIN: High-grade intraepithelial neoplasias | ||
| LGIN: Low-grade intraepithelial neoplasias | ||
| Liver | 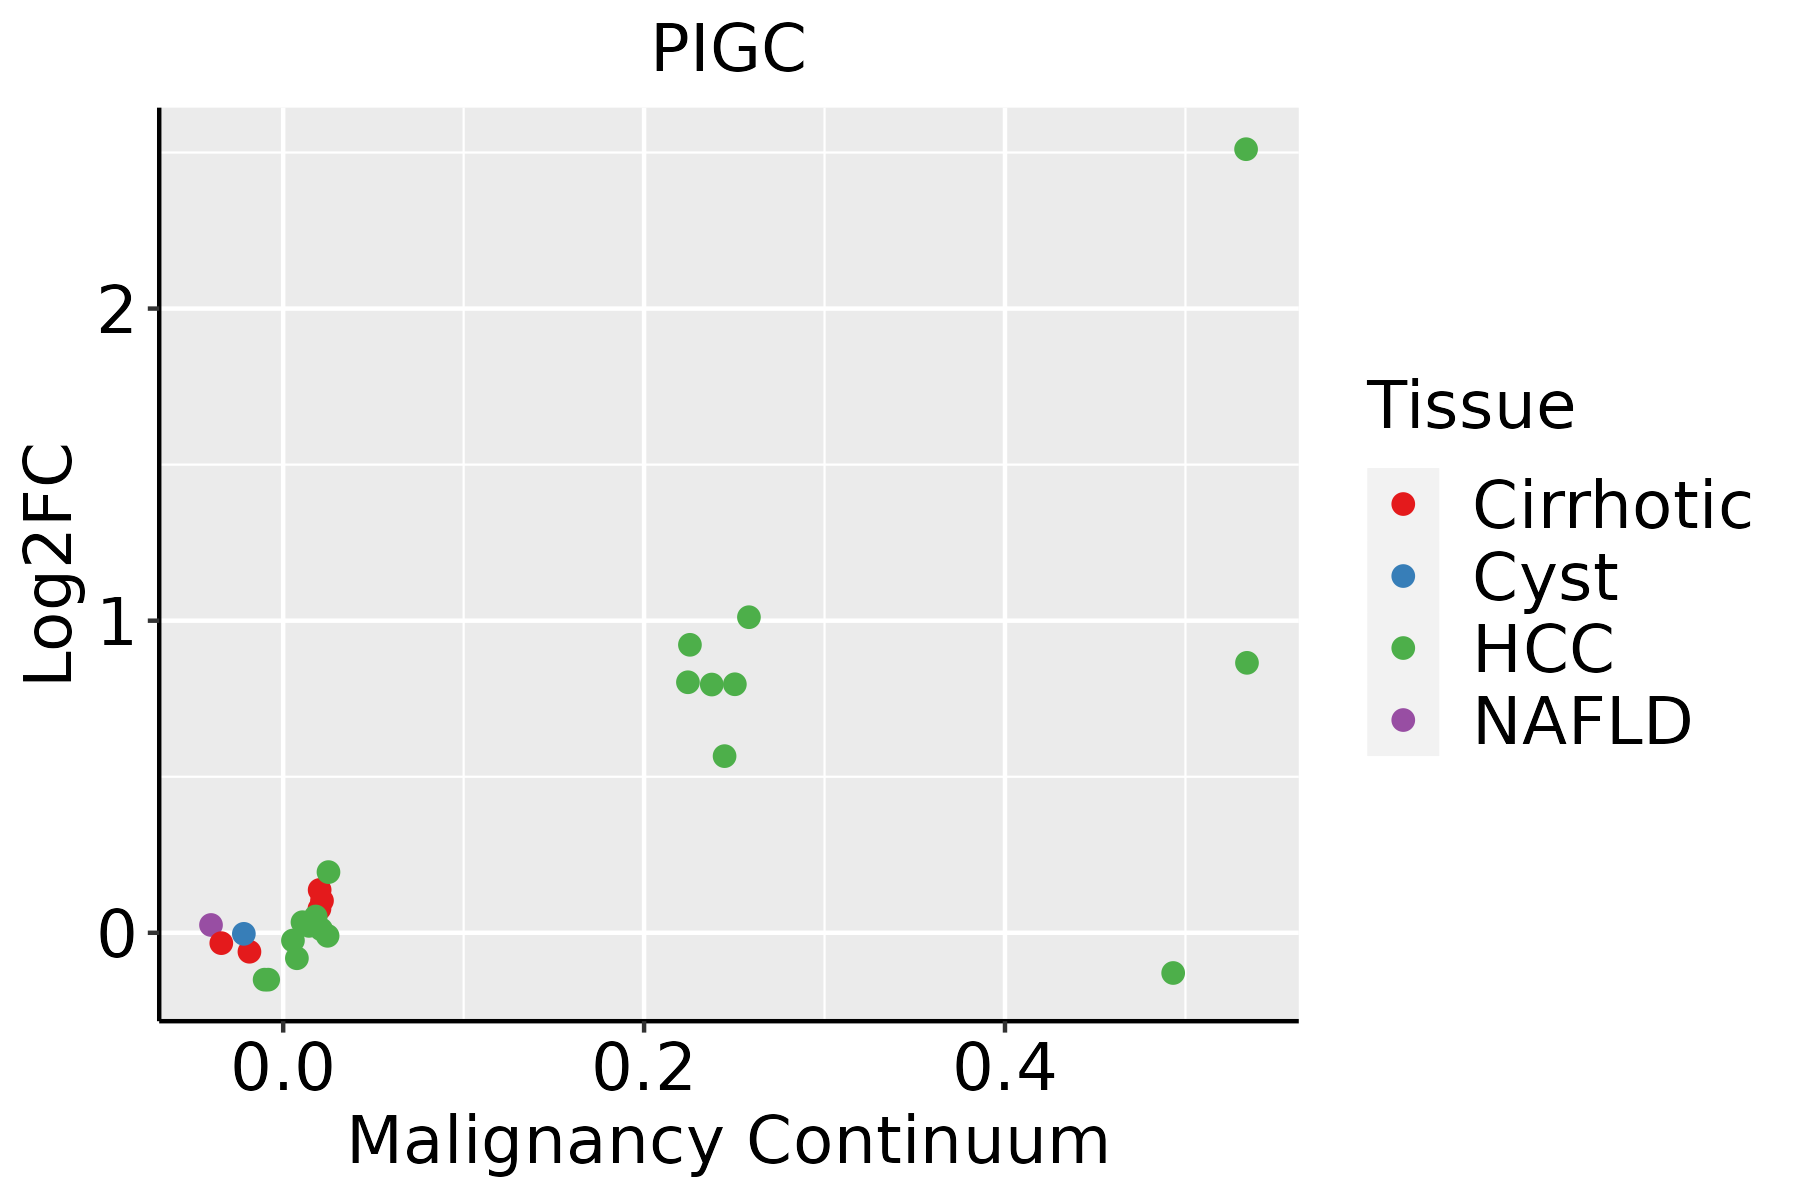 | HCC: Hepatocellular carcinoma |
| NAFLD: Non-alcoholic fatty liver disease | ||
| Oral Cavity | 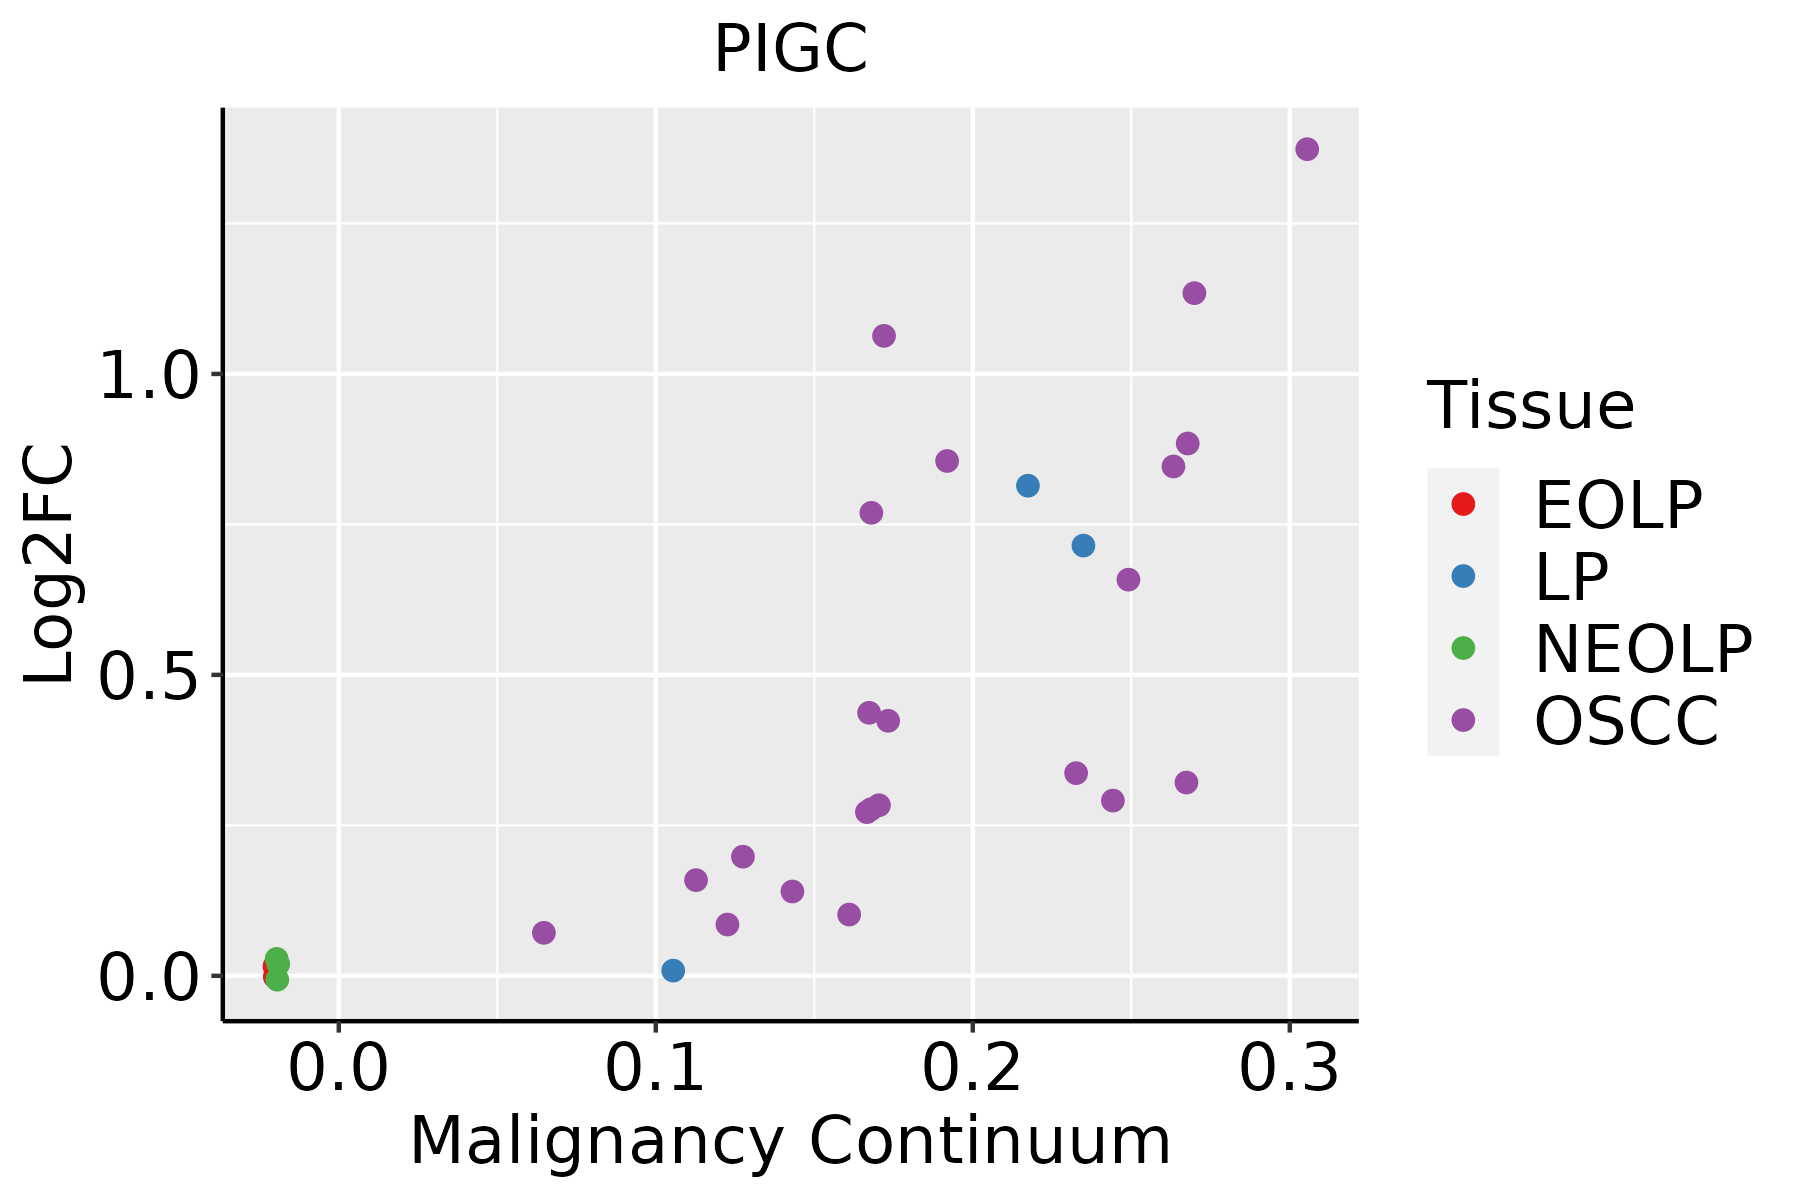 | EOLP: Erosive Oral lichen planus |
| LP: leukoplakia | ||
| NEOLP: Non-erosive oral lichen planus | ||
| OSCC: Oral squamous cell carcinoma | ||
| Prostate | 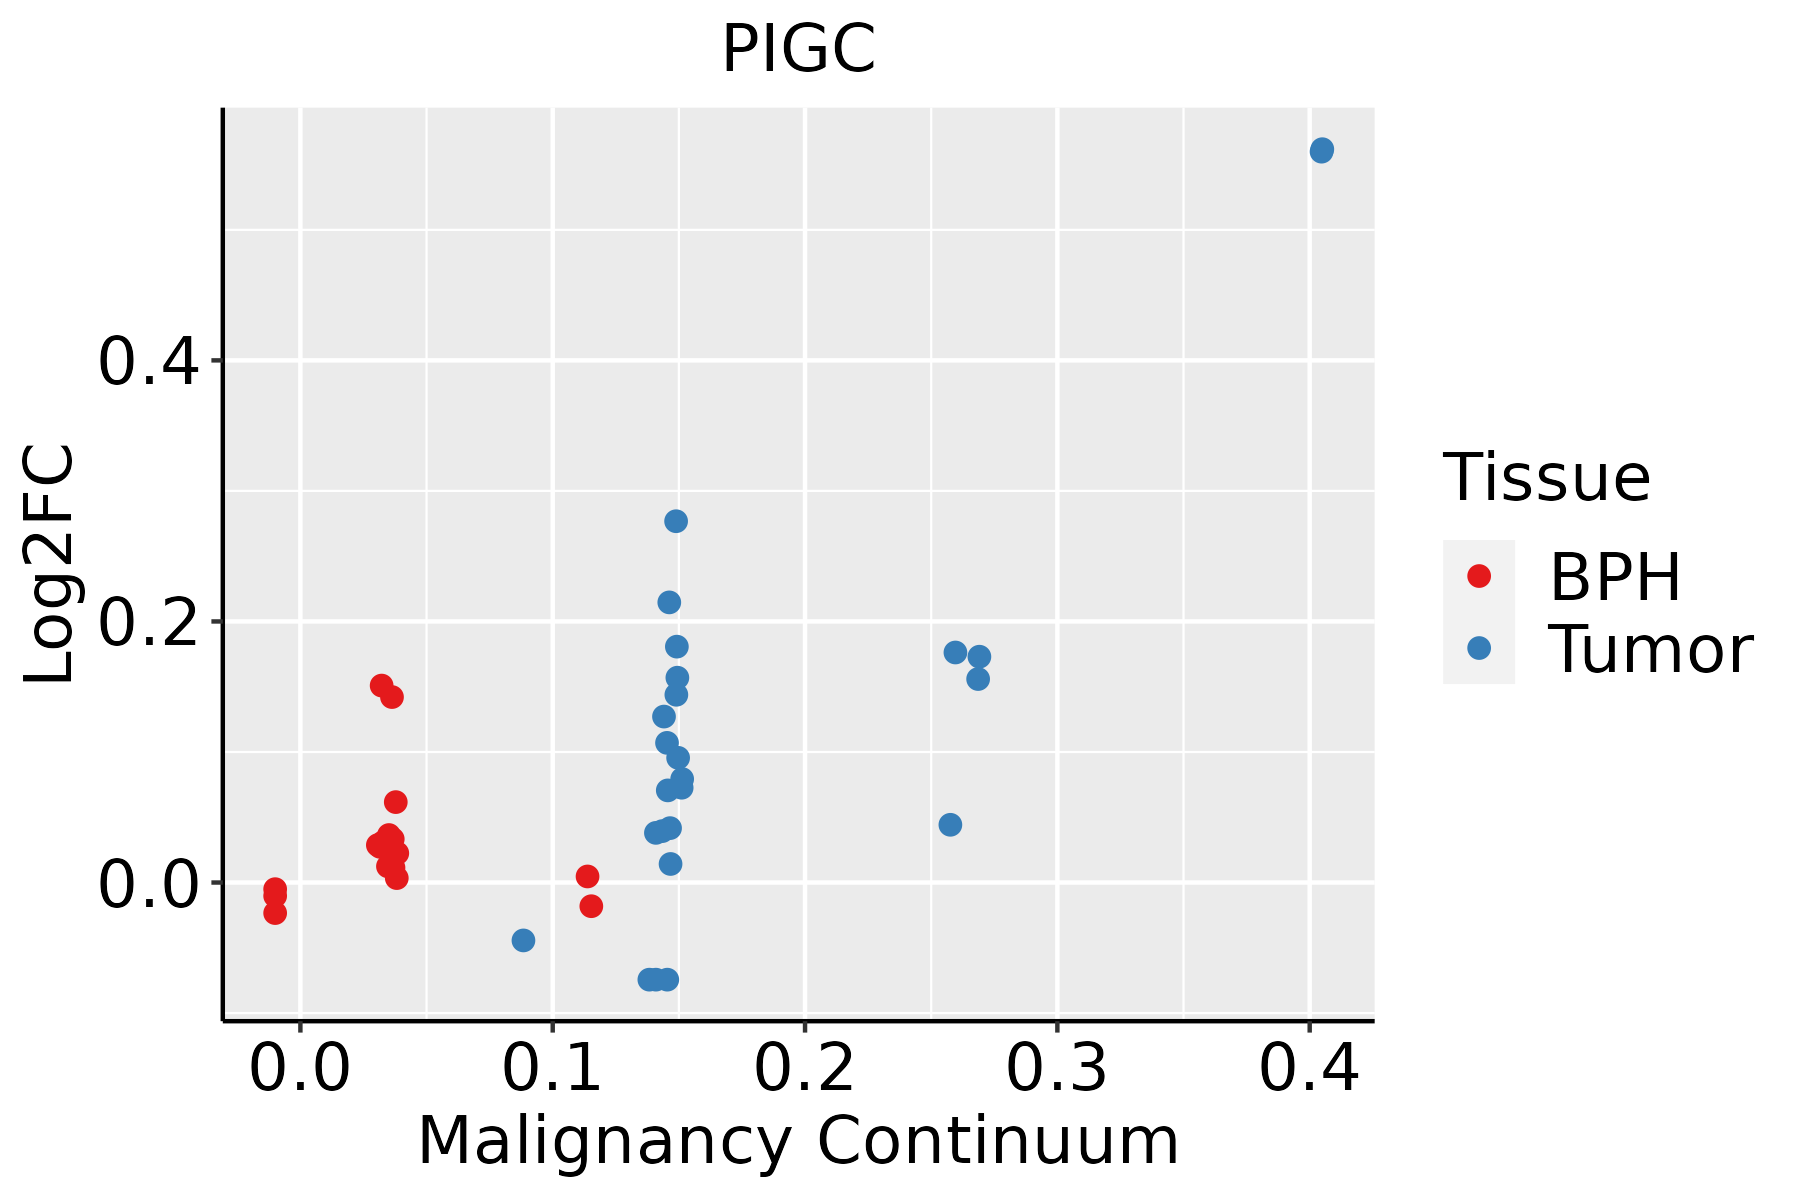 | BPH: Benign Prostatic Hyperplasia |
| ∗log2FC in expression of this searched gene in stem-like cells from each diseased tissue sample relative to stem-like cells in normal samples in each tissue plotted against the malignancy continuum. Samples are colored based on if they are from different disease stage. |
Top |
Malignant transformation related pathway analysis |
| Find out the enriched GO biological processes and KEGG pathways involved in transition from healthy to precancer to cancer |
| Tissue | Disease Stage | Enriched GO biological Processes |
| Colorectum | AD |  |
| Colorectum | SER |  |
| Colorectum | MSS |  |
| Colorectum | MSI-H |  |
| Colorectum | FAP |  |
| ∗Top 15 enriched GO BP terms are showed in the bar plot of each disease state in each tissue. Each row represents a significant GO biological process which is colored according to the -log10(p.adjust). |
| Page: 1 2 3 4 5 6 7 8 9 |
| GO ID | Tissue | Disease Stage | Description | Gene Ratio | Bg Ratio | pvalue | p.adjust | Count |
| GO:00086544 | Esophagus | ESCC | phospholipid biosynthetic process | 162/8552 | 253/18723 | 2.59e-09 | 5.73e-08 | 162 |
| GO:00464744 | Esophagus | ESCC | glycerophospholipid biosynthetic process | 135/8552 | 211/18723 | 5.75e-08 | 1.02e-06 | 135 |
| GO:00066433 | Esophagus | ESCC | membrane lipid metabolic process | 130/8552 | 203/18723 | 9.29e-08 | 1.54e-06 | 130 |
| GO:00450175 | Esophagus | ESCC | glycerolipid biosynthetic process | 154/8552 | 252/18723 | 5.20e-07 | 6.96e-06 | 154 |
| GO:00066446 | Esophagus | ESCC | phospholipid metabolic process | 218/8552 | 383/18723 | 5.37e-06 | 5.59e-05 | 218 |
| GO:00464673 | Esophagus | ESCC | membrane lipid biosynthetic process | 91/8552 | 142/18723 | 7.19e-06 | 7.19e-05 | 91 |
| GO:00421573 | Esophagus | ESCC | lipoprotein metabolic process | 86/8552 | 135/18723 | 1.78e-05 | 1.57e-04 | 86 |
| GO:00064973 | Esophagus | ESCC | protein lipidation | 62/8552 | 92/18723 | 2.08e-05 | 1.80e-04 | 62 |
| GO:00421583 | Esophagus | ESCC | lipoprotein biosynthetic process | 64/8552 | 96/18723 | 2.61e-05 | 2.20e-04 | 64 |
| GO:00065063 | Esophagus | ESCC | GPI anchor biosynthetic process | 26/8552 | 32/18723 | 3.97e-05 | 3.21e-04 | 26 |
| GO:00066505 | Esophagus | ESCC | glycerophospholipid metabolic process | 174/8552 | 306/18723 | 4.92e-05 | 3.85e-04 | 174 |
| GO:00065053 | Esophagus | ESCC | GPI anchor metabolic process | 26/8552 | 33/18723 | 1.06e-04 | 7.43e-04 | 26 |
| GO:00066642 | Esophagus | ESCC | glycolipid metabolic process | 63/8552 | 100/18723 | 3.55e-04 | 2.06e-03 | 63 |
| GO:19035092 | Esophagus | ESCC | liposaccharide metabolic process | 63/8552 | 101/18723 | 5.25e-04 | 2.90e-03 | 63 |
| GO:00464864 | Esophagus | ESCC | glycerolipid metabolic process | 211/8552 | 392/18723 | 6.51e-04 | 3.46e-03 | 211 |
| GO:0009247 | Esophagus | ESCC | glycolipid biosynthetic process | 42/8552 | 68/18723 | 5.48e-03 | 2.05e-02 | 42 |
| GO:00066611 | Esophagus | ESCC | phosphatidylinositol biosynthetic process | 73/8552 | 131/18723 | 1.31e-02 | 4.28e-02 | 73 |
| GO:0042157 | Liver | Cirrhotic | lipoprotein metabolic process | 53/4634 | 135/18723 | 1.32e-04 | 1.29e-03 | 53 |
| GO:0006643 | Liver | Cirrhotic | membrane lipid metabolic process | 69/4634 | 203/18723 | 1.89e-03 | 1.19e-02 | 69 |
| GO:0042158 | Liver | Cirrhotic | lipoprotein biosynthetic process | 36/4634 | 96/18723 | 3.69e-03 | 2.03e-02 | 36 |
| Page: 1 2 3 |
| Pathway ID | Tissue | Disease Stage | Description | Gene Ratio | Bg Ratio | pvalue | p.adjust | qvalue | Count |
| hsa005632 | Esophagus | ESCC | Glycosylphosphatidylinositol (GPI)-anchor biosynthesis | 21/4205 | 26/8465 | 1.10e-03 | 3.42e-03 | 1.75e-03 | 21 |
| hsa0056311 | Esophagus | ESCC | Glycosylphosphatidylinositol (GPI)-anchor biosynthesis | 21/4205 | 26/8465 | 1.10e-03 | 3.42e-03 | 1.75e-03 | 21 |
| hsa00563 | Liver | HCC | Glycosylphosphatidylinositol (GPI)-anchor biosynthesis | 18/4020 | 26/8465 | 2.08e-02 | 4.81e-02 | 2.68e-02 | 18 |
| hsa005631 | Liver | HCC | Glycosylphosphatidylinositol (GPI)-anchor biosynthesis | 18/4020 | 26/8465 | 2.08e-02 | 4.81e-02 | 2.68e-02 | 18 |
| Page: 1 |
Top |
Cell-cell communication analysis |
| Identification of potential cell-cell interactions between two cell types and their ligand-receptor pairs for different disease states |
| Ligand | Receptor | LRpair | Pathway | Tissue | Disease Stage |
| Page: 1 |
Top |
Single-cell gene regulatory network inference analysis |
| Find out the significant the regulons (TFs) and the target genes of each regulon across cell types for different disease states |
| TF | Cell Type | Tissue | Disease Stage | Target Gene | RSS | Regulon Activity |
| ∗The dot plots of a searched regulon are shown for all cell subpopulations in each disease state of each tissue based on the regulon specific score inferred using pySCENIC and by calculating the average expression. |
| Page: 1 |
Top |
Somatic mutation of malignant transformation related genes |
| Annotation of somatic variants for genes involved in malignant transformation |
| Hugo Symbol | Variant Class | Variant Classification | dbSNP RS | HGVSc | HGVSp | HGVSp Short | SWISSPROT | BIOTYPE | SIFT | PolyPhen | Tumor Sample Barcode | Tissue | Histology | Sex | Age | Stage | Therapy Types | Drugs | Outcome |
| PIGC | SNV | Missense_Mutation | c.878N>T | p.Ser293Phe | p.S293F | Q92535 | protein_coding | deleterious(0) | possibly_damaging(0.741) | TCGA-MA-AA41-01 | Cervix | cervical & endocervical cancer | Female | <65 | I/II | Unknown | Unknown | SD | |
| PIGC | SNV | Missense_Mutation | rs370905635 | c.812G>A | p.Arg271His | p.R271H | Q92535 | protein_coding | tolerated(0.59) | benign(0.003) | TCGA-F5-6814-01 | Colorectum | rectum adenocarcinoma | Male | <65 | I/II | Unknown | Unknown | SD |
| PIGC | insertion | Frame_Shift_Ins | novel | c.492_493insT | p.Asp165Ter | p.D165* | Q92535 | protein_coding | TCGA-AZ-6598-01 | Colorectum | colon adenocarcinoma | Female | >=65 | I/II | Unknown | Unknown | SD | ||
| PIGC | SNV | Missense_Mutation | novel | c.820N>T | p.Leu274Phe | p.L274F | Q92535 | protein_coding | tolerated(0.06) | possibly_damaging(0.5) | TCGA-A5-A0G1-01 | Endometrium | uterine corpus endometrioid carcinoma | Female | >=65 | I/II | Unknown | Unknown | SD |
| PIGC | SNV | Missense_Mutation | c.536N>C | p.Leu179Ser | p.L179S | Q92535 | protein_coding | deleterious(0) | probably_damaging(0.955) | TCGA-AX-A064-01 | Endometrium | uterine corpus endometrioid carcinoma | Female | >=65 | I/II | Unknown | Unknown | SD | |
| PIGC | SNV | Missense_Mutation | novel | c.790C>A | p.Leu264Met | p.L264M | Q92535 | protein_coding | deleterious(0.02) | probably_damaging(0.993) | TCGA-AX-A2HC-01 | Endometrium | uterine corpus endometrioid carcinoma | Female | <65 | III/IV | Chemotherapy | paclitaxel | PD |
| PIGC | SNV | Missense_Mutation | rs749059842 | c.583C>T | p.Arg195Trp | p.R195W | Q92535 | protein_coding | deleterious(0.02) | possibly_damaging(0.761) | TCGA-B5-A11E-01 | Endometrium | uterine corpus endometrioid carcinoma | Female | <65 | I/II | Unknown | Unknown | SD |
| PIGC | SNV | Missense_Mutation | novel | c.819N>T | p.Gln273His | p.Q273H | Q92535 | protein_coding | deleterious(0) | probably_damaging(1) | TCGA-B5-A3FA-01 | Endometrium | uterine corpus endometrioid carcinoma | Female | >=65 | I/II | Unknown | Unknown | SD |
| PIGC | SNV | Missense_Mutation | novel | c.548N>C | p.Ile183Thr | p.I183T | Q92535 | protein_coding | tolerated(0.16) | benign(0.037) | TCGA-EO-A3B0-01 | Endometrium | uterine corpus endometrioid carcinoma | Female | <65 | III/IV | Unknown | Unknown | SD |
| PIGC | SNV | Missense_Mutation | rs774871441 | c.95N>A | p.Arg32Gln | p.R32Q | Q92535 | protein_coding | tolerated(0.11) | benign(0.413) | TCGA-EY-A2OM-01 | Endometrium | uterine corpus endometrioid carcinoma | Female | <65 | I/II | Chemotherapy | taxol | SD |
| Page: 1 2 3 |
Top |
Related drugs of malignant transformation related genes |
| Identification of chemicals and drugs interact with genes involved in malignant transfromation |
| (DGIdb 4.0) |
| Entrez ID | Symbol | Category | Interaction Types | Drug Claim Name | Drug Name | PMIDs |
| Page: 1 |

Copyright 2023-Present -The University of Texas Health Science Center at Houston |