
|
|||||
|
 | |
| |
| |
| |
| |
| |
|
Gene: PIEZO2 |
Gene summary for PIEZO2 |
| Gene information | Species | Human | Gene symbol | PIEZO2 | Gene ID | 63895 |
| Gene name | piezo type mechanosensitive ion channel component 2 | |
| Gene Alias | C18orf30 | |
| Cytomap | 18p11.22-p11.21 | |
| Gene Type | protein-coding | GO ID | GO:0003008 | UniProtAcc | Q9H5I5 |
Top |
Malignant transformation analysis |
| Identification of the aberrant gene expression in precancerous and cancerous lesions by comparing the gene expression of stem-like cells in diseased tissues with normal stem cells |
| Entrez ID | Symbol | Replicates | Species | Organ | Tissue | Adj P-value | Log2FC | Malignancy |
| 63895 | PIEZO2 | HCC1_Meng | Human | Liver | HCC | 7.40e-03 | -7.51e-02 | 0.0246 |
| 63895 | PIEZO2 | HCC1 | Human | Liver | HCC | 7.22e-06 | 3.58e+00 | 0.5336 |
| 63895 | PIEZO2 | HCC2 | Human | Liver | HCC | 1.48e-02 | 2.30e+00 | 0.5341 |
| 63895 | PIEZO2 | Pt13.b | Human | Liver | HCC | 1.23e-07 | 2.08e-01 | 0.0251 |
| 63895 | PIEZO2 | S027 | Human | Liver | HCC | 7.56e-04 | 6.30e-01 | 0.2446 |
| 63895 | PIEZO2 | S028 | Human | Liver | HCC | 5.66e-17 | 7.52e-01 | 0.2503 |
| 63895 | PIEZO2 | S029 | Human | Liver | HCC | 1.87e-10 | 6.15e-01 | 0.2581 |
| 63895 | PIEZO2 | PTC03 | Human | Thyroid | PTC | 1.79e-02 | 1.42e-01 | 0.1784 |
| 63895 | PIEZO2 | ATC13 | Human | Thyroid | ATC | 7.27e-33 | 5.28e-01 | 0.34 |
| 63895 | PIEZO2 | ATC2 | Human | Thyroid | ATC | 9.94e-09 | 5.69e-01 | 0.34 |
| 63895 | PIEZO2 | ATC5 | Human | Thyroid | ATC | 1.72e-28 | 5.79e-01 | 0.34 |
| Page: 1 |
| Tissue | Expression Dynamics | Abbreviation |
| Liver |  | HCC: Hepatocellular carcinoma |
| NAFLD: Non-alcoholic fatty liver disease | ||
| Thyroid | 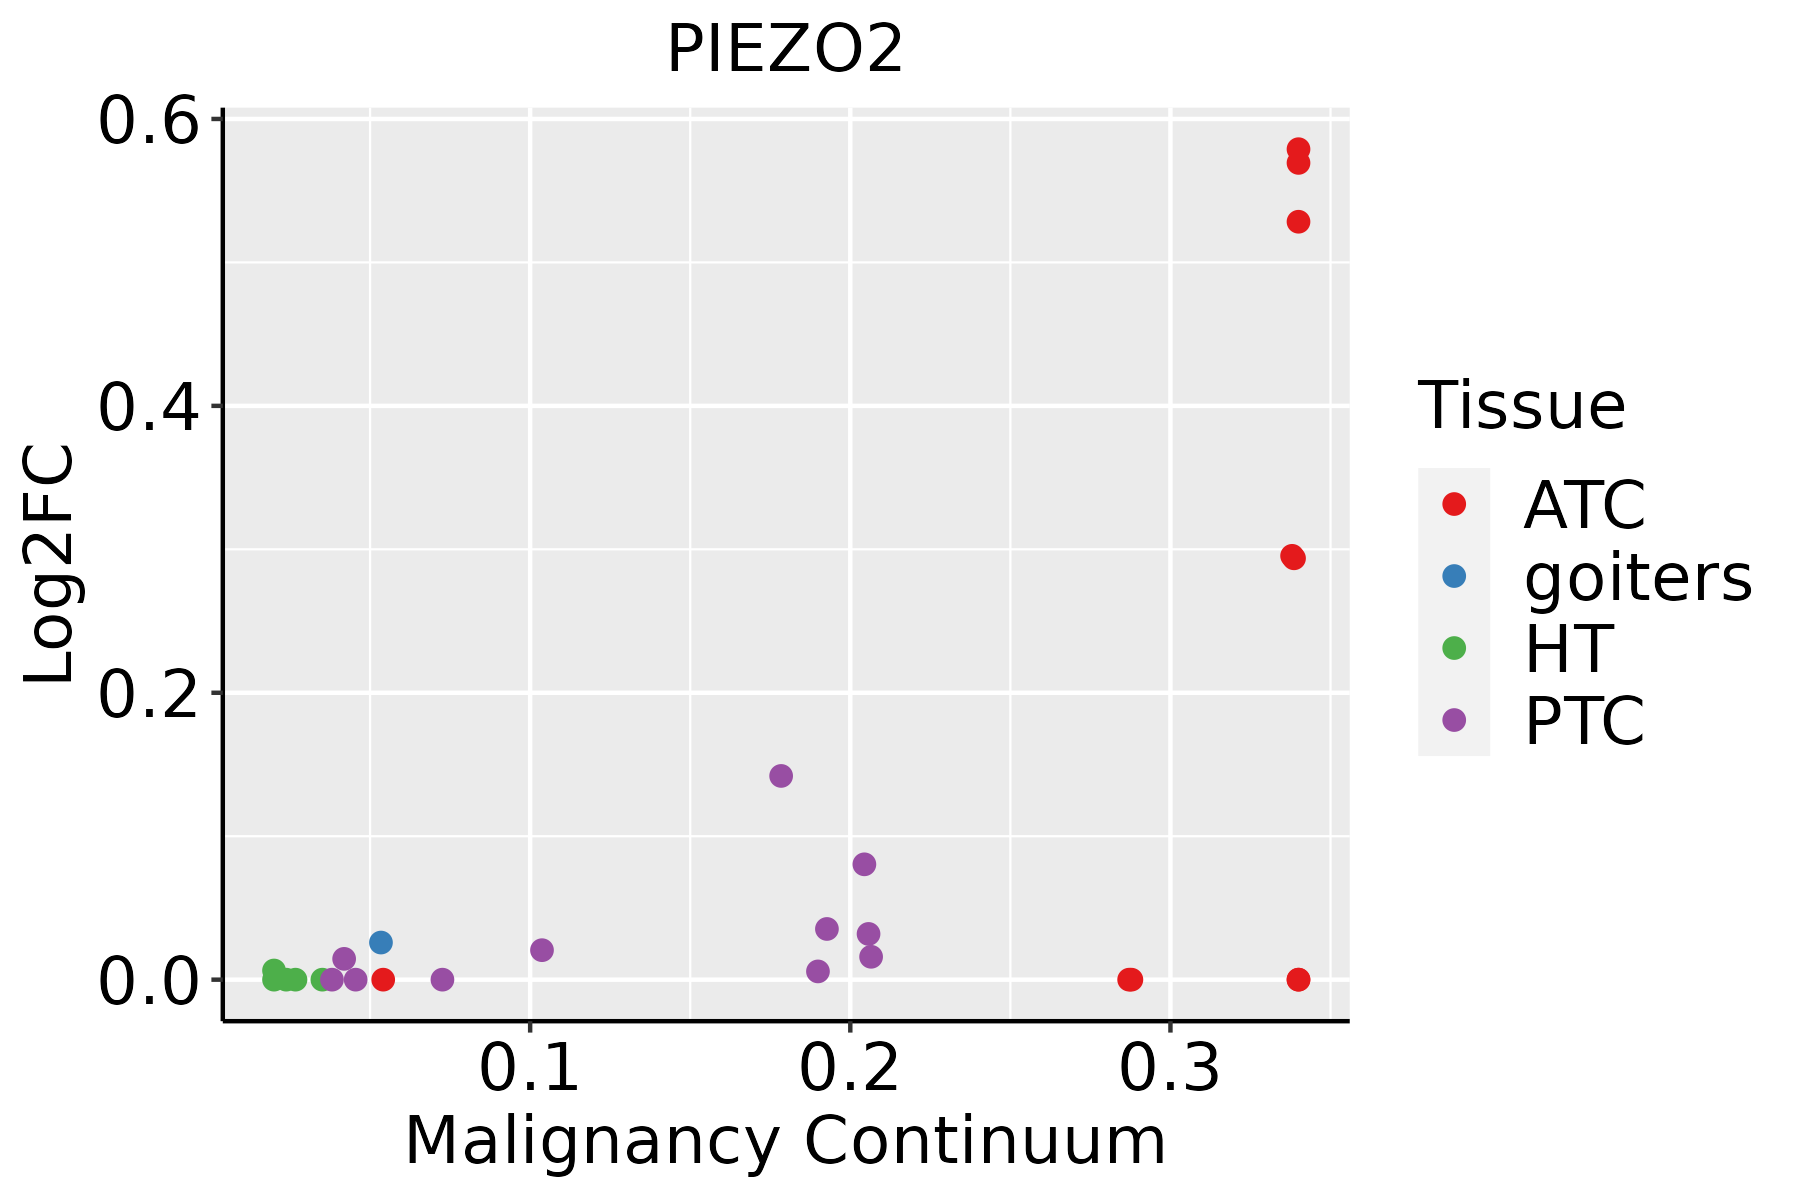 | ATC: Anaplastic thyroid cancer |
| HT: Hashimoto's thyroiditis | ||
| PTC: Papillary thyroid cancer |
| ∗log2FC in expression of this searched gene in stem-like cells from each diseased tissue sample relative to stem-like cells in normal samples in each tissue plotted against the malignancy continuum. Samples are colored based on if they are from different disease stage. |
Top |
Malignant transformation related pathway analysis |
| Find out the enriched GO biological processes and KEGG pathways involved in transition from healthy to precancer to cancer |
| Tissue | Disease Stage | Enriched GO biological Processes |
| Colorectum | AD |  |
| Colorectum | SER |  |
| Colorectum | MSS |  |
| Colorectum | MSI-H |  |
| Colorectum | FAP |  |
| ∗Top 15 enriched GO BP terms are showed in the bar plot of each disease state in each tissue. Each row represents a significant GO biological process which is colored according to the -log10(p.adjust). |
| Page: 1 2 3 4 5 6 7 8 9 |
| GO ID | Tissue | Disease Stage | Description | Gene Ratio | Bg Ratio | pvalue | p.adjust | Count |
| GO:007149622 | Liver | HCC | cellular response to external stimulus | 191/7958 | 320/18723 | 3.40e-10 | 1.13e-08 | 191 |
| GO:007121421 | Liver | HCC | cellular response to abiotic stimulus | 183/7958 | 331/18723 | 1.59e-06 | 2.26e-05 | 183 |
| GO:010400421 | Liver | HCC | cellular response to environmental stimulus | 183/7958 | 331/18723 | 1.59e-06 | 2.26e-05 | 183 |
| GO:00712601 | Liver | HCC | cellular response to mechanical stimulus | 48/7958 | 81/18723 | 1.72e-03 | 8.96e-03 | 48 |
| GO:00096124 | Liver | HCC | response to mechanical stimulus | 113/7958 | 216/18723 | 2.20e-03 | 1.10e-02 | 113 |
| GO:0071496113 | Thyroid | PTC | cellular response to external stimulus | 158/5968 | 320/18723 | 4.12e-11 | 1.47e-09 | 158 |
| GO:0071214111 | Thyroid | PTC | cellular response to abiotic stimulus | 158/5968 | 331/18723 | 9.90e-10 | 2.89e-08 | 158 |
| GO:0104004111 | Thyroid | PTC | cellular response to environmental stimulus | 158/5968 | 331/18723 | 9.90e-10 | 2.89e-08 | 158 |
| GO:0009612110 | Thyroid | PTC | response to mechanical stimulus | 98/5968 | 216/18723 | 2.09e-05 | 2.09e-04 | 98 |
| GO:007126016 | Thyroid | PTC | cellular response to mechanical stimulus | 44/5968 | 81/18723 | 2.34e-05 | 2.33e-04 | 44 |
| GO:0071496210 | Thyroid | ATC | cellular response to external stimulus | 165/6293 | 320/18723 | 2.01e-11 | 7.23e-10 | 165 |
| GO:007121427 | Thyroid | ATC | cellular response to abiotic stimulus | 169/6293 | 331/18723 | 3.24e-11 | 1.08e-09 | 169 |
| GO:010400427 | Thyroid | ATC | cellular response to environmental stimulus | 169/6293 | 331/18723 | 3.24e-11 | 1.08e-09 | 169 |
| GO:000961225 | Thyroid | ATC | response to mechanical stimulus | 105/6293 | 216/18723 | 3.29e-06 | 3.70e-05 | 105 |
| GO:007126022 | Thyroid | ATC | cellular response to mechanical stimulus | 46/6293 | 81/18723 | 1.51e-05 | 1.41e-04 | 46 |
| Page: 1 |
| Pathway ID | Tissue | Disease Stage | Description | Gene Ratio | Bg Ratio | pvalue | p.adjust | qvalue | Count |
| Page: 1 |
Top |
Cell-cell communication analysis |
| Identification of potential cell-cell interactions between two cell types and their ligand-receptor pairs for different disease states |
| Ligand | Receptor | LRpair | Pathway | Tissue | Disease Stage |
| Page: 1 |
Top |
Single-cell gene regulatory network inference analysis |
| Find out the significant the regulons (TFs) and the target genes of each regulon across cell types for different disease states |
| TF | Cell Type | Tissue | Disease Stage | Target Gene | RSS | Regulon Activity |
| ∗The dot plots of a searched regulon are shown for all cell subpopulations in each disease state of each tissue based on the regulon specific score inferred using pySCENIC and by calculating the average expression. |
| Page: 1 |
Top |
Somatic mutation of malignant transformation related genes |
| Annotation of somatic variants for genes involved in malignant transformation |
| Hugo Symbol | Variant Class | Variant Classification | dbSNP RS | HGVSc | HGVSp | HGVSp Short | SWISSPROT | BIOTYPE | SIFT | PolyPhen | Tumor Sample Barcode | Tissue | Histology | Sex | Age | Stage | Therapy Types | Drugs | Outcome |
| PIEZO2 | SNV | Missense_Mutation | rs144490141 | c.6647N>A | p.Ala2216Glu | p.A2216E | Q9H5I5 | protein_coding | deleterious(0) | possibly_damaging(0.561) | TCGA-A7-A0DB-01 | Breast | breast invasive carcinoma | Female | <65 | I/II | Hormone Therapy | arimidex | SD |
| PIEZO2 | SNV | Missense_Mutation | novel | c.1690G>C | p.Glu564Gln | p.E564Q | Q9H5I5 | protein_coding | tolerated(0.19) | benign(0.106) | TCGA-AC-A23H-01 | Breast | breast invasive carcinoma | Female | >=65 | I/II | Unknown | Unknown | PD |
| PIEZO2 | SNV | Missense_Mutation | novel | c.1189G>A | p.Asp397Asn | p.D397N | Q9H5I5 | protein_coding | deleterious(0.01) | probably_damaging(0.958) | TCGA-AC-A23H-01 | Breast | breast invasive carcinoma | Female | >=65 | I/II | Unknown | Unknown | PD |
| PIEZO2 | SNV | Missense_Mutation | rs189453524 | c.8117N>A | p.Arg2706Gln | p.R2706Q | Q9H5I5 | protein_coding | deleterious(0) | probably_damaging(0.992) | TCGA-AN-A046-01 | Breast | breast invasive carcinoma | Female | >=65 | I/II | Unknown | Unknown | SD |
| PIEZO2 | SNV | Missense_Mutation | c.2853C>G | p.Ile951Met | p.I951M | Q9H5I5 | protein_coding | deleterious(0) | possibly_damaging(0.691) | TCGA-AR-A0TX-01 | Breast | breast invasive carcinoma | Female | <65 | I/II | Unknown | Unknown | SD | |
| PIEZO2 | SNV | Missense_Mutation | rs202104395 | c.1261N>A | p.Gly421Ser | p.G421S | Q9H5I5 | protein_coding | deleterious(0.04) | probably_damaging(0.987) | TCGA-AR-A24T-01 | Breast | breast invasive carcinoma | Female | <65 | III/IV | Chemotherapy | cytoxan | SD |
| PIEZO2 | SNV | Missense_Mutation | c.5522N>A | p.Ser1841Tyr | p.S1841Y | Q9H5I5 | protein_coding | deleterious(0.01) | benign(0.049) | TCGA-B6-A0RS-01 | Breast | breast invasive carcinoma | Female | <65 | I/II | Unknown | Unknown | PD | |
| PIEZO2 | SNV | Missense_Mutation | novel | c.8095N>C | p.Glu2699Gln | p.E2699Q | Q9H5I5 | protein_coding | deleterious(0) | probably_damaging(0.995) | TCGA-BH-A0DQ-01 | Breast | breast invasive carcinoma | Female | <65 | I/II | Chemotherapy | doxorubicin | SD |
| PIEZO2 | SNV | Missense_Mutation | c.7551N>A | p.Met2517Ile | p.M2517I | Q9H5I5 | protein_coding | deleterious(0) | benign(0.192) | TCGA-BH-A0HF-01 | Breast | breast invasive carcinoma | Female | >=65 | I/II | Hormone Therapy | arimidex | SD | |
| PIEZO2 | SNV | Missense_Mutation | novel | c.901N>G | p.Asn301Asp | p.N301D | Q9H5I5 | protein_coding | tolerated(0.85) | benign(0) | TCGA-BH-A1ET-01 | Breast | breast invasive carcinoma | Female | <65 | I/II | Unknown | Unknown | SD |
| Page: 1 2 3 4 5 6 7 8 9 10 11 12 13 14 15 16 17 18 19 20 21 22 23 24 25 26 |
Top |
Related drugs of malignant transformation related genes |
| Identification of chemicals and drugs interact with genes involved in malignant transfromation |
| (DGIdb 4.0) |
| Entrez ID | Symbol | Category | Interaction Types | Drug Claim Name | Drug Name | PMIDs |
| Page: 1 |

Copyright 2023-Present -The University of Texas Health Science Center at Houston |