Schematic overview of the cellular and molecular mechanisms involved in the cancer progression, including the proposed cellular and molecular mechanisms in cancer cells trajectory. AT1: alveolar type 1 cells; AT2: alveolar type 2 cells; AAH: atypical adenomatous hyperplasia; AIS: adenocarcinoma in situ; MIA: minimally invasive adenocarcinoma; IA: invasive adenocarcinoma; EMT: epithelial-mesenchymal transition

Home

Download

Statistics

Help

Contact

Center for Computational Systems Medicine
leaf

Gene summary

leaf

Malignant transformation analysis

leaf

Malignant transformation related pathway analysis

leaf

Cell-cell communication analysis

leaf

Single-cell gene regulatory network inference analysis

leaf

Somatic mutation of malignant transformation related genes

leaf

Related drugs of malignant transformation related genes

Gene: PIEZO1

Gene summary for PIEZO1

check button Gene summary.

Gene informationSpeciesHuman
Gene symbol

PIEZO1

Gene ID

9780

Gene namepiezo type mechanosensitive ion channel component 1
Gene AliasDHS
Cytomap16q24.3
Gene Typeprotein-coding
GO ID

GO:0006810

UniProtAcc

Q92508


Top

Malignant transformation analysis

check button Identification of the aberrant gene expression in precancerous and cancerous lesions by comparing the gene expression of stem-like cells in diseased tissues with normal stem cells
check button Malignant transformation involving gene list.
Entrez IDSymbolReplicatesSpeciesOrganTissueAdj P-valueLog2FCMalignancy
9780PIEZO1LZE4THumanEsophagusESCC4.68e-041.02e-010.0811
9780PIEZO1LZE7THumanEsophagusESCC1.19e-042.06e-010.0667
9780PIEZO1LZE8THumanEsophagusESCC2.46e-041.51e-010.067
9780PIEZO1LZE20THumanEsophagusESCC1.83e-071.80e-010.0662
9780PIEZO1LZE22D1HumanEsophagusHGIN8.17e-031.03e-010.0595
9780PIEZO1LZE22THumanEsophagusESCC1.00e-044.06e-010.068
9780PIEZO1LZE24THumanEsophagusESCC2.43e-061.59e-010.0596
9780PIEZO1LZE21THumanEsophagusESCC8.50e-032.84e-010.0655
9780PIEZO1P1T-EHumanEsophagusESCC2.02e-085.39e-010.0875
9780PIEZO1P2T-EHumanEsophagusESCC1.35e-131.03e-010.1177
9780PIEZO1P4T-EHumanEsophagusESCC4.90e-089.63e-020.1323
9780PIEZO1P5T-EHumanEsophagusESCC3.31e-162.19e-010.1327
9780PIEZO1P8T-EHumanEsophagusESCC3.05e-123.26e-010.0889
9780PIEZO1P9T-EHumanEsophagusESCC1.58e-106.85e-020.1131
9780PIEZO1P10T-EHumanEsophagusESCC7.61e-101.68e-010.116
9780PIEZO1P11T-EHumanEsophagusESCC6.33e-113.55e-010.1426
9780PIEZO1P12T-EHumanEsophagusESCC2.24e-081.40e-010.1122
9780PIEZO1P15T-EHumanEsophagusESCC3.43e-071.54e-010.1149
9780PIEZO1P16T-EHumanEsophagusESCC2.62e-076.05e-020.1153
9780PIEZO1P17T-EHumanEsophagusESCC1.20e-114.36e-010.1278
Page: 1 2 3 4 5 6 

check button Transcriptomic changes along malignancy continuum.
TissueExpression DynamicsAbbreviation
EsophagusThe image shows the transcriptomic changes along malignancy continuum.log2FC in expression of this searched gene in stem-like cells from each diseased tissue sample relative to stem-like cells in normal samples in each tissue plotted against the malignancy continuum. Samples are colored based on if they are from different disease stage.ESCC: Esophageal squamous cell carcinoma
HGIN: High-grade intraepithelial neoplasias
LGIN: Low-grade intraepithelial neoplasias
LiverThe image shows the transcriptomic changes along malignancy continuum.log2FC in expression of this searched gene in stem-like cells from each diseased tissue sample relative to stem-like cells in normal samples in each tissue plotted against the malignancy continuum. Samples are colored based on if they are from different disease stage.
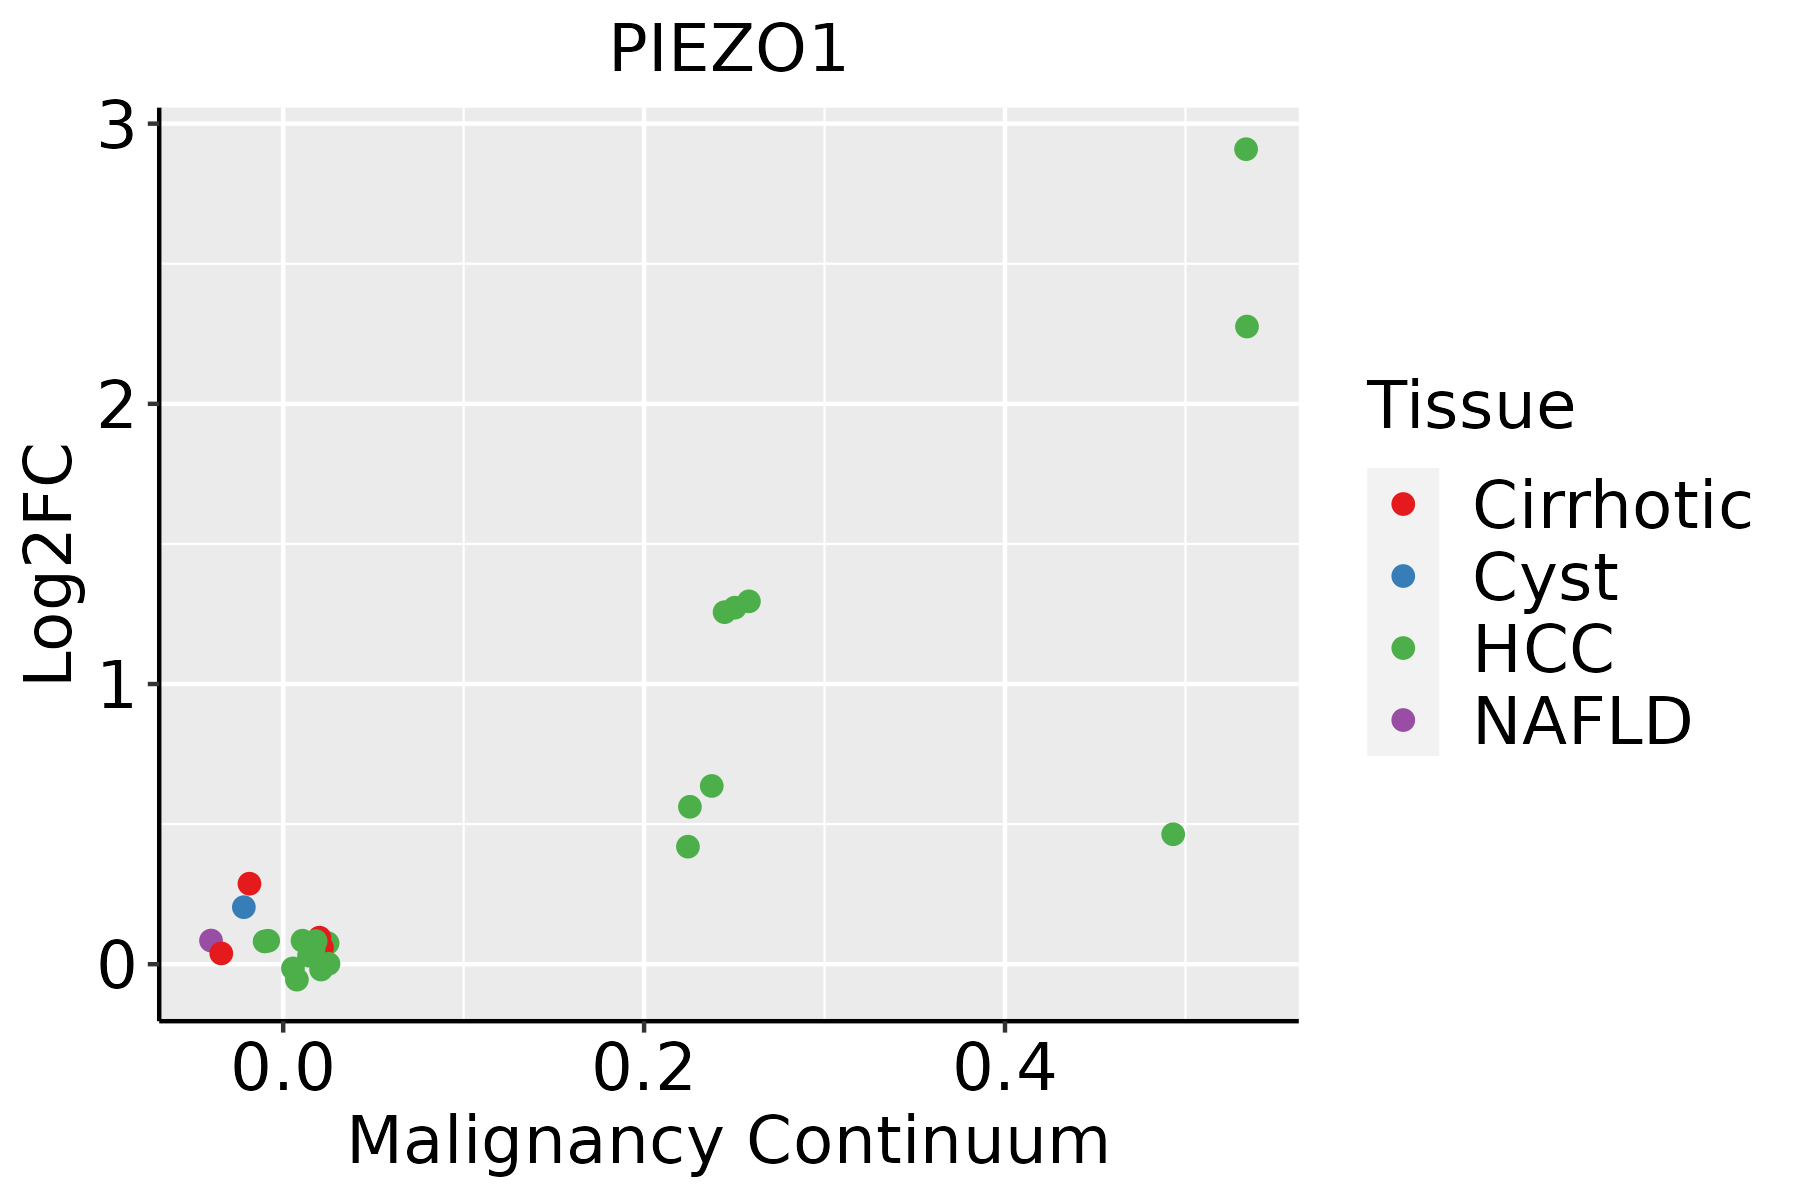
HCC: Hepatocellular carcinoma
NAFLD: Non-alcoholic fatty liver disease
Oral CavityThe image shows the transcriptomic changes along malignancy continuum.log2FC in expression of this searched gene in stem-like cells from each diseased tissue sample relative to stem-like cells in normal samples in each tissue plotted against the malignancy continuum. Samples are colored based on if they are from different disease stage.EOLP: Erosive Oral lichen planus
LP: leukoplakia
NEOLP: Non-erosive oral lichen planus
OSCC: Oral squamous cell carcinoma
SkinThe image shows the transcriptomic changes along malignancy continuum.log2FC in expression of this searched gene in stem-like cells from each diseased tissue sample relative to stem-like cells in normal samples in each tissue plotted against the malignancy continuum. Samples are colored based on if they are from different disease stage.
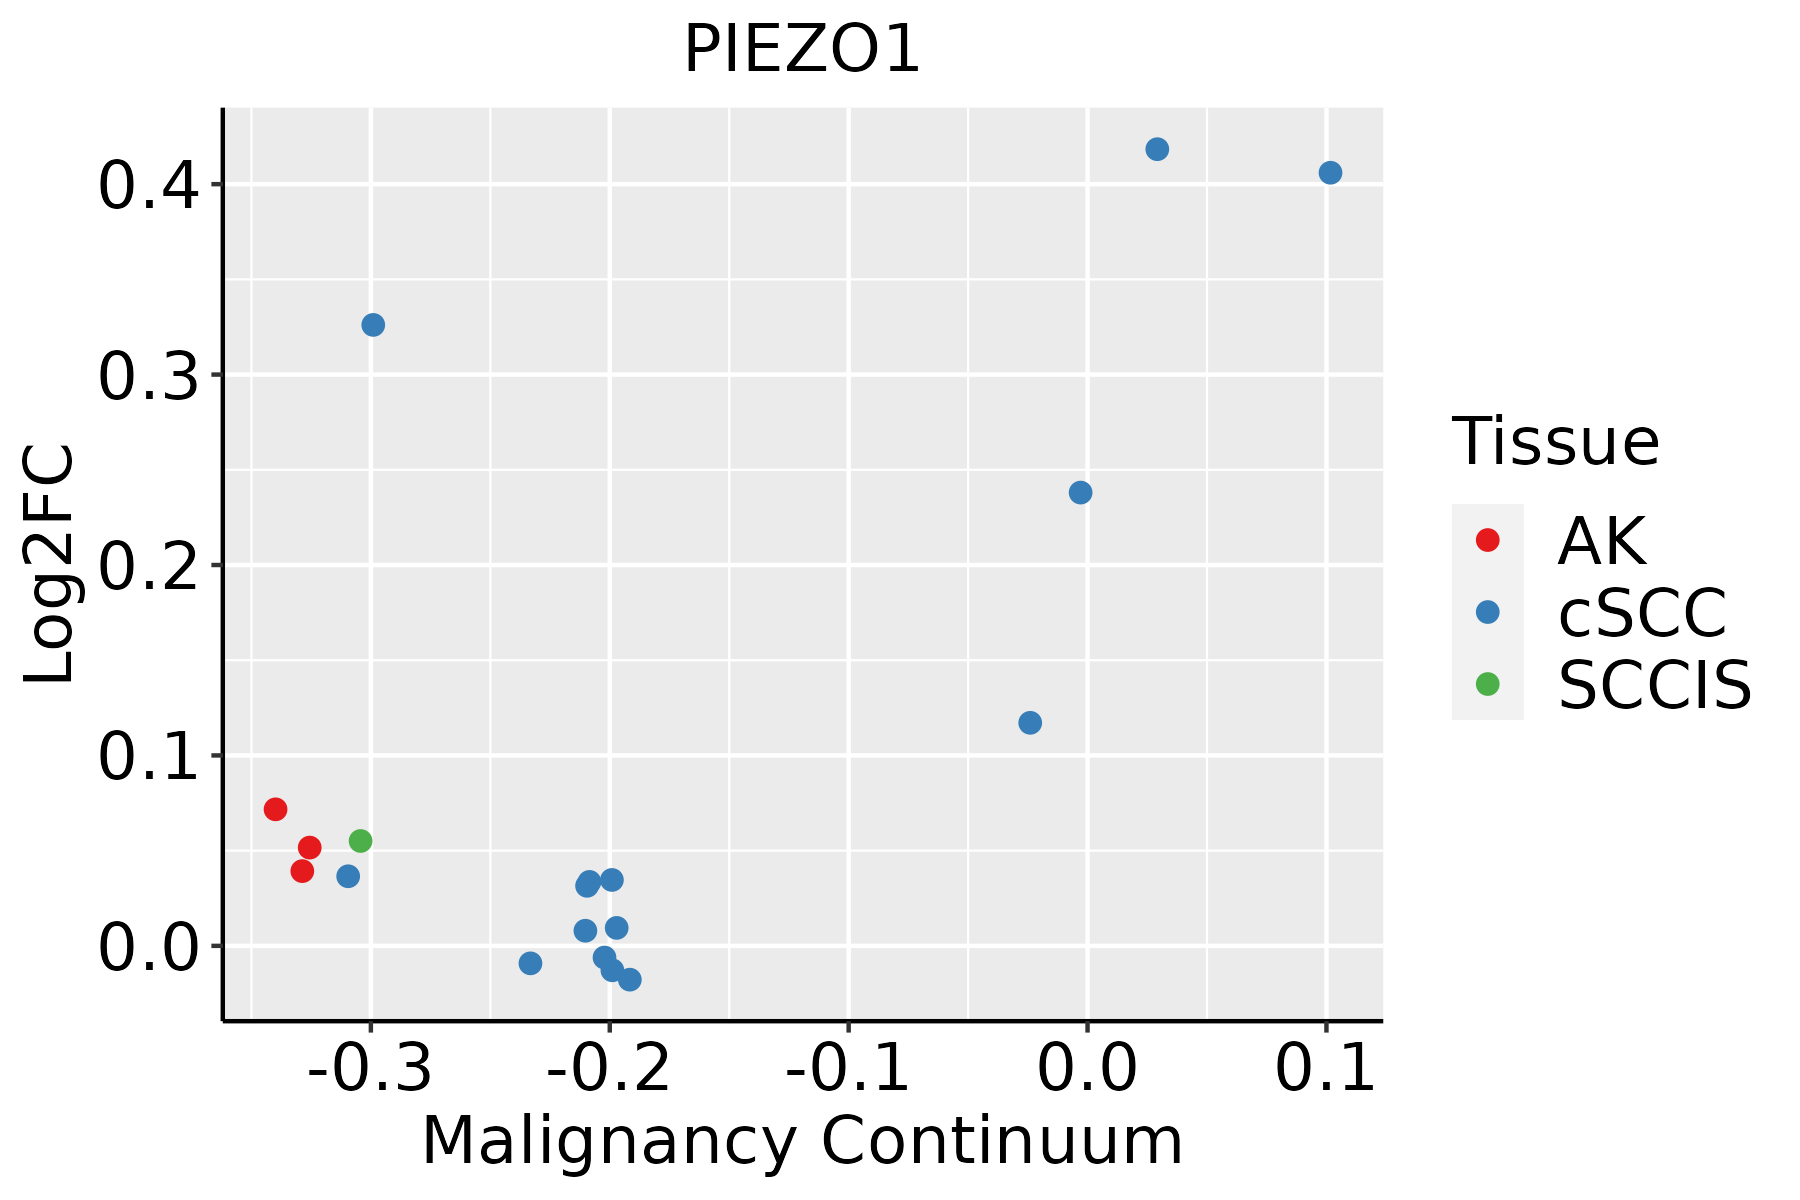
AK: Actinic keratosis
cSCC: Cutaneous squamous cell carcinoma
SCCIS:squamous cell carcinoma in situ
ThyroidThe image shows the transcriptomic changes along malignancy continuum.log2FC in expression of this searched gene in stem-like cells from each diseased tissue sample relative to stem-like cells in normal samples in each tissue plotted against the malignancy continuum. Samples are colored based on if they are from different disease stage.ATC: Anaplastic thyroid cancer
HT: Hashimoto's thyroiditis
PTC: Papillary thyroid cancer
∗log2FC in expression of this searched gene in stem-like cells from each diseased tissue sample relative to stem-like cells in normal samples in each tissue plotted against the malignancy continuum. Samples are colored based on if they are from different disease stage.

Top

Malignant transformation related pathway analysis

check buttonFind out the enriched GO biological processes and KEGG pathways involved in transition from healthy to precancer to cancer
check button Figure of enriched GO biological processes.
TissueDisease StageEnriched GO biological Processes
ColorectumADGO analysis - Figure of enriched GO biological processes: Top 15 enriched GO BP terms are showed in the bar plot of each disease state in each tissue. Each row represents a significant GO biological process which is colored according to the -log10(p.adjust).
ColorectumSERGO analysis - Figure of enriched GO biological processes: Top 15 enriched GO BP terms are showed in the bar plot of each disease state in each tissue. Each row represents a significant GO biological process which is colored according to the -log10(p.adjust).
ColorectumMSSGO analysis - Figure of enriched GO biological processes: Top 15 enriched GO BP terms are showed in the bar plot of each disease state in each tissue. Each row represents a significant GO biological process which is colored according to the -log10(p.adjust).
ColorectumMSI-HGO analysis - Figure of enriched GO biological processes: Top 15 enriched GO BP terms are showed in the bar plot of each disease state in each tissue. Each row represents a significant GO biological process which is colored according to the -log10(p.adjust).
ColorectumFAPGO analysis - Figure of enriched GO biological processes: Top 15 enriched GO BP terms are showed in the bar plot of each disease state in each tissue. Each row represents a significant GO biological process which is colored according to the -log10(p.adjust).
∗Top 15 enriched GO BP terms are showed in the bar plot of each disease state in each tissue. Each row represents a significant GO biological process which is colored according to the -log10(p.adjust).
Page: 1 2 3 4 5 6 7 8 9 

check button Enriched GO biological processes.
GO IDTissueDisease StageDescriptionGene RatioBg Ratiopvaluep.adjustCount
GO:003133425EsophagusHGINpositive regulation of protein-containing complex assembly61/2587237/187237.10e-073.00e-0561
GO:004325427EsophagusHGINregulation of protein-containing complex assembly94/2587428/187232.39e-068.55e-0594
GO:007149626EsophagusHGINcellular response to external stimulus71/2587320/187232.77e-057.19e-0471
GO:007121418EsophagusHGINcellular response to abiotic stimulus66/2587331/187231.21e-031.45e-0266
GO:010400418EsophagusHGINcellular response to environmental stimulus66/2587331/187231.21e-031.45e-0266
GO:0043254111EsophagusESCCregulation of protein-containing complex assembly278/8552428/187233.81e-162.77e-14278
GO:0071496111EsophagusESCCcellular response to external stimulus215/8552320/187234.29e-152.43e-13215
GO:0031334111EsophagusESCCpositive regulation of protein-containing complex assembly166/8552237/187232.06e-141.07e-12166
GO:007121419EsophagusESCCcellular response to abiotic stimulus206/8552331/187237.52e-101.88e-08206
GO:010400419EsophagusESCCcellular response to environmental stimulus206/8552331/187237.52e-101.88e-08206
GO:004578527EsophagusESCCpositive regulation of cell adhesion255/8552437/187235.07e-089.11e-07255
GO:00712606EsophagusESCCcellular response to mechanical stimulus54/855281/187231.09e-047.64e-0454
GO:000961216EsophagusESCCresponse to mechanical stimulus124/8552216/187233.30e-041.94e-03124
GO:002240720EsophagusESCCregulation of cell-cell adhesion239/8552448/187235.88e-043.19e-03239
GO:002240919EsophagusESCCpositive regulation of cell-cell adhesion155/8552284/187231.50e-037.06e-03155
GO:00336275EsophagusESCCcell adhesion mediated by integrin45/855272/187232.97e-031.24e-0245
GO:00336281EsophagusESCCregulation of cell adhesion mediated by integrin31/855248/187236.41e-032.35e-0231
GO:004325412LiverCirrhoticregulation of protein-containing complex assembly169/4634428/187237.40e-124.99e-10169
GO:007149612LiverCirrhoticcellular response to external stimulus123/4634320/187233.27e-081.10e-06123
GO:00313347LiverCirrhoticpositive regulation of protein-containing complex assembly95/4634237/187231.21e-073.39e-0695
Page: 1 2 3 4 5 

check button Enriched KEGG pathways.
Pathway IDTissueDisease StageDescriptionGene RatioBg Ratiopvaluep.adjustqvalueCount
Page: 1 

Top

Cell-cell communication analysis

check buttonIdentification of potential cell-cell interactions between two cell types and their ligand-receptor pairs for different disease states
LigandReceptorLRpairPathwayTissueDisease Stage
Page: 1 

Top

Single-cell gene regulatory network inference analysis

check buttonFind out the significant the regulons (TFs) and the target genes of each regulon across cell types for different disease states
TFCell TypeTissueDisease StageTarget GeneRSSRegulon Activity
∗The dot plots of a searched regulon are shown for all cell subpopulations in each disease state of each tissue based on the regulon specific score inferred using pySCENIC and by calculating the average expression.
Page: 1 

Top

Somatic mutation of malignant transformation related genes

check buttonAnnotation of somatic variants for genes involved in malignant transformation
Hugo SymbolVariant ClassVariant ClassificationdbSNP RSHGVScHGVSpHGVSp ShortSWISSPROTBIOTYPESIFTPolyPhenTumor Sample BarcodeTissueHistologySexAgeStageTherapy TypesDrugsOutcome
PIEZO1SNVMissense_Mutationnovelc.2108N>Ap.Arg703Lysp.R703KQ92508protein_codingtolerated(0.78)benign(0.001)TCGA-A2-A0CR-01Breastbreast invasive carcinomaFemale<65I/IIChemotherapyadriamycinCR
PIEZO1SNVMissense_Mutationc.6790N>Cp.Asp2264Hisp.D2264HQ92508protein_codingdeleterious(0)probably_damaging(0.999)TCGA-AC-A23H-01Breastbreast invasive carcinomaFemale>=65I/IIUnknownUnknownPD
PIEZO1SNVMissense_Mutationrs34873950c.4316N>Tp.Ser1439Leup.S1439LQ92508protein_codingtolerated(0.27)benign(0.003)TCGA-AC-A23H-01Breastbreast invasive carcinomaFemale>=65I/IIUnknownUnknownPD
PIEZO1SNVMissense_Mutationc.1505N>Ap.Arg502Hisp.R502HQ92508protein_codingtolerated(0.19)benign(0)TCGA-AC-A2FB-01Breastbreast invasive carcinomaFemale>=65I/IIChemotherapytaxotereCR
PIEZO1SNVMissense_Mutationc.4724C>Tp.Ala1575Valp.A1575VQ92508protein_codingtolerated(0.3)benign(0.003)TCGA-BH-A18G-01Breastbreast invasive carcinomaFemale>=65I/IIUnknownUnknownSD
PIEZO1SNVMissense_Mutationnovelc.5587C>Ap.Pro1863Thrp.P1863TQ92508protein_codingtolerated(0.15)benign(0.015)TCGA-D8-A27M-01Breastbreast invasive carcinomaFemale<65I/IIChemotherapymethotrexate+5SD
PIEZO1SNVMissense_Mutationnovelc.503C>Gp.Ala168Glyp.A168GQ92508protein_codingtolerated(0.42)benign(0)TCGA-E9-A22G-01Breastbreast invasive carcinomaFemale<65I/IIChemotherapydoxorubicinSD
PIEZO1SNVMissense_Mutationc.1513N>Cp.Gly505Argp.G505RQ92508protein_codingdeleterious(0)probably_damaging(0.999)TCGA-GM-A2DO-01Breastbreast invasive carcinomaFemale<65I/IIHormone TherapytamoxiphenCR
PIEZO1SNVMissense_Mutationnovelc.7219N>Ap.Glu2407Lysp.E2407KQ92508protein_codingtolerated(0.25)benign(0.043)TCGA-UL-AAZ6-01Breastbreast invasive carcinomaFemale>=65I/IIChemotherapyherceptinSD
PIEZO1SNVMissense_Mutationnovelc.4118G>Ap.Arg1373Hisp.R1373HQ92508protein_codingtolerated(0.2)benign(0)TCGA-2W-A8YY-01Cervixcervical & endocervical cancerFemale<65I/IIChemotherapycisplatinCR
Page: 1 2 3 4 5 6 7 8 9 10 11 12 13 

Top

Related drugs of malignant transformation related genes

check buttonIdentification of chemicals and drugs interact with genes involved in malignant transfromation
(DGIdb 4.0)
Entrez IDSymbolCategoryInteraction TypesDrug Claim NameDrug NamePMIDs
9780PIEZO1ION CHANNEL, TRANSPORTERinhibitor381118822
9780PIEZO1ION CHANNEL, TRANSPORTERactivator354702289
Page: 1