
|
|||||
|
 | |
| |
| |
| |
| |
| |
|
Gene: PICK1 |
Gene summary for PICK1 |
| Gene information | Species | Human | Gene symbol | PICK1 | Gene ID | 9463 |
| Gene name | protein interacting with PRKCA 1 | |
| Gene Alias | PICK | |
| Cytomap | 22q13.1 | |
| Gene Type | protein-coding | GO ID | GO:0000003 | UniProtAcc | A0A024R1J5 |
Top |
Malignant transformation analysis |
| Identification of the aberrant gene expression in precancerous and cancerous lesions by comparing the gene expression of stem-like cells in diseased tissues with normal stem cells |
| Entrez ID | Symbol | Replicates | Species | Organ | Tissue | Adj P-value | Log2FC | Malignancy |
| 9463 | PICK1 | LZE7T | Human | Esophagus | ESCC | 2.62e-03 | 2.59e-01 | 0.0667 |
| 9463 | PICK1 | LZE24T | Human | Esophagus | ESCC | 9.53e-11 | 2.62e-01 | 0.0596 |
| 9463 | PICK1 | P1T-E | Human | Esophagus | ESCC | 1.09e-10 | 4.05e-01 | 0.0875 |
| 9463 | PICK1 | P2T-E | Human | Esophagus | ESCC | 1.05e-19 | 2.36e-01 | 0.1177 |
| 9463 | PICK1 | P4T-E | Human | Esophagus | ESCC | 1.28e-10 | 2.68e-01 | 0.1323 |
| 9463 | PICK1 | P5T-E | Human | Esophagus | ESCC | 1.20e-08 | 1.11e-01 | 0.1327 |
| 9463 | PICK1 | P8T-E | Human | Esophagus | ESCC | 7.06e-13 | 2.47e-01 | 0.0889 |
| 9463 | PICK1 | P9T-E | Human | Esophagus | ESCC | 2.36e-10 | 1.60e-01 | 0.1131 |
| 9463 | PICK1 | P10T-E | Human | Esophagus | ESCC | 4.76e-37 | 6.88e-01 | 0.116 |
| 9463 | PICK1 | P11T-E | Human | Esophagus | ESCC | 7.61e-14 | 4.84e-01 | 0.1426 |
| 9463 | PICK1 | P12T-E | Human | Esophagus | ESCC | 1.17e-18 | 3.45e-01 | 0.1122 |
| 9463 | PICK1 | P15T-E | Human | Esophagus | ESCC | 3.97e-15 | 3.49e-01 | 0.1149 |
| 9463 | PICK1 | P16T-E | Human | Esophagus | ESCC | 1.92e-15 | 3.77e-01 | 0.1153 |
| 9463 | PICK1 | P17T-E | Human | Esophagus | ESCC | 9.13e-09 | 3.02e-01 | 0.1278 |
| 9463 | PICK1 | P20T-E | Human | Esophagus | ESCC | 4.04e-09 | 1.84e-01 | 0.1124 |
| 9463 | PICK1 | P21T-E | Human | Esophagus | ESCC | 1.08e-15 | 3.91e-01 | 0.1617 |
| 9463 | PICK1 | P22T-E | Human | Esophagus | ESCC | 3.84e-15 | 1.95e-01 | 0.1236 |
| 9463 | PICK1 | P23T-E | Human | Esophagus | ESCC | 4.70e-23 | 4.90e-01 | 0.108 |
| 9463 | PICK1 | P24T-E | Human | Esophagus | ESCC | 9.47e-11 | 2.58e-01 | 0.1287 |
| 9463 | PICK1 | P26T-E | Human | Esophagus | ESCC | 2.28e-16 | 3.53e-01 | 0.1276 |
| Page: 1 2 3 |
| Tissue | Expression Dynamics | Abbreviation |
| Esophagus | 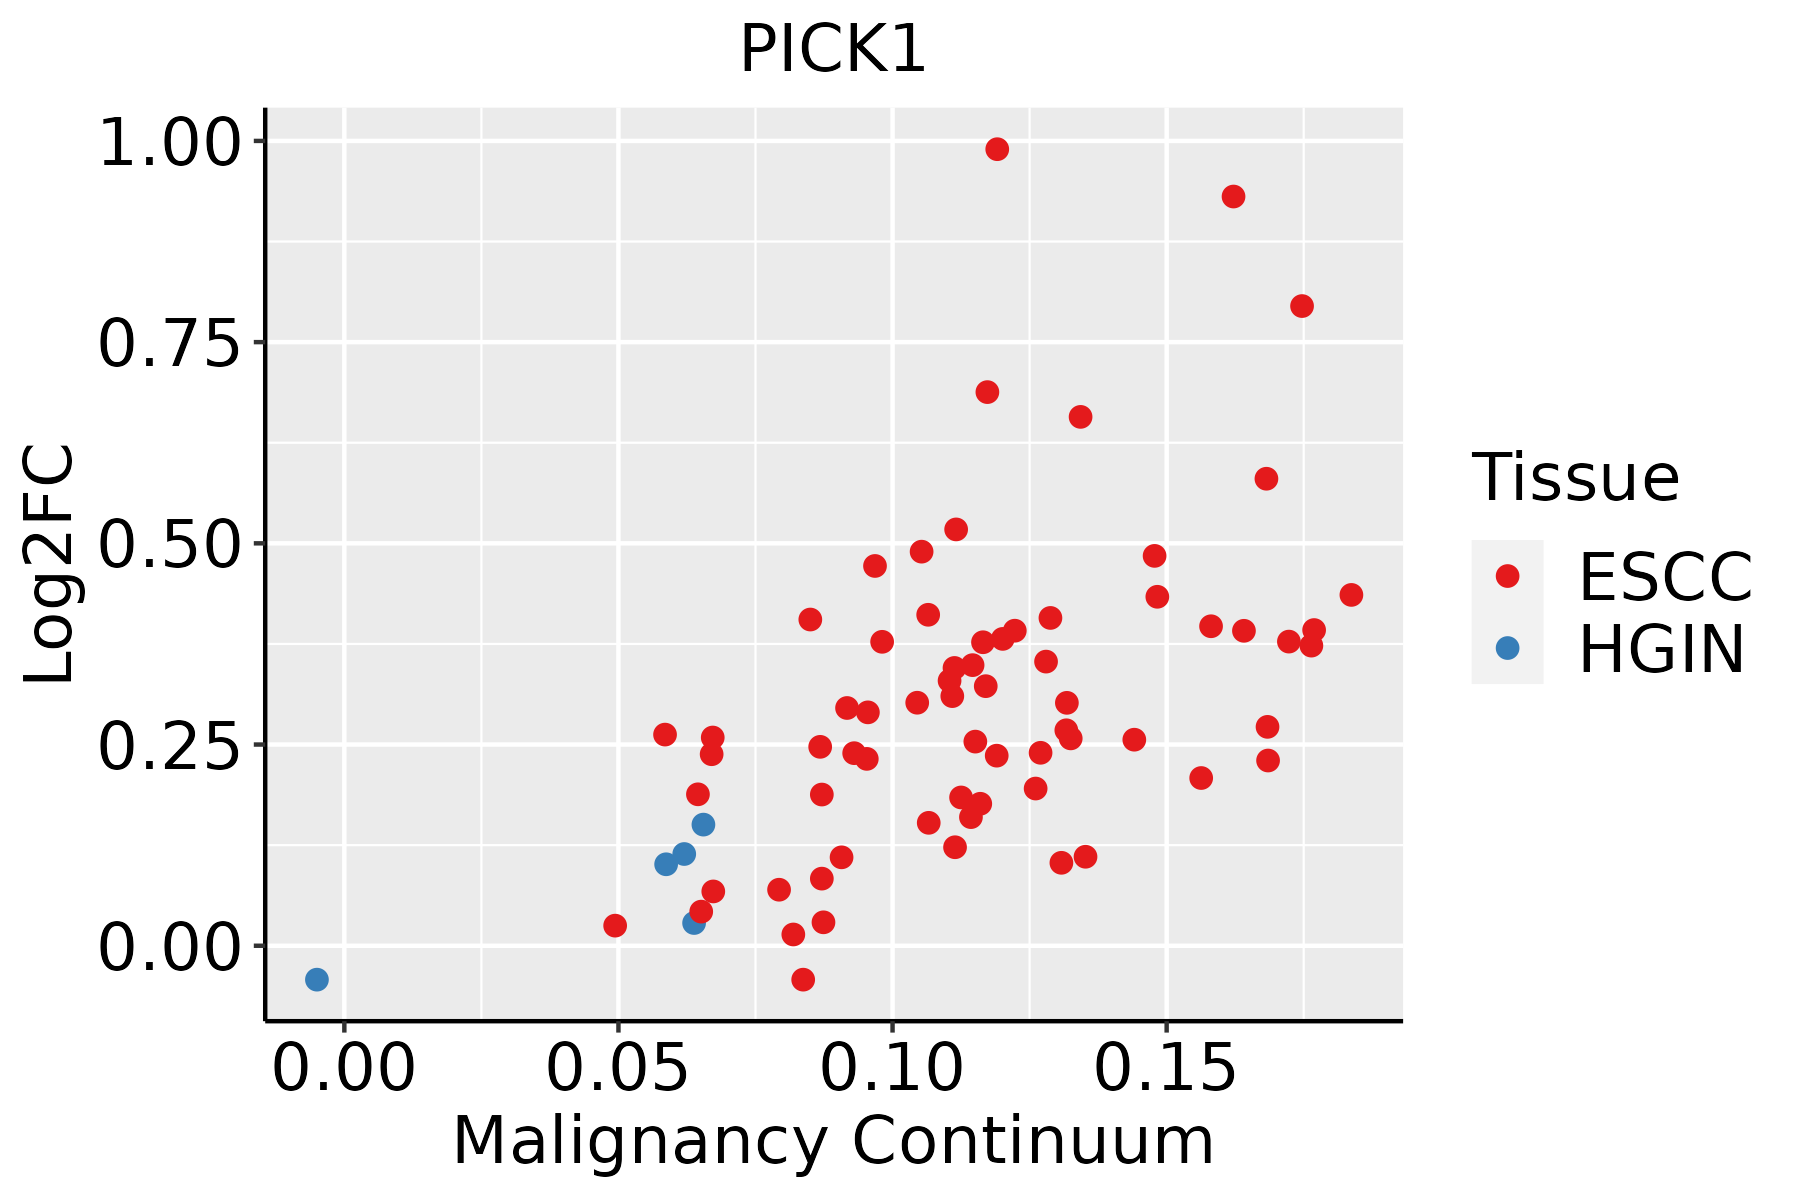 | ESCC: Esophageal squamous cell carcinoma |
| HGIN: High-grade intraepithelial neoplasias | ||
| LGIN: Low-grade intraepithelial neoplasias |
| ∗log2FC in expression of this searched gene in stem-like cells from each diseased tissue sample relative to stem-like cells in normal samples in each tissue plotted against the malignancy continuum. Samples are colored based on if they are from different disease stage. |
Top |
Malignant transformation related pathway analysis |
| Find out the enriched GO biological processes and KEGG pathways involved in transition from healthy to precancer to cancer |
| Tissue | Disease Stage | Enriched GO biological Processes |
| Colorectum | AD |  |
| Colorectum | SER |  |
| Colorectum | MSS |  |
| Colorectum | MSI-H |  |
| Colorectum | FAP |  |
| ∗Top 15 enriched GO BP terms are showed in the bar plot of each disease state in each tissue. Each row represents a significant GO biological process which is colored according to the -log10(p.adjust). |
| Page: 1 2 3 4 5 6 7 8 9 |
| GO ID | Tissue | Disease Stage | Description | Gene Ratio | Bg Ratio | pvalue | p.adjust | Count |
| GO:004819318 | Esophagus | ESCC | Golgi vesicle transport | 231/8552 | 296/18723 | 1.82e-30 | 9.63e-28 | 231 |
| GO:0043254111 | Esophagus | ESCC | regulation of protein-containing complex assembly | 278/8552 | 428/18723 | 3.81e-16 | 2.77e-14 | 278 |
| GO:0071496111 | Esophagus | ESCC | cellular response to external stimulus | 215/8552 | 320/18723 | 4.29e-15 | 2.43e-13 | 215 |
| GO:0031334111 | Esophagus | ESCC | positive regulation of protein-containing complex assembly | 166/8552 | 237/18723 | 2.06e-14 | 1.07e-12 | 166 |
| GO:0031668111 | Esophagus | ESCC | cellular response to extracellular stimulus | 168/8552 | 246/18723 | 4.93e-13 | 2.23e-11 | 168 |
| GO:0031669110 | Esophagus | ESCC | cellular response to nutrient levels | 148/8552 | 215/18723 | 4.58e-12 | 1.76e-10 | 148 |
| GO:0031667111 | Esophagus | ESCC | response to nutrient levels | 289/8552 | 474/18723 | 9.25e-12 | 3.47e-10 | 289 |
| GO:1902905111 | Esophagus | ESCC | positive regulation of supramolecular fiber organization | 142/8552 | 209/18723 | 5.51e-11 | 1.76e-09 | 142 |
| GO:0070482111 | Esophagus | ESCC | response to oxygen levels | 218/8552 | 347/18723 | 6.91e-11 | 2.17e-09 | 218 |
| GO:1902903111 | Esophagus | ESCC | regulation of supramolecular fiber organization | 237/8552 | 383/18723 | 9.06e-11 | 2.75e-09 | 237 |
| GO:000689017 | Esophagus | ESCC | retrograde vesicle-mediated transport, Golgi to endoplasmic reticulum | 46/8552 | 52/18723 | 1.23e-10 | 3.66e-09 | 46 |
| GO:0009267110 | Esophagus | ESCC | cellular response to starvation | 110/8552 | 156/18723 | 2.63e-10 | 7.37e-09 | 110 |
| GO:00434143 | Esophagus | ESCC | macromolecule methylation | 199/8552 | 316/18723 | 3.44e-10 | 9.57e-09 | 199 |
| GO:004259419 | Esophagus | ESCC | response to starvation | 133/8552 | 197/18723 | 4.31e-10 | 1.14e-08 | 133 |
| GO:0010639110 | Esophagus | ESCC | negative regulation of organelle organization | 215/8552 | 348/18723 | 8.20e-10 | 2.01e-08 | 215 |
| GO:0036293111 | Esophagus | ESCC | response to decreased oxygen levels | 201/8552 | 322/18723 | 8.37e-10 | 2.04e-08 | 201 |
| GO:00322592 | Esophagus | ESCC | methylation | 222/8552 | 364/18723 | 2.26e-09 | 5.09e-08 | 222 |
| GO:005149520 | Esophagus | ESCC | positive regulation of cytoskeleton organization | 147/8552 | 226/18723 | 2.93e-09 | 6.38e-08 | 147 |
| GO:0051258111 | Esophagus | ESCC | protein polymerization | 183/8552 | 297/18723 | 1.94e-08 | 3.75e-07 | 183 |
| GO:000701527 | Esophagus | ESCC | actin filament organization | 259/8552 | 442/18723 | 2.37e-08 | 4.50e-07 | 259 |
| Page: 1 2 3 |
| Pathway ID | Tissue | Disease Stage | Description | Gene Ratio | Bg Ratio | pvalue | p.adjust | qvalue | Count |
| Page: 1 |
Top |
Cell-cell communication analysis |
| Identification of potential cell-cell interactions between two cell types and their ligand-receptor pairs for different disease states |
| Ligand | Receptor | LRpair | Pathway | Tissue | Disease Stage |
| Page: 1 |
Top |
Single-cell gene regulatory network inference analysis |
| Find out the significant the regulons (TFs) and the target genes of each regulon across cell types for different disease states |
| TF | Cell Type | Tissue | Disease Stage | Target Gene | RSS | Regulon Activity |
| ∗The dot plots of a searched regulon are shown for all cell subpopulations in each disease state of each tissue based on the regulon specific score inferred using pySCENIC and by calculating the average expression. |
| Page: 1 |
Top |
Somatic mutation of malignant transformation related genes |
| Annotation of somatic variants for genes involved in malignant transformation |
| Hugo Symbol | Variant Class | Variant Classification | dbSNP RS | HGVSc | HGVSp | HGVSp Short | SWISSPROT | BIOTYPE | SIFT | PolyPhen | Tumor Sample Barcode | Tissue | Histology | Sex | Age | Stage | Therapy Types | Drugs | Outcome |
| PICK1 | SNV | Missense_Mutation | novel | c.535N>A | p.Glu179Lys | p.E179K | Q9NRD5 | protein_coding | tolerated(0.47) | benign(0.003) | TCGA-A2-A0CX-01 | Breast | breast invasive carcinoma | Female | <65 | I/II | Chemotherapy | adriamycin | SD |
| PICK1 | SNV | Missense_Mutation | c.205N>A | p.Glu69Lys | p.E69K | Q9NRD5 | protein_coding | deleterious(0) | possibly_damaging(0.836) | TCGA-AC-A23H-01 | Breast | breast invasive carcinoma | Female | >=65 | I/II | Unknown | Unknown | PD | |
| PICK1 | SNV | Missense_Mutation | rs759886998 | c.229N>G | p.Ser77Ala | p.S77A | Q9NRD5 | protein_coding | tolerated(0.08) | benign(0.013) | TCGA-AO-A0J4-01 | Breast | breast invasive carcinoma | Female | <65 | I/II | Chemotherapy | doxorubicin | SD |
| PICK1 | SNV | Missense_Mutation | rs759886998 | c.229N>G | p.Ser77Ala | p.S77A | Q9NRD5 | protein_coding | tolerated(0.08) | benign(0.013) | TCGA-D8-A1JH-01 | Breast | breast invasive carcinoma | Female | <65 | I/II | Hormone Therapy | nolvadex | SD |
| PICK1 | SNV | Missense_Mutation | rs200906170 | c.613N>A | p.Glu205Lys | p.E205K | Q9NRD5 | protein_coding | tolerated(0.08) | possibly_damaging(0.651) | TCGA-GM-A2D9-01 | Breast | breast invasive carcinoma | Female | >=65 | I/II | Hormone Therapy | arimidex | SD |
| PICK1 | insertion | Frame_Shift_Ins | novel | c.190_191insCCTCTGTTTCCCAGGCTCAAGCGATCCTCCCACC | p.Val64AlafsTer17 | p.V64Afs*17 | Q9NRD5 | protein_coding | TCGA-B6-A0IK-01 | Breast | breast invasive carcinoma | Female | <65 | III/IV | Unknown | Unknown | PD | ||
| PICK1 | insertion | Frame_Shift_Ins | novel | c.503_504insTAGCGAGAGTCCCCCGG | p.Glu168AspfsTer32 | p.E168Dfs*32 | Q9NRD5 | protein_coding | TCGA-BH-A0B1-01 | Breast | breast invasive carcinoma | Female | >=65 | I/II | Chemotherapy | adriamycin | SD | ||
| PICK1 | SNV | Missense_Mutation | novel | c.868N>A | p.Gly290Ser | p.G290S | Q9NRD5 | protein_coding | deleterious(0) | probably_damaging(0.999) | TCGA-2W-A8YY-01 | Cervix | cervical & endocervical cancer | Female | <65 | I/II | Chemotherapy | cisplatin | CR |
| PICK1 | SNV | Missense_Mutation | novel | c.887N>C | p.Leu296Pro | p.L296P | Q9NRD5 | protein_coding | deleterious(0.03) | probably_damaging(0.981) | TCGA-C5-A902-01 | Cervix | cervical & endocervical cancer | Female | <65 | I/II | Chemotherapy | cisplatin | SD |
| PICK1 | SNV | Missense_Mutation | c.920N>A | p.Arg307His | p.R307H | Q9NRD5 | protein_coding | deleterious(0) | possibly_damaging(0.787) | TCGA-AA-3949-01 | Colorectum | colon adenocarcinoma | Female | >=65 | III/IV | Unknown | Unknown | SD |
| Page: 1 2 3 4 5 |
Top |
Related drugs of malignant transformation related genes |
| Identification of chemicals and drugs interact with genes involved in malignant transfromation |
| (DGIdb 4.0) |
| Entrez ID | Symbol | Category | Interaction Types | Drug Claim Name | Drug Name | PMIDs |
| 9463 | PICK1 | KINASE, TRANSPORTER | methamphetamine | METHAMPHETAMINE | 17606663 |
| Page: 1 |

Copyright 2023-Present -The University of Texas Health Science Center at Houston |