
|
|||||
|
 | |
| |
| |
| |
| |
| |
|
Gene: PICALM |
Gene summary for PICALM |
| Gene information | Species | Human | Gene symbol | PICALM | Gene ID | 8301 |
| Gene name | phosphatidylinositol binding clathrin assembly protein | |
| Gene Alias | CALM | |
| Cytomap | 11q14.2 | |
| Gene Type | protein-coding | GO ID | GO:0000902 | UniProtAcc | A0A024R5L7 |
Top |
Malignant transformation analysis |
| Identification of the aberrant gene expression in precancerous and cancerous lesions by comparing the gene expression of stem-like cells in diseased tissues with normal stem cells |
| Entrez ID | Symbol | Replicates | Species | Organ | Tissue | Adj P-value | Log2FC | Malignancy |
| 8301 | PICALM | CCI_2 | Human | Cervix | CC | 3.23e-10 | 1.19e+00 | 0.5249 |
| 8301 | PICALM | CCI_3 | Human | Cervix | CC | 2.00e-12 | 1.10e+00 | 0.516 |
| 8301 | PICALM | sample3 | Human | Cervix | CC | 3.87e-04 | 1.97e-01 | 0.1387 |
| 8301 | PICALM | T3 | Human | Cervix | CC | 3.49e-05 | 2.00e-01 | 0.1389 |
| 8301 | PICALM | HTA11_3410_2000001011 | Human | Colorectum | AD | 1.07e-11 | -4.90e-01 | 0.0155 |
| 8301 | PICALM | HTA11_696_2000001011 | Human | Colorectum | AD | 1.54e-05 | -3.44e-01 | -0.1464 |
| 8301 | PICALM | HTA11_866_3004761011 | Human | Colorectum | AD | 5.22e-13 | -5.51e-01 | 0.096 |
| 8301 | PICALM | HTA11_8622_2000001021 | Human | Colorectum | SER | 1.15e-03 | -5.38e-01 | 0.0528 |
| 8301 | PICALM | HTA11_7696_3000711011 | Human | Colorectum | AD | 7.90e-20 | -4.77e-01 | 0.0674 |
| 8301 | PICALM | HTA11_6818_2000001021 | Human | Colorectum | AD | 4.15e-03 | -4.42e-01 | 0.0588 |
| 8301 | PICALM | HTA11_99999973899_84307 | Human | Colorectum | MSS | 3.97e-02 | -4.39e-01 | 0.2585 |
| 8301 | PICALM | HTA11_99999974143_84620 | Human | Colorectum | MSS | 1.28e-28 | -6.22e-01 | 0.3005 |
| 8301 | PICALM | A002-C-010 | Human | Colorectum | FAP | 6.48e-03 | -1.80e-01 | 0.242 |
| 8301 | PICALM | A001-C-207 | Human | Colorectum | FAP | 2.67e-04 | -2.93e-01 | 0.1278 |
| 8301 | PICALM | A015-C-203 | Human | Colorectum | FAP | 7.74e-43 | -6.39e-01 | -0.1294 |
| 8301 | PICALM | A015-C-204 | Human | Colorectum | FAP | 2.19e-11 | -4.34e-01 | -0.0228 |
| 8301 | PICALM | A014-C-040 | Human | Colorectum | FAP | 1.46e-07 | -6.11e-01 | -0.1184 |
| 8301 | PICALM | A002-C-201 | Human | Colorectum | FAP | 3.19e-20 | -4.90e-01 | 0.0324 |
| 8301 | PICALM | A002-C-203 | Human | Colorectum | FAP | 9.37e-08 | -2.93e-01 | 0.2786 |
| 8301 | PICALM | A001-C-119 | Human | Colorectum | FAP | 5.15e-12 | -5.34e-01 | -0.1557 |
| Page: 1 2 3 4 5 6 7 8 9 10 11 |
| Tissue | Expression Dynamics | Abbreviation |
| Cervix | 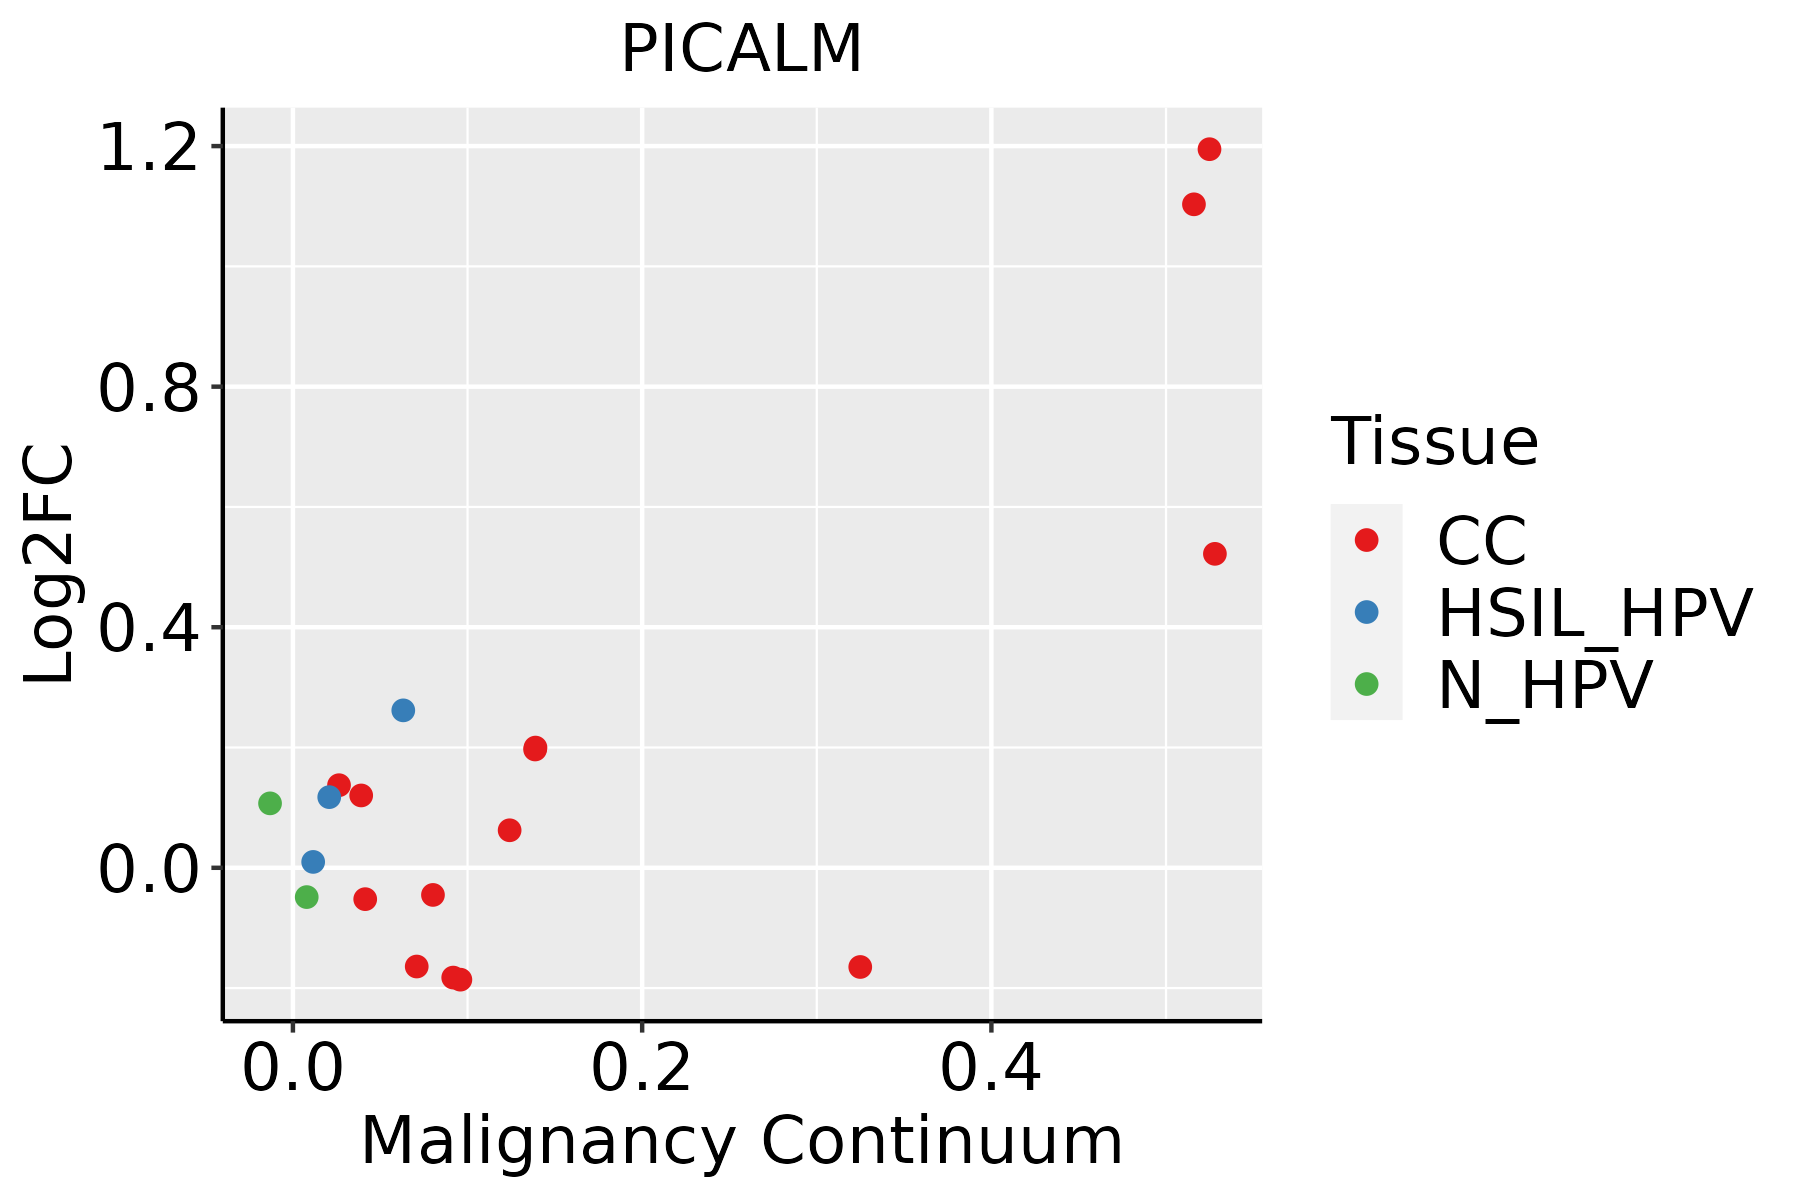 | CC: Cervix cancer |
| HSIL_HPV: HPV-infected high-grade squamous intraepithelial lesions | ||
| N_HPV: HPV-infected normal cervix | ||
| Colorectum (GSE201348) |  | FAP: Familial adenomatous polyposis |
| CRC: Colorectal cancer | ||
| Colorectum (HTA11) |  | AD: Adenomas |
| SER: Sessile serrated lesions | ||
| MSI-H: Microsatellite-high colorectal cancer | ||
| MSS: Microsatellite stable colorectal cancer | ||
| Endometrium | 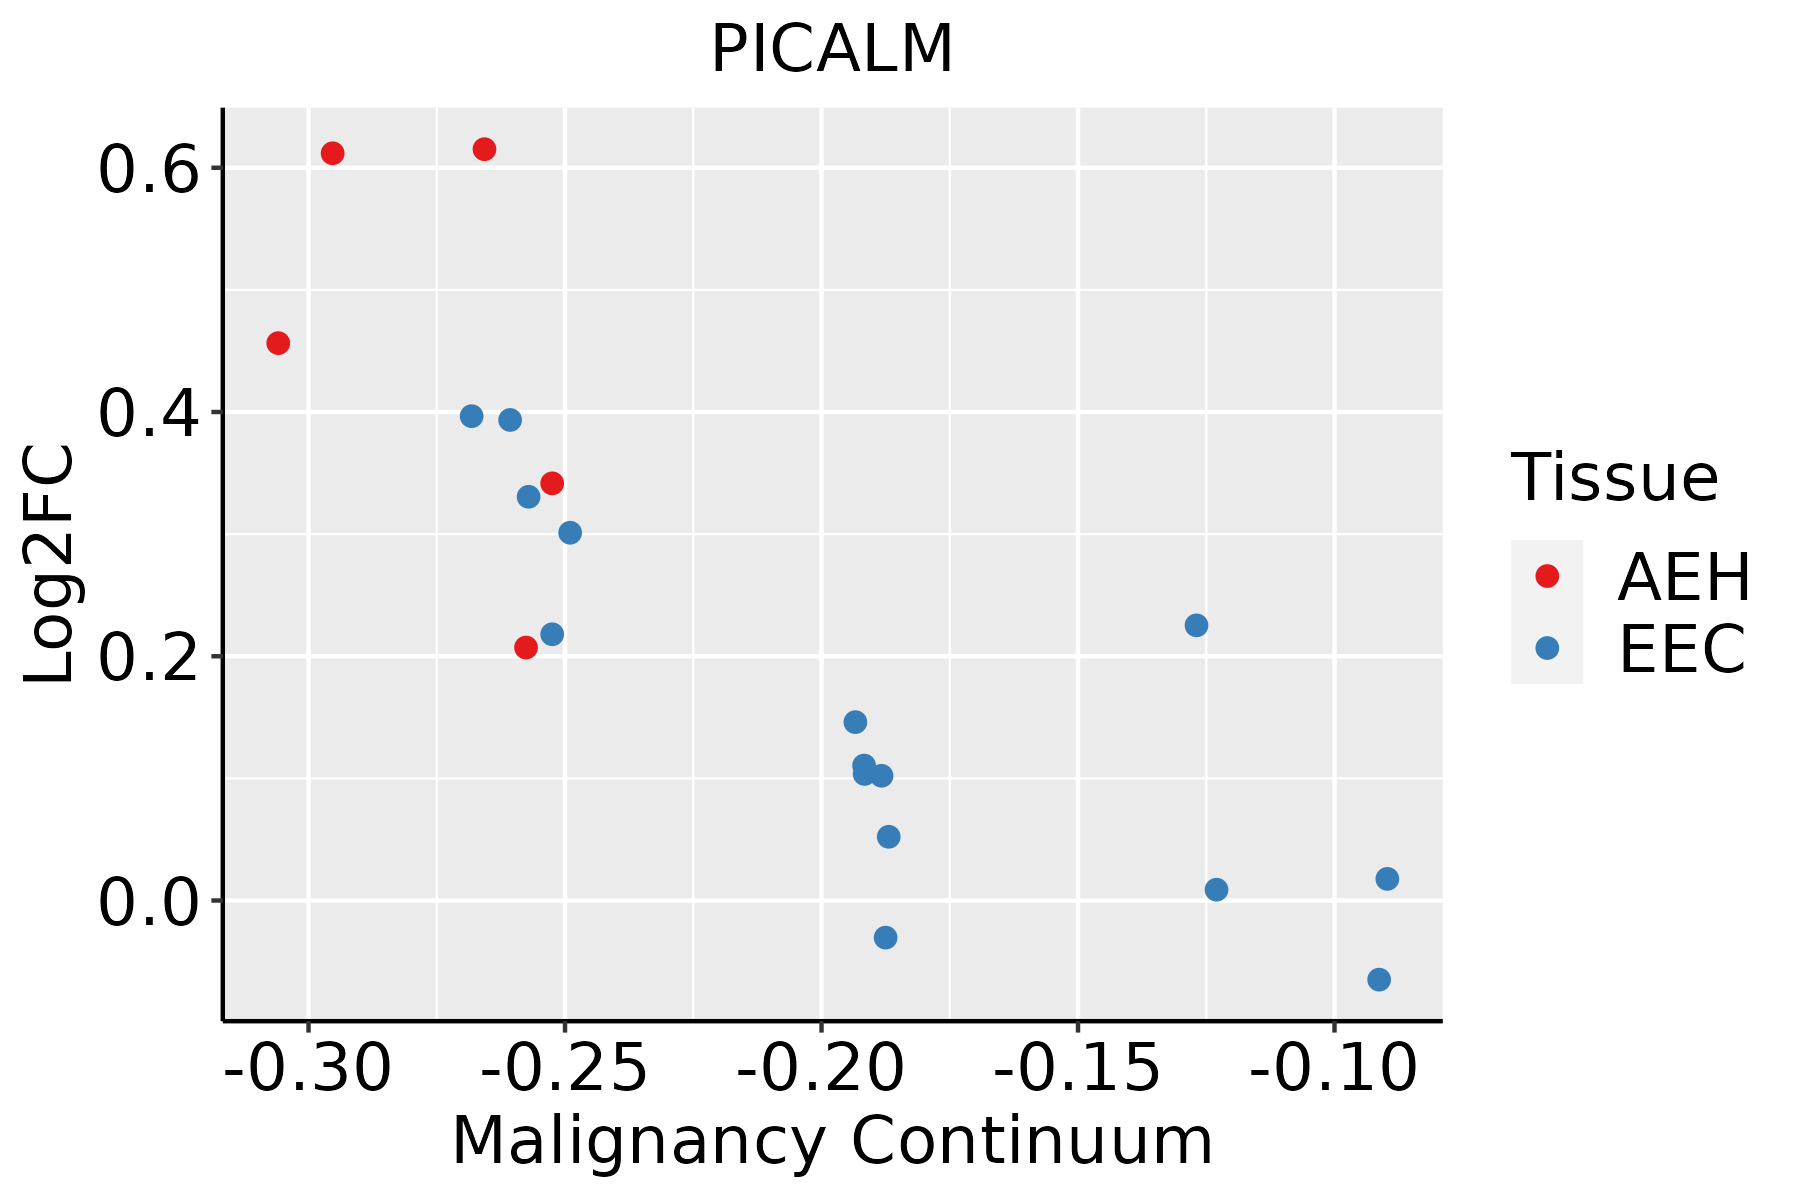 | AEH: Atypical endometrial hyperplasia |
| EEC: Endometrioid Cancer | ||
| Esophagus |  | ESCC: Esophageal squamous cell carcinoma |
| HGIN: High-grade intraepithelial neoplasias | ||
| LGIN: Low-grade intraepithelial neoplasias | ||
| Liver |  | HCC: Hepatocellular carcinoma |
| NAFLD: Non-alcoholic fatty liver disease | ||
| Lung |  | AAH: Atypical adenomatous hyperplasia |
| AIS: Adenocarcinoma in situ | ||
| IAC: Invasive lung adenocarcinoma | ||
| MIA: Minimally invasive adenocarcinoma | ||
| Oral Cavity |  | EOLP: Erosive Oral lichen planus |
| LP: leukoplakia | ||
| NEOLP: Non-erosive oral lichen planus | ||
| OSCC: Oral squamous cell carcinoma | ||
| Prostate | 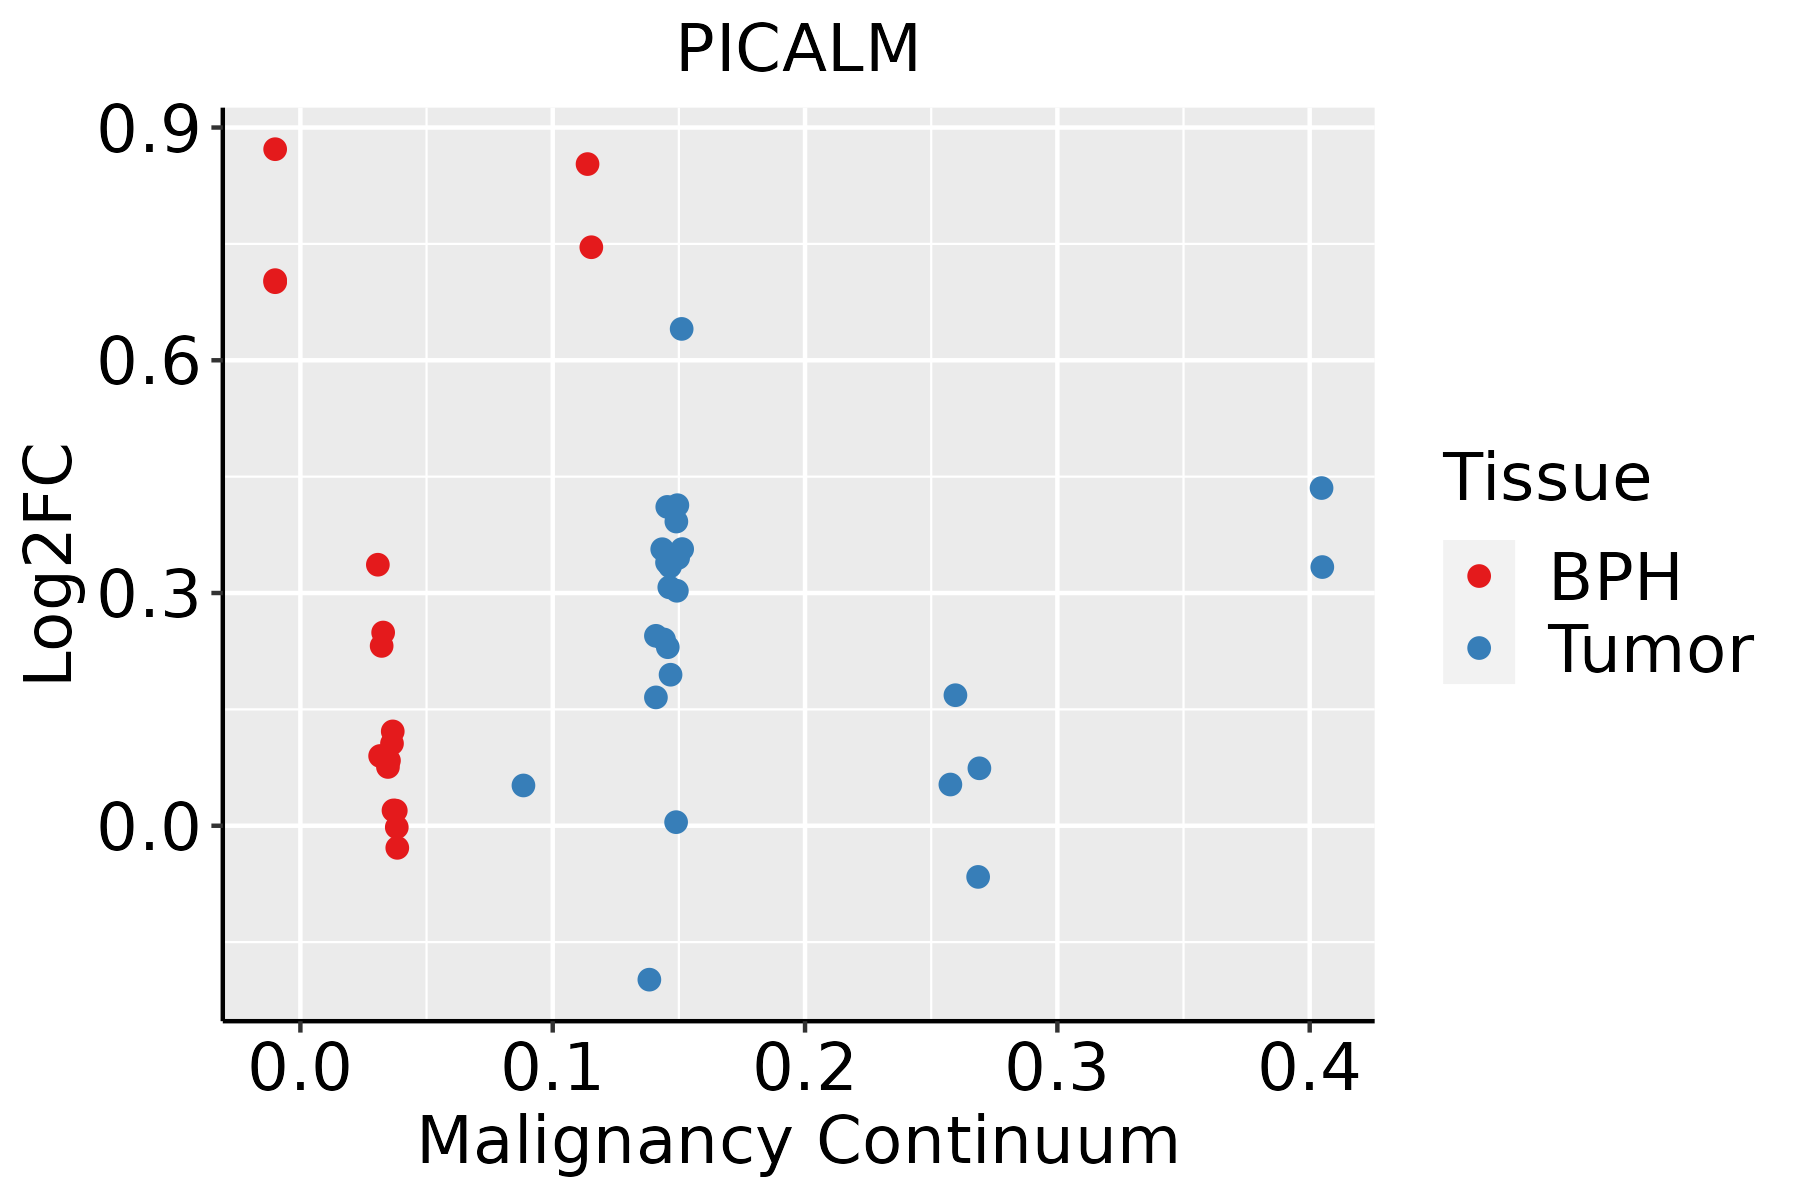 | BPH: Benign Prostatic Hyperplasia |
| Skin |  | AK: Actinic keratosis |
| cSCC: Cutaneous squamous cell carcinoma | ||
| SCCIS:squamous cell carcinoma in situ | ||
| Thyroid |  | ATC: Anaplastic thyroid cancer |
| HT: Hashimoto's thyroiditis | ||
| PTC: Papillary thyroid cancer |
| ∗log2FC in expression of this searched gene in stem-like cells from each diseased tissue sample relative to stem-like cells in normal samples in each tissue plotted against the malignancy continuum. Samples are colored based on if they are from different disease stage. |
Top |
Malignant transformation related pathway analysis |
| Find out the enriched GO biological processes and KEGG pathways involved in transition from healthy to precancer to cancer |
| Tissue | Disease Stage | Enriched GO biological Processes |
| Colorectum | AD |  |
| Colorectum | SER |  |
| Colorectum | MSS |  |
| Colorectum | MSI-H |  |
| Colorectum | FAP |  |
| ∗Top 15 enriched GO BP terms are showed in the bar plot of each disease state in each tissue. Each row represents a significant GO biological process which is colored according to the -log10(p.adjust). |
| Page: 1 2 3 4 5 6 7 8 9 |
| GO ID | Tissue | Disease Stage | Description | Gene Ratio | Bg Ratio | pvalue | p.adjust | Count |
| GO:005254710 | Cervix | CC | regulation of peptidase activity | 112/2311 | 461/18723 | 6.70e-13 | 3.08e-10 | 112 |
| GO:004586210 | Cervix | CC | positive regulation of proteolysis | 95/2311 | 372/18723 | 1.84e-12 | 6.86e-10 | 95 |
| GO:005254810 | Cervix | CC | regulation of endopeptidase activity | 103/2311 | 432/18723 | 1.89e-11 | 5.14e-09 | 103 |
| GO:007265910 | Cervix | CC | protein localization to plasma membrane | 73/2311 | 284/18723 | 4.95e-10 | 6.73e-08 | 73 |
| GO:001095210 | Cervix | CC | positive regulation of peptidase activity | 54/2311 | 197/18723 | 8.06e-09 | 6.99e-07 | 54 |
| GO:19907788 | Cervix | CC | protein localization to cell periphery | 78/2311 | 333/18723 | 1.22e-08 | 9.73e-07 | 78 |
| GO:004586110 | Cervix | CC | negative regulation of proteolysis | 80/2311 | 351/18723 | 2.88e-08 | 1.98e-06 | 80 |
| GO:00430877 | Cervix | CC | regulation of GTPase activity | 79/2311 | 348/18723 | 4.21e-08 | 2.60e-06 | 79 |
| GO:001095010 | Cervix | CC | positive regulation of endopeptidase activity | 48/2311 | 179/18723 | 1.12e-07 | 5.71e-06 | 48 |
| GO:00075689 | Cervix | CC | aging | 75/2311 | 339/18723 | 2.75e-07 | 1.13e-05 | 75 |
| GO:00513469 | Cervix | CC | negative regulation of hydrolase activity | 81/2311 | 379/18723 | 4.27e-07 | 1.67e-05 | 81 |
| GO:00163587 | Cervix | CC | dendrite development | 58/2311 | 243/18723 | 4.52e-07 | 1.76e-05 | 58 |
| GO:00104669 | Cervix | CC | negative regulation of peptidase activity | 60/2311 | 262/18723 | 1.27e-06 | 4.34e-05 | 60 |
| GO:001095110 | Cervix | CC | negative regulation of endopeptidase activity | 56/2311 | 252/18723 | 7.43e-06 | 1.74e-04 | 56 |
| GO:003425010 | Cervix | CC | positive regulation of cellular amide metabolic process | 40/2311 | 162/18723 | 1.11e-05 | 2.41e-04 | 40 |
| GO:00325359 | Cervix | CC | regulation of cellular component size | 76/2311 | 383/18723 | 1.66e-05 | 3.21e-04 | 76 |
| GO:19052455 | Cervix | CC | regulation of aspartic-type peptidase activity | 8/2311 | 12/18723 | 1.66e-05 | 3.21e-04 | 8 |
| GO:00615647 | Cervix | CC | axon development | 89/2311 | 467/18723 | 1.71e-05 | 3.27e-04 | 89 |
| GO:000690010 | Cervix | CC | vesicle budding from membrane | 20/2311 | 61/18723 | 2.50e-05 | 4.28e-04 | 20 |
| GO:00068987 | Cervix | CC | receptor-mediated endocytosis | 53/2311 | 244/18723 | 2.52e-05 | 4.29e-04 | 53 |
| Page: 1 2 3 4 5 6 7 8 9 10 11 12 13 14 15 16 17 18 19 20 21 22 23 24 25 26 27 28 29 30 31 32 33 34 35 36 37 38 39 40 41 42 43 44 45 46 47 48 49 50 51 52 53 54 |
| Pathway ID | Tissue | Disease Stage | Description | Gene Ratio | Bg Ratio | pvalue | p.adjust | qvalue | Count |
| Page: 1 |
Top |
Cell-cell communication analysis |
| Identification of potential cell-cell interactions between two cell types and their ligand-receptor pairs for different disease states |
| Ligand | Receptor | LRpair | Pathway | Tissue | Disease Stage |
| Page: 1 |
Top |
Single-cell gene regulatory network inference analysis |
| Find out the significant the regulons (TFs) and the target genes of each regulon across cell types for different disease states |
| TF | Cell Type | Tissue | Disease Stage | Target Gene | RSS | Regulon Activity |
| ∗The dot plots of a searched regulon are shown for all cell subpopulations in each disease state of each tissue based on the regulon specific score inferred using pySCENIC and by calculating the average expression. |
| Page: 1 |
Top |
Somatic mutation of malignant transformation related genes |
| Annotation of somatic variants for genes involved in malignant transformation |
| Hugo Symbol | Variant Class | Variant Classification | dbSNP RS | HGVSc | HGVSp | HGVSp Short | SWISSPROT | BIOTYPE | SIFT | PolyPhen | Tumor Sample Barcode | Tissue | Histology | Sex | Age | Stage | Therapy Types | Drugs | Outcome |
| PICALM | SNV | Missense_Mutation | c.1625C>T | p.Ser542Leu | p.S542L | Q13492 | protein_coding | deleterious(0.02) | possibly_damaging(0.471) | TCGA-AC-A23H-01 | Breast | breast invasive carcinoma | Female | >=65 | I/II | Unknown | Unknown | PD | |
| PICALM | SNV | Missense_Mutation | novel | c.1612N>A | p.Asp538Asn | p.D538N | Q13492 | protein_coding | tolerated(1) | benign(0.015) | TCGA-BH-A0B6-01 | Breast | breast invasive carcinoma | Female | <65 | I/II | Unknown | Unknown | SD |
| PICALM | SNV | Missense_Mutation | c.886N>A | p.Ala296Thr | p.A296T | Q13492 | protein_coding | tolerated(0.05) | benign(0.063) | TCGA-C8-A8HP-01 | Breast | breast invasive carcinoma | Female | <65 | III/IV | Chemotherapy | 5-fluorouracil | CR | |
| PICALM | insertion | Nonsense_Mutation | novel | c.1866_1867insTAAGAAAGAT | p.Met623Ter | p.M623* | Q13492 | protein_coding | TCGA-AC-A3QQ-01 | Breast | breast invasive carcinoma | Female | <65 | I/II | Unknown | Unknown | SD | ||
| PICALM | SNV | Missense_Mutation | novel | c.887N>T | p.Ala296Val | p.A296V | Q13492 | protein_coding | deleterious(0.02) | possibly_damaging(0.719) | TCGA-2W-A8YY-01 | Cervix | cervical & endocervical cancer | Female | <65 | I/II | Chemotherapy | cisplatin | CR |
| PICALM | SNV | Missense_Mutation | c.59C>T | p.Ser20Phe | p.S20F | Q13492 | protein_coding | deleterious(0) | possibly_damaging(0.686) | TCGA-EA-A3HT-01 | Cervix | cervical & endocervical cancer | Female | >=65 | I/II | Unknown | Unknown | SD | |
| PICALM | SNV | Missense_Mutation | c.632A>G | p.Tyr211Cys | p.Y211C | Q13492 | protein_coding | deleterious(0) | probably_damaging(0.92) | TCGA-JX-A3Q0-01 | Cervix | cervical & endocervical cancer | Female | <65 | III/IV | Unknown | Unknown | SD | |
| PICALM | SNV | Missense_Mutation | rs377101068 | c.1777N>G | p.Met593Val | p.M593V | Q13492 | protein_coding | tolerated(0.34) | benign(0.019) | TCGA-MA-AA42-01 | Cervix | cervical & endocervical cancer | Female | >=65 | I/II | Unknown | Unknown | SD |
| PICALM | SNV | Missense_Mutation | rs760482423 | c.1228N>G | p.Thr410Ala | p.T410A | Q13492 | protein_coding | tolerated(0.76) | benign(0.003) | TCGA-A6-5665-01 | Colorectum | colon adenocarcinoma | Female | >=65 | I/II | Unknown | Unknown | PD |
| PICALM | SNV | Missense_Mutation | novel | c.523A>G | p.Met175Val | p.M175V | Q13492 | protein_coding | tolerated(0.08) | benign(0.106) | TCGA-AA-3811-01 | Colorectum | colon adenocarcinoma | Female | >=65 | III/IV | Unknown | Unknown | PD |
| Page: 1 2 3 4 5 6 7 |
Top |
Related drugs of malignant transformation related genes |
| Identification of chemicals and drugs interact with genes involved in malignant transfromation |
| (DGIdb 4.0) |
| Entrez ID | Symbol | Category | Interaction Types | Drug Claim Name | Drug Name | PMIDs |
| 8301 | PICALM | CLINICALLY ACTIONABLE, CELL SURFACE | calcium channel blockers | 24192120 |
| Page: 1 |

Copyright 2023-Present -The University of Texas Health Science Center at Houston |