Schematic overview of the cellular and molecular mechanisms involved in the cancer progression, including the proposed cellular and molecular mechanisms in cancer cells trajectory. AT1: alveolar type 1 cells; AT2: alveolar type 2 cells; AAH: atypical adenomatous hyperplasia; AIS: adenocarcinoma in situ; MIA: minimally invasive adenocarcinoma; IA: invasive adenocarcinoma; EMT: epithelial-mesenchymal transition

Home

Download

Statistics

Help

Contact

Center for Computational Systems Medicine
leaf

Gene summary

leaf

Malignant transformation analysis

leaf

Malignant transformation related pathway analysis

leaf

Cell-cell communication analysis

leaf

Single-cell gene regulatory network inference analysis

leaf

Somatic mutation of malignant transformation related genes

leaf

Related drugs of malignant transformation related genes

Gene: PIBF1

Gene summary for PIBF1

check button Gene summary.

Gene informationSpeciesHuman
Gene symbol

PIBF1

Gene ID

10464

Gene nameprogesterone immunomodulatory binding factor 1
Gene AliasC13orf24
Cytomap13q21.33-q22.1
Gene Typeprotein-coding
GO ID

GO:0000070

UniProtAcc

Q8WXW3


Top

Malignant transformation analysis

check button Identification of the aberrant gene expression in precancerous and cancerous lesions by comparing the gene expression of stem-like cells in diseased tissues with normal stem cells
check button Malignant transformation involving gene list.
Entrez IDSymbolReplicatesSpeciesOrganTissueAdj P-valueLog2FCMalignancy
10464PIBF1CCI_1HumanCervixCC8.76e-067.18e-010.528
10464PIBF1CCI_2HumanCervixCC1.68e-089.02e-010.5249
10464PIBF1CCI_3HumanCervixCC4.58e-138.66e-010.516
10464PIBF1HTA11_3410_2000001011HumanColorectumAD1.31e-18-6.02e-010.0155
10464PIBF1HTA11_347_2000001011HumanColorectumAD1.69e-034.35e-01-0.1954
10464PIBF1HTA11_3361_2000001011HumanColorectumAD1.50e-06-5.60e-01-0.1207
10464PIBF1HTA11_5212_2000001011HumanColorectumAD1.31e-02-6.59e-01-0.2061
10464PIBF1HTA11_866_3004761011HumanColorectumAD4.05e-03-4.12e-010.096
10464PIBF1HTA11_7696_3000711011HumanColorectumAD5.70e-04-3.33e-010.0674
10464PIBF1HTA11_99999970781_79442HumanColorectumMSS1.19e-04-3.56e-010.294
10464PIBF1HTA11_99999965104_69814HumanColorectumMSS2.62e-077.72e-010.281
10464PIBF1A001-C-207HumanColorectumFAP1.00e-03-1.55e-010.1278
10464PIBF1A015-C-203HumanColorectumFAP1.21e-33-4.51e-01-0.1294
10464PIBF1A015-C-204HumanColorectumFAP6.22e-07-2.77e-01-0.0228
10464PIBF1A014-C-040HumanColorectumFAP6.22e-06-3.44e-01-0.1184
10464PIBF1A002-C-201HumanColorectumFAP3.21e-17-2.84e-010.0324
10464PIBF1A001-C-119HumanColorectumFAP7.36e-10-4.60e-01-0.1557
10464PIBF1A001-C-108HumanColorectumFAP1.86e-17-2.78e-01-0.0272
10464PIBF1A002-C-205HumanColorectumFAP1.33e-28-3.64e-01-0.1236
10464PIBF1A001-C-104HumanColorectumFAP1.61e-02-1.07e-010.0184
Page: 1 2 3 4 5 6 7 8 

check button Transcriptomic changes along malignancy continuum.
TissueExpression DynamicsAbbreviation
CervixThe image shows the transcriptomic changes along malignancy continuum.log2FC in expression of this searched gene in stem-like cells from each diseased tissue sample relative to stem-like cells in normal samples in each tissue plotted against the malignancy continuum. Samples are colored based on if they are from different disease stage.CC: Cervix cancer
HSIL_HPV: HPV-infected high-grade squamous intraepithelial lesions
N_HPV: HPV-infected normal cervix
Colorectum (GSE201348)The image shows the transcriptomic changes along malignancy continuum.log2FC in expression of this searched gene in stem-like cells from each diseased tissue sample relative to stem-like cells in normal samples in each tissue plotted against the malignancy continuum. Samples are colored based on if they are from different disease stage.FAP: Familial adenomatous polyposis
CRC: Colorectal cancer
Colorectum (HTA11)The image shows the transcriptomic changes along malignancy continuum.log2FC in expression of this searched gene in stem-like cells from each diseased tissue sample relative to stem-like cells in normal samples in each tissue plotted against the malignancy continuum. Samples are colored based on if they are from different disease stage.AD: Adenomas
SER: Sessile serrated lesions
MSI-H: Microsatellite-high colorectal cancer
MSS: Microsatellite stable colorectal cancer
EndometriumThe image shows the transcriptomic changes along malignancy continuum.log2FC in expression of this searched gene in stem-like cells from each diseased tissue sample relative to stem-like cells in normal samples in each tissue plotted against the malignancy continuum. Samples are colored based on if they are from different disease stage.
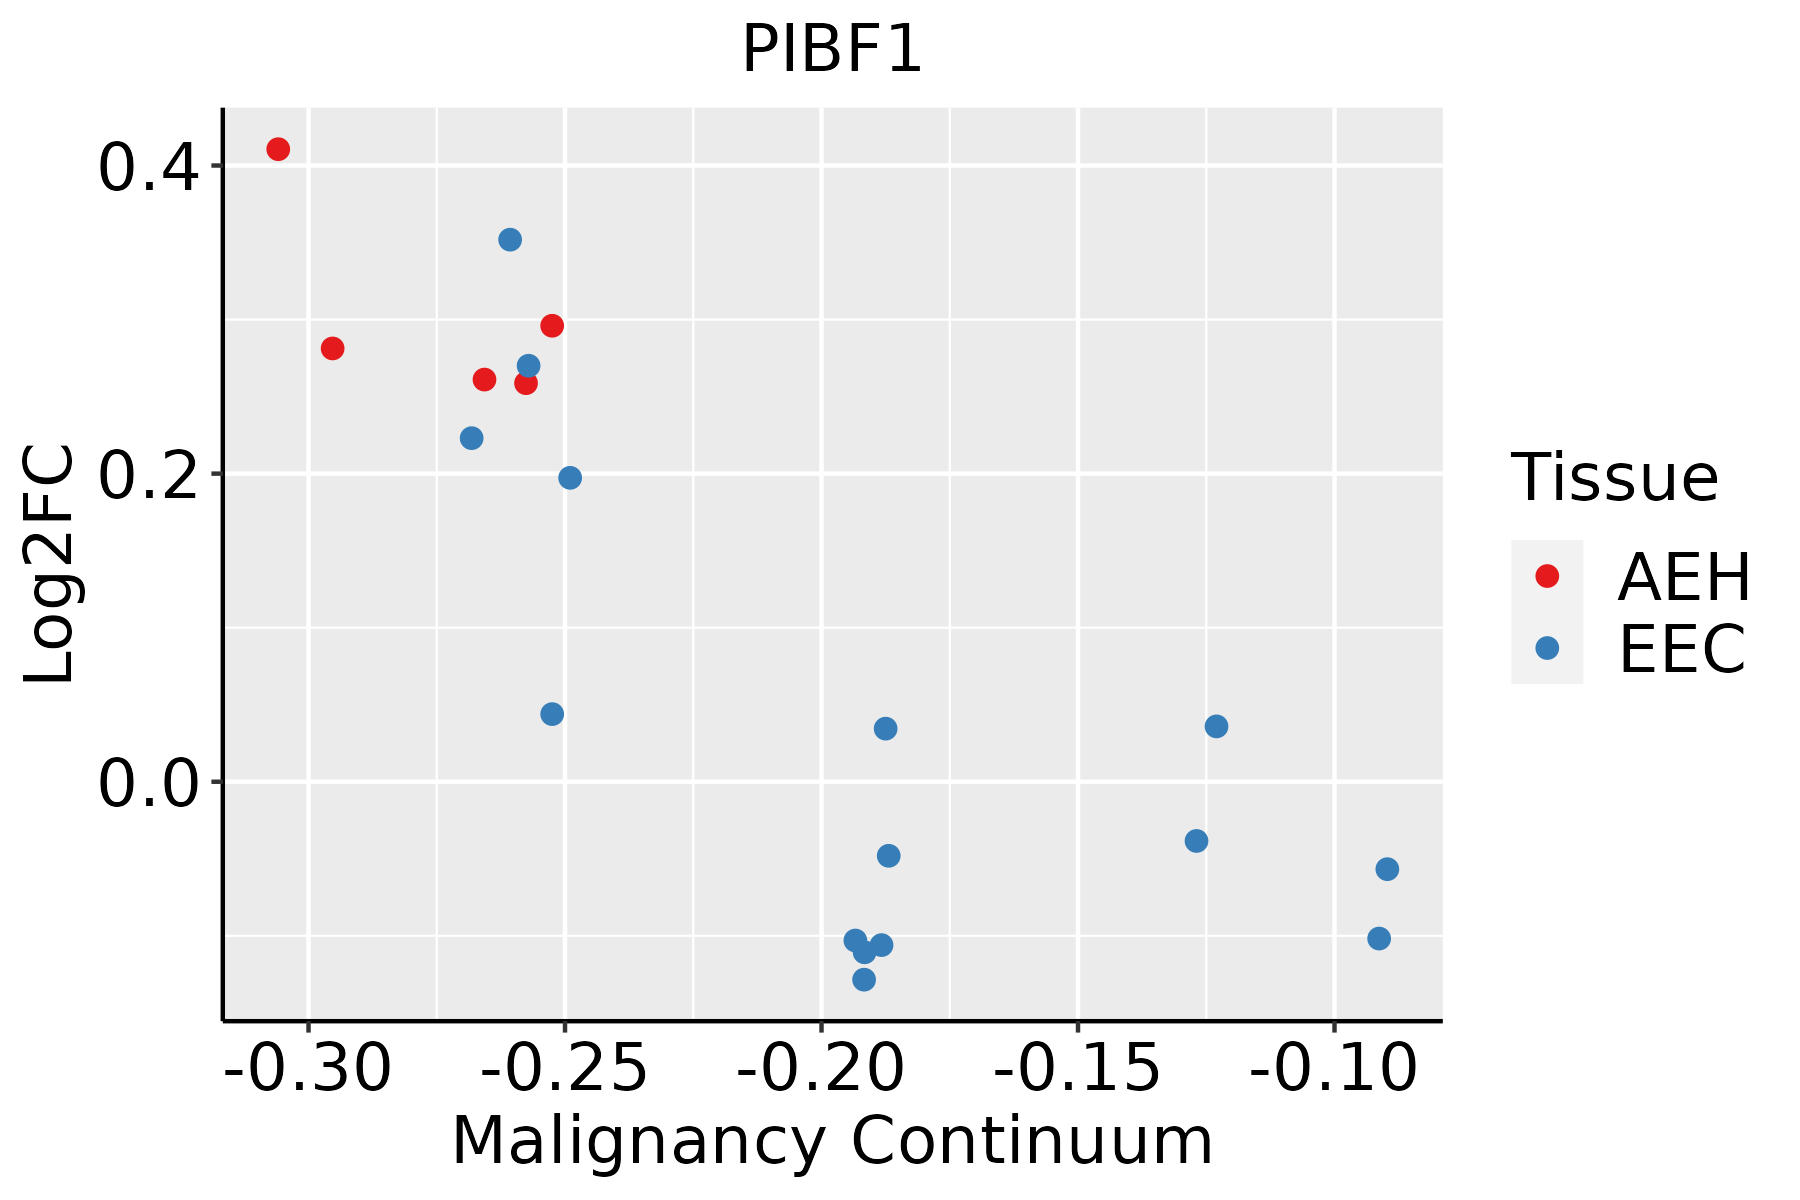
AEH: Atypical endometrial hyperplasia
EEC: Endometrioid Cancer
EsophagusThe image shows the transcriptomic changes along malignancy continuum.log2FC in expression of this searched gene in stem-like cells from each diseased tissue sample relative to stem-like cells in normal samples in each tissue plotted against the malignancy continuum. Samples are colored based on if they are from different disease stage.ESCC: Esophageal squamous cell carcinoma
HGIN: High-grade intraepithelial neoplasias
LGIN: Low-grade intraepithelial neoplasias
LiverThe image shows the transcriptomic changes along malignancy continuum.log2FC in expression of this searched gene in stem-like cells from each diseased tissue sample relative to stem-like cells in normal samples in each tissue plotted against the malignancy continuum. Samples are colored based on if they are from different disease stage.
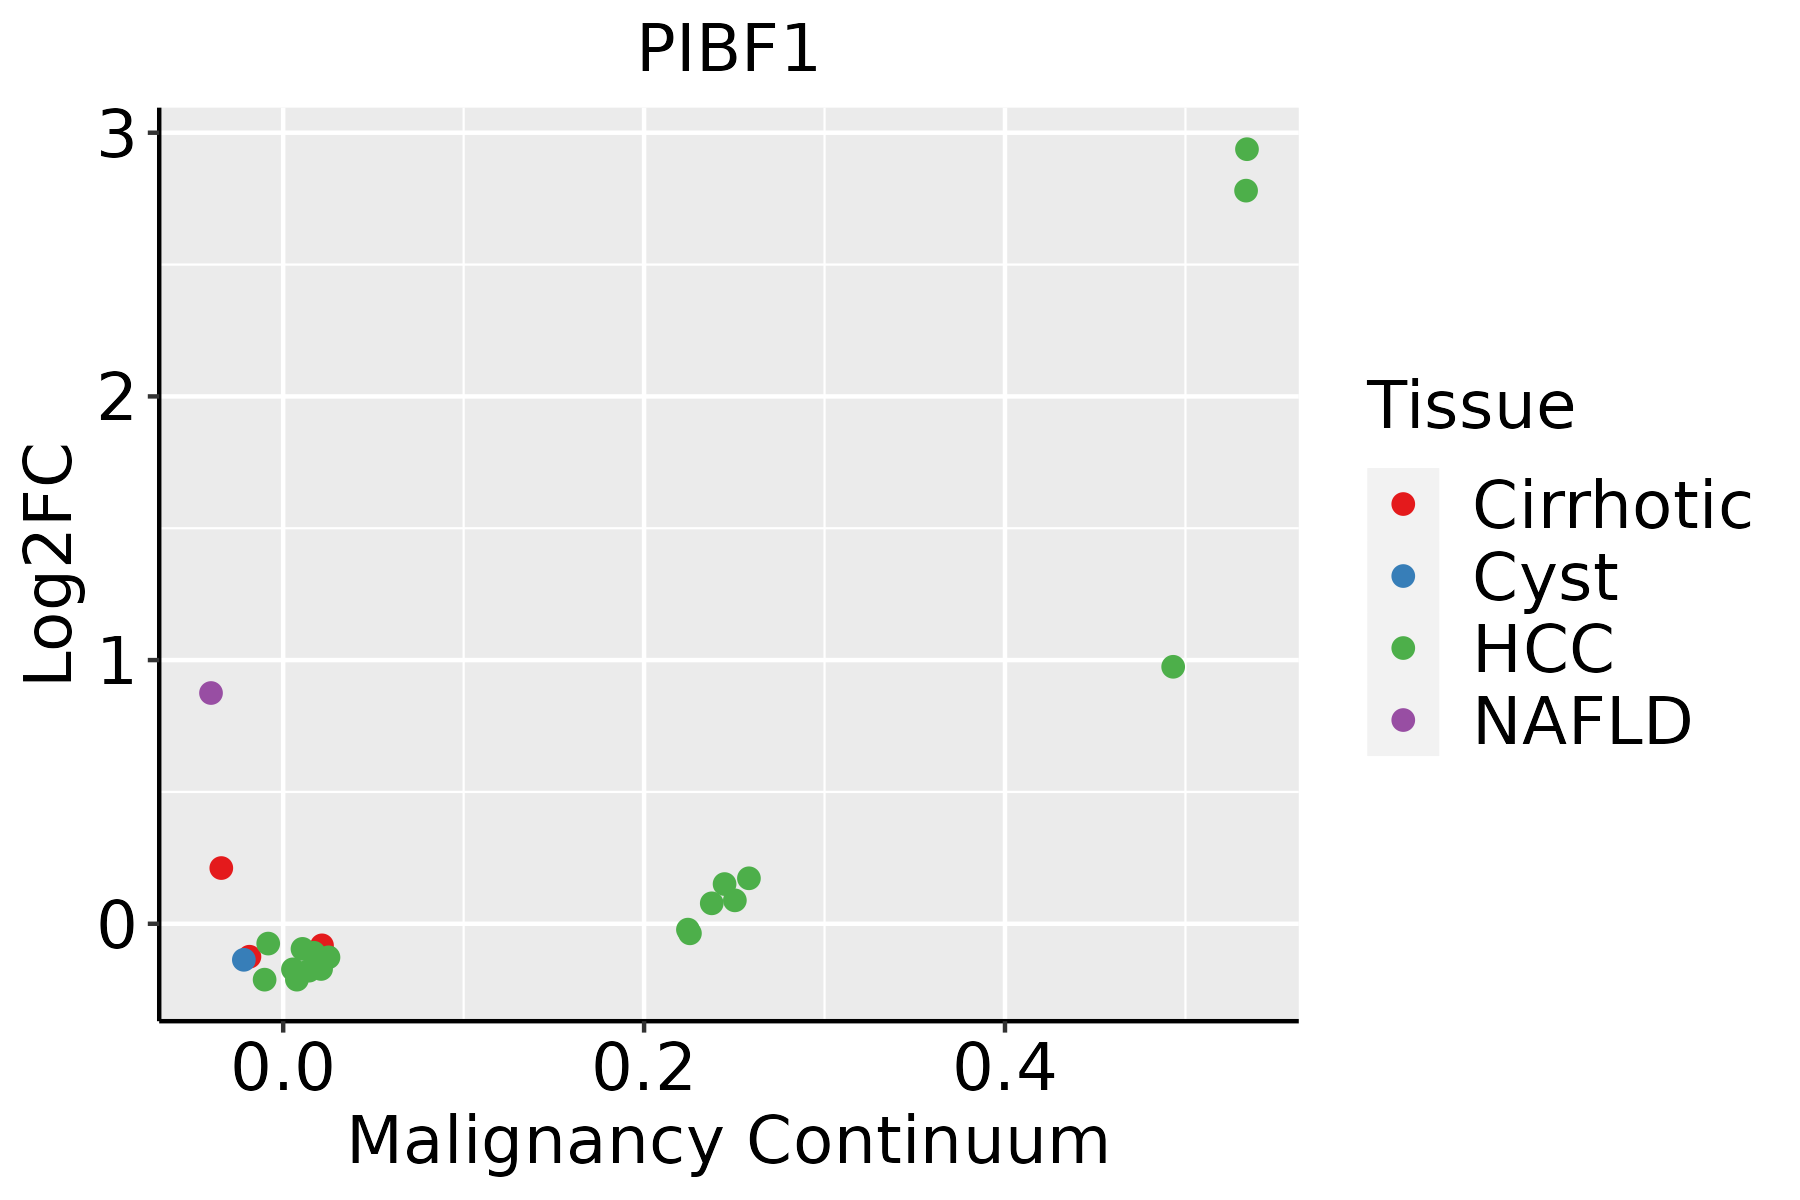
HCC: Hepatocellular carcinoma
NAFLD: Non-alcoholic fatty liver disease
LungThe image shows the transcriptomic changes along malignancy continuum.log2FC in expression of this searched gene in stem-like cells from each diseased tissue sample relative to stem-like cells in normal samples in each tissue plotted against the malignancy continuum. Samples are colored based on if they are from different disease stage.
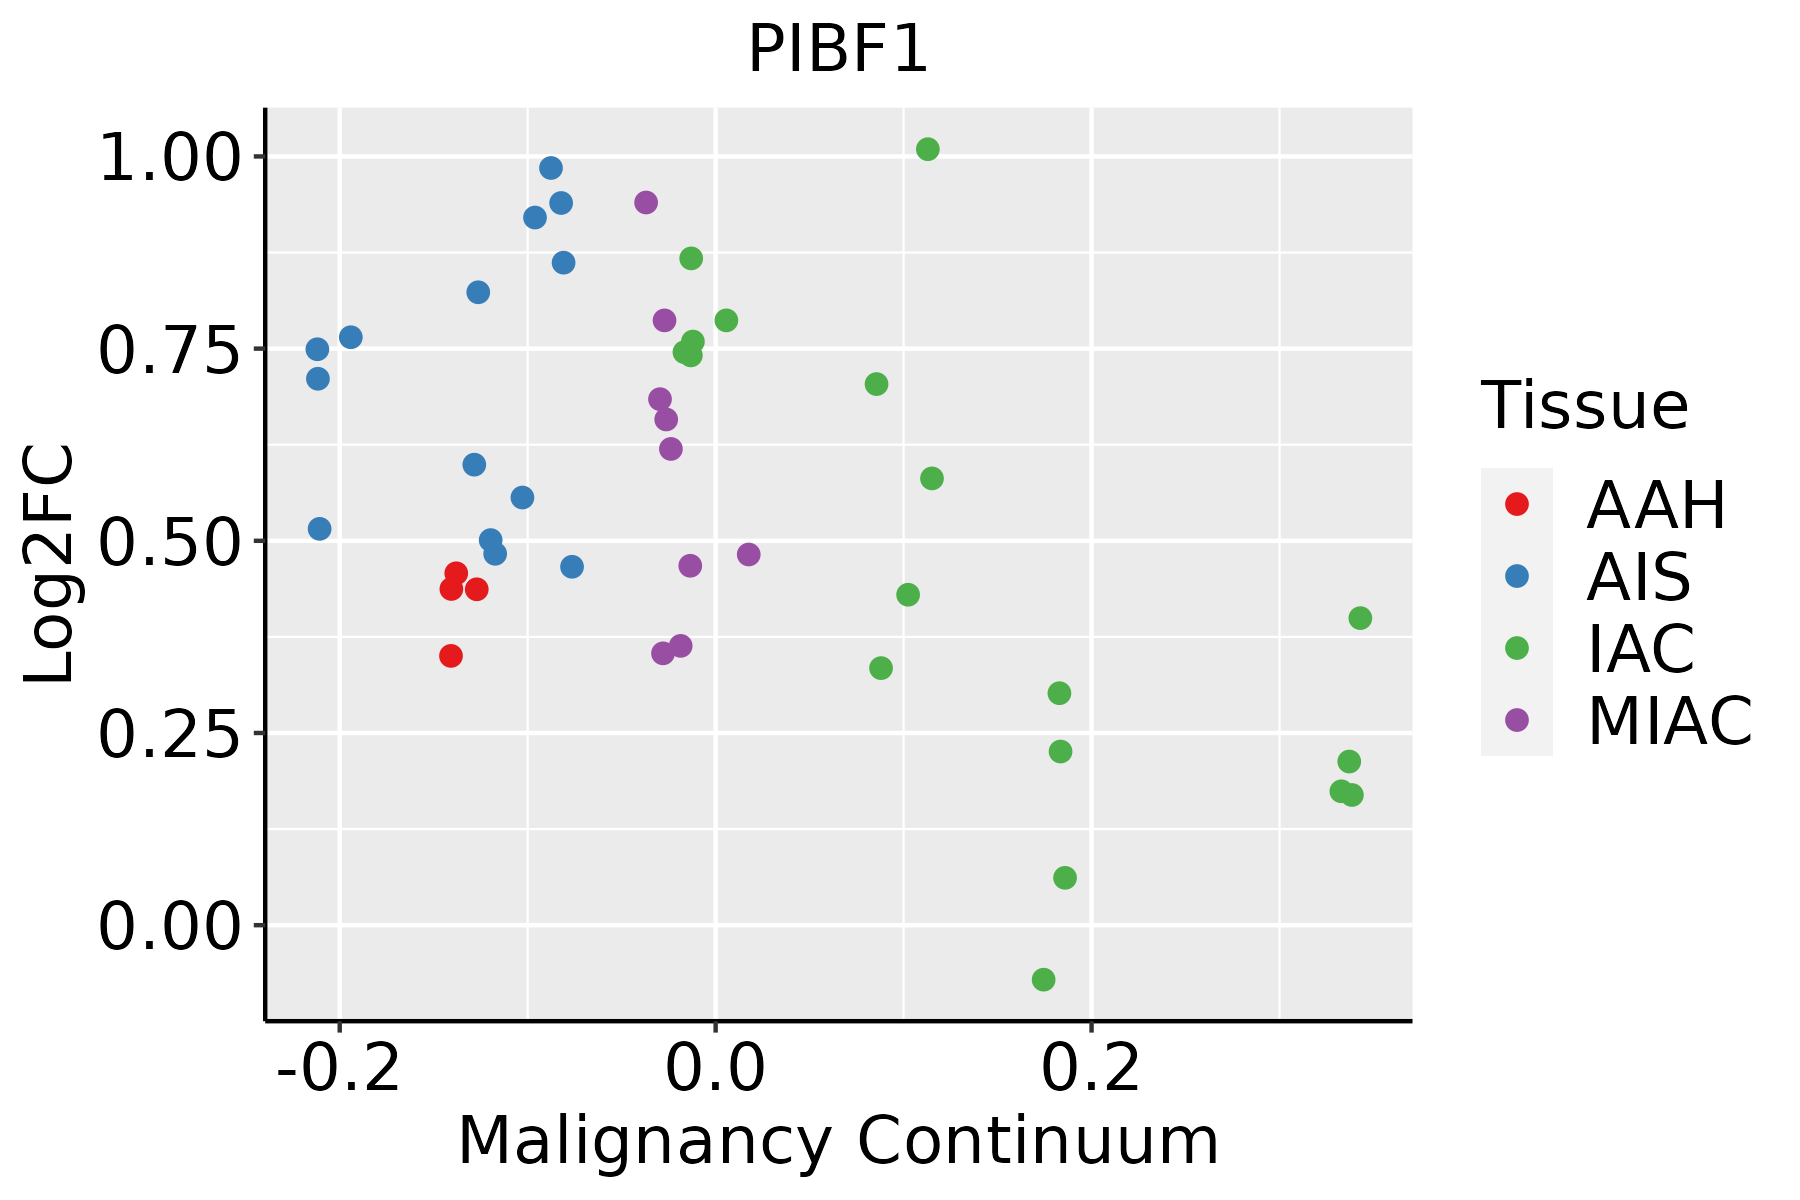
AAH: Atypical adenomatous hyperplasia
AIS: Adenocarcinoma in situ
IAC: Invasive lung adenocarcinoma
MIA: Minimally invasive adenocarcinoma
ProstateThe image shows the transcriptomic changes along malignancy continuum.log2FC in expression of this searched gene in stem-like cells from each diseased tissue sample relative to stem-like cells in normal samples in each tissue plotted against the malignancy continuum. Samples are colored based on if they are from different disease stage.
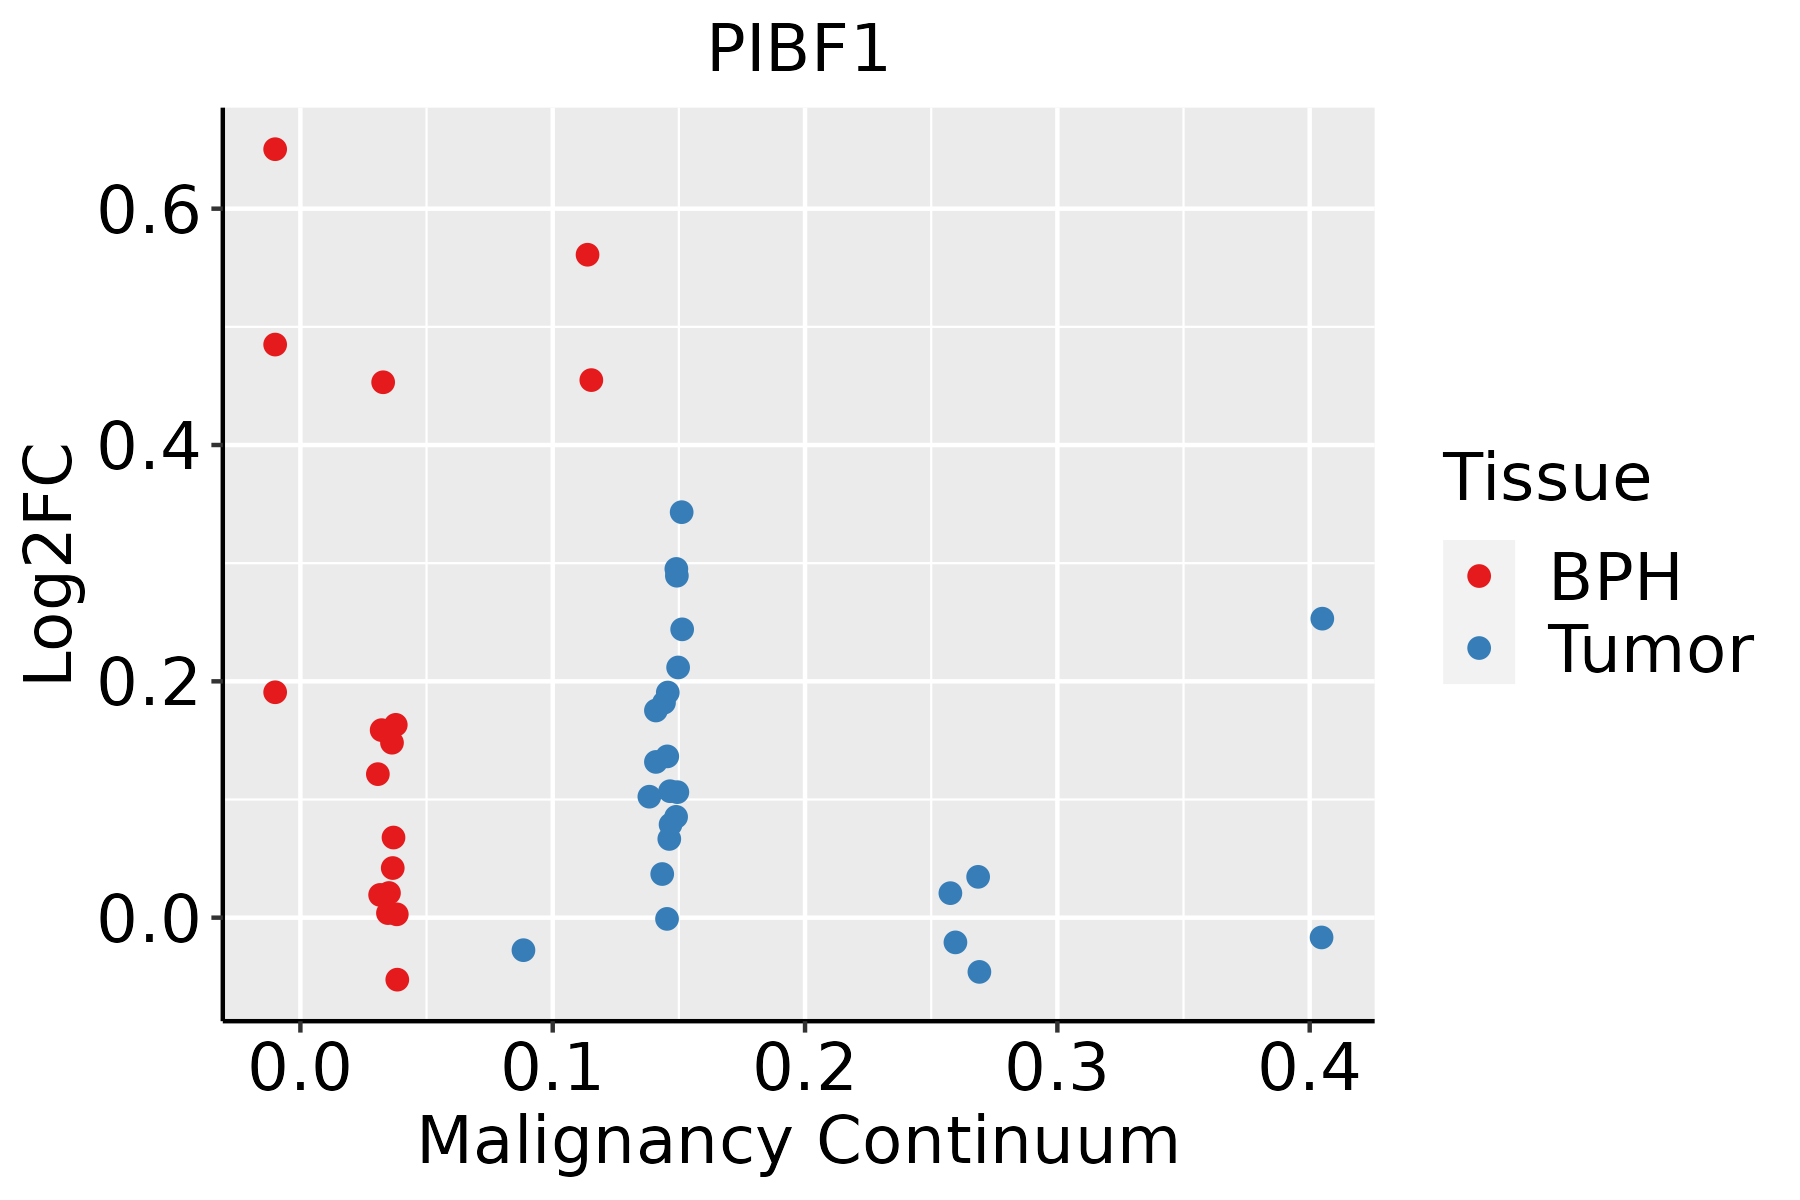
BPH: Benign Prostatic Hyperplasia
ThyroidThe image shows the transcriptomic changes along malignancy continuum.log2FC in expression of this searched gene in stem-like cells from each diseased tissue sample relative to stem-like cells in normal samples in each tissue plotted against the malignancy continuum. Samples are colored based on if they are from different disease stage.ATC: Anaplastic thyroid cancer
HT: Hashimoto's thyroiditis
PTC: Papillary thyroid cancer
∗log2FC in expression of this searched gene in stem-like cells from each diseased tissue sample relative to stem-like cells in normal samples in each tissue plotted against the malignancy continuum. Samples are colored based on if they are from different disease stage.

Top

Malignant transformation related pathway analysis

check buttonFind out the enriched GO biological processes and KEGG pathways involved in transition from healthy to precancer to cancer
check button Figure of enriched GO biological processes.
TissueDisease StageEnriched GO biological Processes
ColorectumADGO analysis - Figure of enriched GO biological processes: Top 15 enriched GO BP terms are showed in the bar plot of each disease state in each tissue. Each row represents a significant GO biological process which is colored according to the -log10(p.adjust).
ColorectumSERGO analysis - Figure of enriched GO biological processes: Top 15 enriched GO BP terms are showed in the bar plot of each disease state in each tissue. Each row represents a significant GO biological process which is colored according to the -log10(p.adjust).
ColorectumMSSGO analysis - Figure of enriched GO biological processes: Top 15 enriched GO BP terms are showed in the bar plot of each disease state in each tissue. Each row represents a significant GO biological process which is colored according to the -log10(p.adjust).
ColorectumMSI-HGO analysis - Figure of enriched GO biological processes: Top 15 enriched GO BP terms are showed in the bar plot of each disease state in each tissue. Each row represents a significant GO biological process which is colored according to the -log10(p.adjust).
ColorectumFAPGO analysis - Figure of enriched GO biological processes: Top 15 enriched GO BP terms are showed in the bar plot of each disease state in each tissue. Each row represents a significant GO biological process which is colored according to the -log10(p.adjust).
∗Top 15 enriched GO BP terms are showed in the bar plot of each disease state in each tissue. Each row represents a significant GO biological process which is colored according to the -log10(p.adjust).
Page: 1 2 3 4 5 6 7 8 9 

check button Enriched GO biological processes.
GO IDTissueDisease StageDescriptionGene RatioBg Ratiopvaluep.adjustCount
GO:003367410CervixCCpositive regulation of kinase activity101/2311467/187238.66e-097.22e-07101
GO:00026837CervixCCnegative regulation of immune system process94/2311434/187232.63e-081.87e-0694
GO:00458608CervixCCpositive regulation of protein kinase activity85/2311386/187235.61e-083.29e-0685
GO:00018197CervixCCpositive regulation of cytokine production95/2311467/187234.88e-071.85e-0595
GO:004593610CervixCCnegative regulation of phosphate metabolic process88/2311441/187232.92e-068.27e-0588
GO:001056310CervixCCnegative regulation of phosphorus metabolic process88/2311442/187233.21e-068.77e-0588
GO:004232610CervixCCnegative regulation of phosphorylation77/2311385/187231.09e-052.38e-0477
GO:0051250CervixCCnegative regulation of lymphocyte activation39/2311157/187231.23e-052.57e-0439
GO:000193310CervixCCnegative regulation of protein phosphorylation69/2311342/187232.29e-054.01e-0469
GO:00516567CervixCCestablishment of organelle localization76/2311390/187233.17e-055.21e-0476
GO:0002695CervixCCnegative regulation of leukocyte activation43/2311187/187233.47e-055.60e-0443
GO:0050866CervixCCnegative regulation of cell activation44/2311210/187232.76e-043.02e-0344
GO:00464564CervixCCicosanoid biosynthetic process15/231156/187232.60e-031.80e-0215
GO:01400143CervixCCmitotic nuclear division50/2311287/187237.27e-033.91e-0250
GO:00482851CervixCCorganelle fission78/2311488/187239.70e-034.79e-0278
GO:00015165CervixCCprostaglandin biosynthetic process9/231131/187231.04e-024.97e-029
GO:00464575CervixCCprostanoid biosynthetic process9/231131/187231.04e-024.97e-029
GO:0051656ColorectumADestablishment of organelle localization131/3918390/187233.00e-092.06e-07131
GO:0010563ColorectumADnegative regulation of phosphorus metabolic process130/3918442/187231.26e-052.76e-04130
GO:0045936ColorectumADnegative regulation of phosphate metabolic process129/3918441/187231.81e-053.76e-04129
Page: 1 2 3 4 5 6 7 8 9 10 11 12 13 14 15 16 17 

check button Enriched KEGG pathways.
Pathway IDTissueDisease StageDescriptionGene RatioBg Ratiopvaluep.adjustqvalueCount
Page: 1 

Top

Cell-cell communication analysis

check buttonIdentification of potential cell-cell interactions between two cell types and their ligand-receptor pairs for different disease states
LigandReceptorLRpairPathwayTissueDisease Stage
Page: 1 

Top

Single-cell gene regulatory network inference analysis

check buttonFind out the significant the regulons (TFs) and the target genes of each regulon across cell types for different disease states
TFCell TypeTissueDisease StageTarget GeneRSSRegulon Activity
∗The dot plots of a searched regulon are shown for all cell subpopulations in each disease state of each tissue based on the regulon specific score inferred using pySCENIC and by calculating the average expression.
Page: 1 

Top

Somatic mutation of malignant transformation related genes

check buttonAnnotation of somatic variants for genes involved in malignant transformation
Hugo SymbolVariant ClassVariant ClassificationdbSNP RSHGVScHGVSpHGVSp ShortSWISSPROTBIOTYPESIFTPolyPhenTumor Sample BarcodeTissueHistologySexAgeStageTherapy TypesDrugsOutcome
PIBF1SNVMissense_Mutationc.601N>Gp.Leu201Valp.L201VQ8WXW3protein_codingdeleterious(0)probably_damaging(0.996)TCGA-AC-A23H-01Breastbreast invasive carcinomaFemale>=65I/IIUnknownUnknownPD
PIBF1SNVMissense_Mutationnovelc.1066N>Ap.Glu356Lysp.E356KQ8WXW3protein_codingdeleterious(0.01)probably_damaging(0.994)TCGA-AN-A046-01Breastbreast invasive carcinomaFemale>=65I/IIUnknownUnknownSD
PIBF1insertionFrame_Shift_Insnovelc.1669_1670insTp.Ser559PhefsTer7p.S559Ffs*7Q8WXW3protein_codingTCGA-AN-A0XW-01Breastbreast invasive carcinomaFemale<65III/IVUnknownUnknownSD
PIBF1insertionNonsense_Mutationnovelc.1707_1708insAAACCTAACATGATATGATp.Ala570LysfsTer6p.A570Kfs*6Q8WXW3protein_codingTCGA-AR-A0TY-01Breastbreast invasive carcinomaFemale<65I/IIUnspecificPaclitaxelPD
PIBF1insertionIn_Frame_Insnovelc.1709_1710insAATp.Ala570_Lys571insIlep.A570_K571insIQ8WXW3protein_codingTCGA-AR-A0TY-01Breastbreast invasive carcinomaFemale<65I/IIUnspecificPaclitaxelPD
PIBF1insertionIn_Frame_Insnovelc.238_239insTTACTCACAGGAACCCTCTCCCGAp.Asp80delinsValThrHisArgAsnProLeuProAsnp.D80delinsVTHRNPLPNQ8WXW3protein_codingTCGA-B6-A0I8-01Breastbreast invasive carcinomaFemale<65I/IIUnknownUnknownPD
PIBF1insertionNonsense_Mutationnovelc.1160_1161insTTTTGCAATCCTTTCAAAGCTCAGAAATAATTAATAGTp.Lys387AsnfsTer12p.K387Nfs*12Q8WXW3protein_codingTCGA-BH-A0HF-01Breastbreast invasive carcinomaFemale>=65I/IIHormone TherapyarimidexSD
PIBF1SNVMissense_Mutationnovelc.2041C>Ap.His681Asnp.H681NQ8WXW3protein_codingtolerated(0.08)probably_damaging(0.979)TCGA-2W-A8YY-01Cervixcervical & endocervical cancerFemale<65I/IIChemotherapycisplatinCR
PIBF1SNVMissense_Mutationnovelc.1748G>Cp.Arg583Thrp.R583TQ8WXW3protein_codingdeleterious(0)probably_damaging(0.99)TCGA-4J-AA1J-01Cervixcervical & endocervical cancerFemale<65I/IIUnknownUnknownSD
PIBF1SNVMissense_Mutationc.97G>Ap.Asp33Asnp.D33NQ8WXW3protein_codingdeleterious(0.01)possibly_damaging(0.813)TCGA-DG-A2KK-01Cervixcervical & endocervical cancerFemale<65III/IVChemotherapycisplatinSD
Page: 1 2 3 4 5 6 7 8 9 

Top

Related drugs of malignant transformation related genes

check buttonIdentification of chemicals and drugs interact with genes involved in malignant transfromation
(DGIdb 4.0)
Entrez IDSymbolCategoryInteraction TypesDrug Claim NameDrug NamePMIDs
Page: 1