
|
|||||
|
 | |
| |
| |
| |
| |
| |
|
Gene: PIAS4 |
Gene summary for PIAS4 |
| Gene information | Species | Human | Gene symbol | PIAS4 | Gene ID | 51588 |
| Gene name | protein inhibitor of activated STAT 4 | |
| Gene Alias | PIAS-gamma | |
| Cytomap | 19p13.3 | |
| Gene Type | protein-coding | GO ID | GO:0000122 | UniProtAcc | B3KMR4 |
Top |
Malignant transformation analysis |
| Identification of the aberrant gene expression in precancerous and cancerous lesions by comparing the gene expression of stem-like cells in diseased tissues with normal stem cells |
| Entrez ID | Symbol | Replicates | Species | Organ | Tissue | Adj P-value | Log2FC | Malignancy |
| 51588 | PIAS4 | LZE7T | Human | Esophagus | ESCC | 4.06e-05 | 3.18e-01 | 0.0667 |
| 51588 | PIAS4 | LZE8T | Human | Esophagus | ESCC | 9.41e-04 | 1.12e-01 | 0.067 |
| 51588 | PIAS4 | LZE20T | Human | Esophagus | ESCC | 3.83e-02 | 1.21e-01 | 0.0662 |
| 51588 | PIAS4 | LZE24T | Human | Esophagus | ESCC | 2.26e-14 | 2.97e-01 | 0.0596 |
| 51588 | PIAS4 | LZE21T | Human | Esophagus | ESCC | 1.68e-06 | 4.17e-01 | 0.0655 |
| 51588 | PIAS4 | P1T-E | Human | Esophagus | ESCC | 1.65e-08 | 3.32e-01 | 0.0875 |
| 51588 | PIAS4 | P2T-E | Human | Esophagus | ESCC | 2.88e-26 | 3.32e-01 | 0.1177 |
| 51588 | PIAS4 | P4T-E | Human | Esophagus | ESCC | 4.09e-13 | 3.01e-01 | 0.1323 |
| 51588 | PIAS4 | P5T-E | Human | Esophagus | ESCC | 8.78e-10 | 1.17e-01 | 0.1327 |
| 51588 | PIAS4 | P8T-E | Human | Esophagus | ESCC | 4.62e-18 | 3.55e-01 | 0.0889 |
| 51588 | PIAS4 | P9T-E | Human | Esophagus | ESCC | 2.48e-17 | 3.23e-01 | 0.1131 |
| 51588 | PIAS4 | P10T-E | Human | Esophagus | ESCC | 2.02e-19 | 3.49e-01 | 0.116 |
| 51588 | PIAS4 | P11T-E | Human | Esophagus | ESCC | 5.53e-15 | 4.45e-01 | 0.1426 |
| 51588 | PIAS4 | P12T-E | Human | Esophagus | ESCC | 1.09e-19 | 3.29e-01 | 0.1122 |
| 51588 | PIAS4 | P15T-E | Human | Esophagus | ESCC | 7.56e-19 | 3.08e-01 | 0.1149 |
| 51588 | PIAS4 | P16T-E | Human | Esophagus | ESCC | 2.37e-16 | 2.48e-01 | 0.1153 |
| 51588 | PIAS4 | P17T-E | Human | Esophagus | ESCC | 7.07e-05 | 1.90e-01 | 0.1278 |
| 51588 | PIAS4 | P19T-E | Human | Esophagus | ESCC | 2.34e-05 | 4.58e-01 | 0.1662 |
| 51588 | PIAS4 | P20T-E | Human | Esophagus | ESCC | 5.26e-15 | 3.03e-01 | 0.1124 |
| 51588 | PIAS4 | P21T-E | Human | Esophagus | ESCC | 2.31e-16 | 2.05e-01 | 0.1617 |
| Page: 1 2 3 4 |
| Tissue | Expression Dynamics | Abbreviation |
| Esophagus |  | ESCC: Esophageal squamous cell carcinoma |
| HGIN: High-grade intraepithelial neoplasias | ||
| LGIN: Low-grade intraepithelial neoplasias | ||
| Oral Cavity | 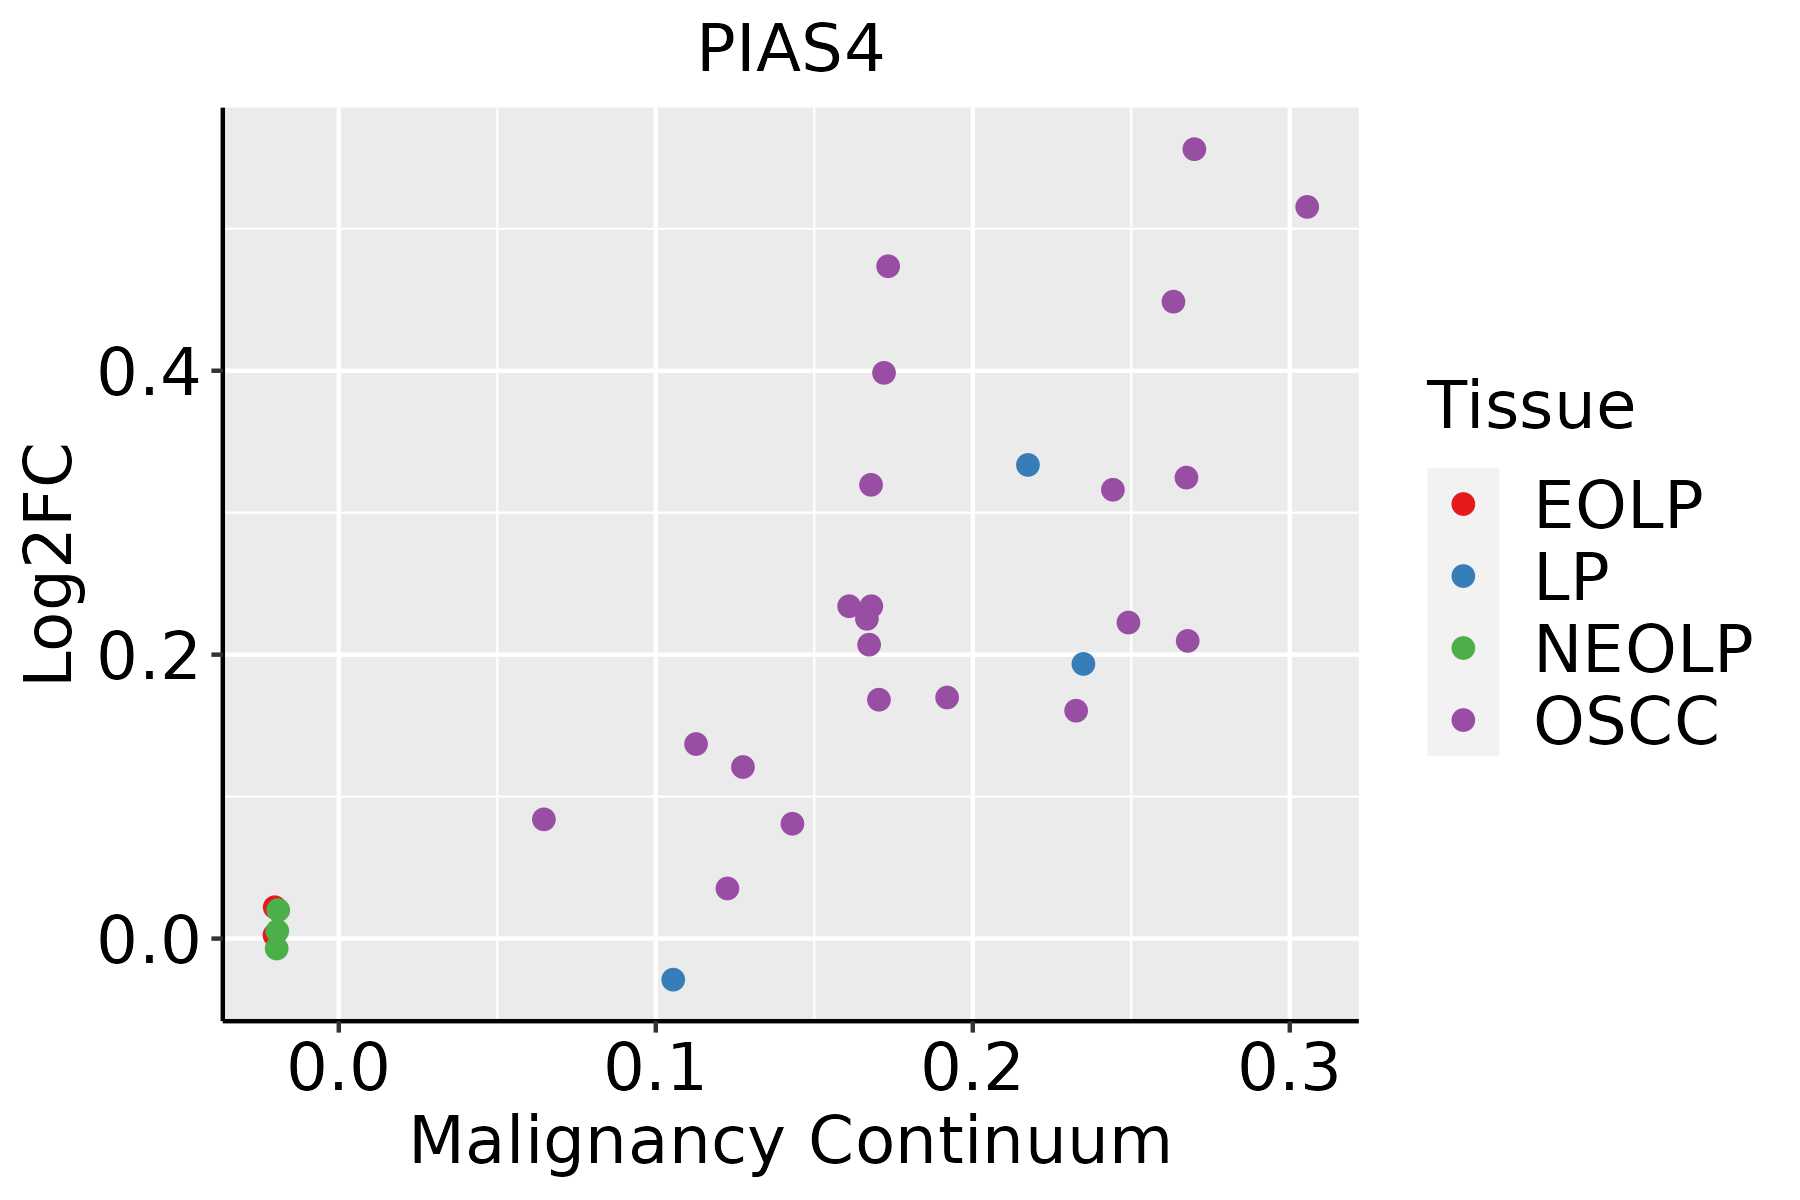 | EOLP: Erosive Oral lichen planus |
| LP: leukoplakia | ||
| NEOLP: Non-erosive oral lichen planus | ||
| OSCC: Oral squamous cell carcinoma |
| ∗log2FC in expression of this searched gene in stem-like cells from each diseased tissue sample relative to stem-like cells in normal samples in each tissue plotted against the malignancy continuum. Samples are colored based on if they are from different disease stage. |
Top |
Malignant transformation related pathway analysis |
| Find out the enriched GO biological processes and KEGG pathways involved in transition from healthy to precancer to cancer |
| Tissue | Disease Stage | Enriched GO biological Processes |
| Colorectum | AD |  |
| Colorectum | SER |  |
| Colorectum | MSS |  |
| Colorectum | MSI-H |  |
| Colorectum | FAP |  |
| ∗Top 15 enriched GO BP terms are showed in the bar plot of each disease state in each tissue. Each row represents a significant GO biological process which is colored according to the -log10(p.adjust). |
| Page: 1 2 3 4 5 6 7 8 9 |
| GO ID | Tissue | Disease Stage | Description | Gene Ratio | Bg Ratio | pvalue | p.adjust | Count |
| GO:0097193111 | Esophagus | ESCC | intrinsic apoptotic signaling pathway | 222/8552 | 288/18723 | 5.87e-28 | 2.02e-25 | 222 |
| GO:2001233111 | Esophagus | ESCC | regulation of apoptotic signaling pathway | 256/8552 | 356/18723 | 4.11e-24 | 1.04e-21 | 256 |
| GO:1903320111 | Esophagus | ESCC | regulation of protein modification by small protein conjugation or removal | 181/8552 | 242/18723 | 1.80e-20 | 2.60e-18 | 181 |
| GO:001820514 | Esophagus | ESCC | peptidyl-lysine modification | 259/8552 | 376/18723 | 3.90e-20 | 5.26e-18 | 259 |
| GO:2001242111 | Esophagus | ESCC | regulation of intrinsic apoptotic signaling pathway | 128/8552 | 164/18723 | 1.75e-17 | 1.50e-15 | 128 |
| GO:0008630110 | Esophagus | ESCC | intrinsic apoptotic signaling pathway in response to DNA damage | 78/8552 | 99/18723 | 1.43e-11 | 5.08e-10 | 78 |
| GO:001605517 | Esophagus | ESCC | Wnt signaling pathway | 268/8552 | 444/18723 | 2.32e-10 | 6.58e-09 | 268 |
| GO:019873817 | Esophagus | ESCC | cell-cell signaling by wnt | 269/8552 | 446/18723 | 2.41e-10 | 6.79e-09 | 269 |
| GO:2001235110 | Esophagus | ESCC | positive regulation of apoptotic signaling pathway | 92/8552 | 126/18723 | 3.91e-10 | 1.05e-08 | 92 |
| GO:190332216 | Esophagus | ESCC | positive regulation of protein modification by small protein conjugation or removal | 99/8552 | 138/18723 | 4.39e-10 | 1.16e-08 | 99 |
| GO:2001020110 | Esophagus | ESCC | regulation of response to DNA damage stimulus | 145/8552 | 219/18723 | 5.97e-10 | 1.50e-08 | 145 |
| GO:00510908 | Esophagus | ESCC | regulation of DNA-binding transcription factor activity | 252/8552 | 440/18723 | 5.22e-07 | 6.97e-06 | 252 |
| GO:00063024 | Esophagus | ESCC | double-strand break repair | 152/8552 | 251/18723 | 1.33e-06 | 1.62e-05 | 152 |
| GO:001692512 | Esophagus | ESCC | protein sumoylation | 41/8552 | 53/18723 | 2.49e-06 | 2.86e-05 | 41 |
| GO:00607595 | Esophagus | ESCC | regulation of response to cytokine stimulus | 103/8552 | 162/18723 | 3.14e-06 | 3.53e-05 | 103 |
| GO:003320914 | Esophagus | ESCC | tumor necrosis factor-mediated signaling pathway | 67/8552 | 99/18723 | 7.87e-06 | 7.72e-05 | 67 |
| GO:00019595 | Esophagus | ESCC | regulation of cytokine-mediated signaling pathway | 95/8552 | 150/18723 | 9.48e-06 | 9.04e-05 | 95 |
| GO:200124417 | Esophagus | ESCC | positive regulation of intrinsic apoptotic signaling pathway | 43/8552 | 58/18723 | 9.86e-06 | 9.37e-05 | 43 |
| GO:003461220 | Esophagus | ESCC | response to tumor necrosis factor | 149/8552 | 253/18723 | 1.47e-05 | 1.33e-04 | 149 |
| GO:20010228 | Esophagus | ESCC | positive regulation of response to DNA damage stimulus | 69/8552 | 105/18723 | 2.66e-05 | 2.22e-04 | 69 |
| Page: 1 2 3 |
| Pathway ID | Tissue | Disease Stage | Description | Gene Ratio | Bg Ratio | pvalue | p.adjust | qvalue | Count |
| hsa0412027 | Esophagus | ESCC | Ubiquitin mediated proteolysis | 122/4205 | 142/8465 | 6.53e-20 | 7.29e-18 | 3.74e-18 | 122 |
| hsa05418211 | Esophagus | ESCC | Fluid shear stress and atherosclerosis | 109/4205 | 139/8465 | 2.00e-12 | 3.72e-11 | 1.90e-11 | 109 |
| hsa040645 | Esophagus | ESCC | NF-kappa B signaling pathway | 67/4205 | 104/8465 | 1.62e-03 | 4.89e-03 | 2.50e-03 | 67 |
| hsa0412036 | Esophagus | ESCC | Ubiquitin mediated proteolysis | 122/4205 | 142/8465 | 6.53e-20 | 7.29e-18 | 3.74e-18 | 122 |
| hsa05418310 | Esophagus | ESCC | Fluid shear stress and atherosclerosis | 109/4205 | 139/8465 | 2.00e-12 | 3.72e-11 | 1.90e-11 | 109 |
| hsa0406412 | Esophagus | ESCC | NF-kappa B signaling pathway | 67/4205 | 104/8465 | 1.62e-03 | 4.89e-03 | 2.50e-03 | 67 |
| hsa0412020 | Oral cavity | OSCC | Ubiquitin mediated proteolysis | 105/3704 | 142/8465 | 1.83e-13 | 4.37e-12 | 2.23e-12 | 105 |
| hsa0541830 | Oral cavity | OSCC | Fluid shear stress and atherosclerosis | 92/3704 | 139/8465 | 6.51e-08 | 4.84e-07 | 2.47e-07 | 92 |
| hsa040644 | Oral cavity | OSCC | NF-kappa B signaling pathway | 67/3704 | 104/8465 | 1.57e-05 | 6.75e-05 | 3.44e-05 | 67 |
| hsa04120110 | Oral cavity | OSCC | Ubiquitin mediated proteolysis | 105/3704 | 142/8465 | 1.83e-13 | 4.37e-12 | 2.23e-12 | 105 |
| hsa05418114 | Oral cavity | OSCC | Fluid shear stress and atherosclerosis | 92/3704 | 139/8465 | 6.51e-08 | 4.84e-07 | 2.47e-07 | 92 |
| hsa0406411 | Oral cavity | OSCC | NF-kappa B signaling pathway | 67/3704 | 104/8465 | 1.57e-05 | 6.75e-05 | 3.44e-05 | 67 |
| Page: 1 |
Top |
Cell-cell communication analysis |
| Identification of potential cell-cell interactions between two cell types and their ligand-receptor pairs for different disease states |
| Ligand | Receptor | LRpair | Pathway | Tissue | Disease Stage |
| Page: 1 |
Top |
Single-cell gene regulatory network inference analysis |
| Find out the significant the regulons (TFs) and the target genes of each regulon across cell types for different disease states |
| TF | Cell Type | Tissue | Disease Stage | Target Gene | RSS | Regulon Activity |
| ∗The dot plots of a searched regulon are shown for all cell subpopulations in each disease state of each tissue based on the regulon specific score inferred using pySCENIC and by calculating the average expression. |
| Page: 1 |
Top |
Somatic mutation of malignant transformation related genes |
| Annotation of somatic variants for genes involved in malignant transformation |
| Hugo Symbol | Variant Class | Variant Classification | dbSNP RS | HGVSc | HGVSp | HGVSp Short | SWISSPROT | BIOTYPE | SIFT | PolyPhen | Tumor Sample Barcode | Tissue | Histology | Sex | Age | Stage | Therapy Types | Drugs | Outcome |
| PIAS4 | SNV | Missense_Mutation | rs148794749 | c.1280N>T | p.Ser427Leu | p.S427L | Q8N2W9 | protein_coding | tolerated(0.08) | benign(0.024) | TCGA-AC-A23H-01 | Breast | breast invasive carcinoma | Female | >=65 | I/II | Unknown | Unknown | PD |
| PIAS4 | SNV | Missense_Mutation | rs111928159 | c.370G>A | p.Ala124Thr | p.A124T | Q8N2W9 | protein_coding | tolerated(0.56) | benign(0) | TCGA-B6-A0RE-01 | Breast | breast invasive carcinoma | Female | <65 | I/II | Unknown | Unknown | SD |
| PIAS4 | SNV | Missense_Mutation | rs764999661 | c.1355N>T | p.Pro452Leu | p.P452L | Q8N2W9 | protein_coding | tolerated(0.26) | benign(0) | TCGA-B6-A0WW-01 | Breast | breast invasive carcinoma | Female | <65 | I/II | Unknown | Unknown | PD |
| PIAS4 | SNV | Missense_Mutation | c.722N>A | p.Arg241His | p.R241H | Q8N2W9 | protein_coding | deleterious(0.01) | possibly_damaging(0.846) | TCGA-BH-A0HA-01 | Breast | breast invasive carcinoma | Female | <65 | I/II | Unknown | Unknown | SD | |
| PIAS4 | SNV | Missense_Mutation | rs765784737 | c.448G>A | p.Glu150Lys | p.E150K | Q8N2W9 | protein_coding | deleterious(0.01) | benign(0.19) | TCGA-5M-AAT6-01 | Colorectum | colon adenocarcinoma | Female | <65 | III/IV | Unknown | Unknown | PD |
| PIAS4 | SNV | Missense_Mutation | c.611N>C | p.Gln204Pro | p.Q204P | Q8N2W9 | protein_coding | deleterious(0) | benign(0.366) | TCGA-A6-2686-01 | Colorectum | colon adenocarcinoma | Female | >=65 | I/II | Unknown | Unknown | SD | |
| PIAS4 | SNV | Missense_Mutation | c.233N>G | p.His78Arg | p.H78R | Q8N2W9 | protein_coding | tolerated(0.43) | benign(0.026) | TCGA-A6-3809-01 | Colorectum | colon adenocarcinoma | Female | >=65 | I/II | Unknown | Unknown | SD | |
| PIAS4 | SNV | Missense_Mutation | c.1013N>A | p.Arg338Gln | p.R338Q | Q8N2W9 | protein_coding | deleterious(0) | probably_damaging(0.998) | TCGA-A6-A56B-01 | Colorectum | colon adenocarcinoma | Male | <65 | III/IV | Chemotherapy | fluorouracil | PD | |
| PIAS4 | SNV | Missense_Mutation | c.123N>T | p.Arg41Ser | p.R41S | Q8N2W9 | protein_coding | deleterious(0) | probably_damaging(0.992) | TCGA-AA-3819-01 | Colorectum | colon adenocarcinoma | Female | <65 | I/II | Unknown | Unknown | SD | |
| PIAS4 | SNV | Missense_Mutation | c.705G>T | p.Glu235Asp | p.E235D | Q8N2W9 | protein_coding | deleterious(0.04) | possibly_damaging(0.874) | TCGA-AA-A01P-01 | Colorectum | colon adenocarcinoma | Female | >=65 | III/IV | Unknown | Unknown | PD |
| Page: 1 2 3 4 5 |
Top |
Related drugs of malignant transformation related genes |
| Identification of chemicals and drugs interact with genes involved in malignant transfromation |
| (DGIdb 4.0) |
| Entrez ID | Symbol | Category | Interaction Types | Drug Claim Name | Drug Name | PMIDs |
| Page: 1 |

Copyright 2023-Present -The University of Texas Health Science Center at Houston |