
|
|||||
|
 | |
| |
| |
| |
| |
| |
|
Gene: PI4KA |
Gene summary for PI4KA |
| Gene information | Species | Human | Gene symbol | PI4KA | Gene ID | 5297 |
| Gene name | phosphatidylinositol 4-kinase alpha | |
| Gene Alias | PI4K-ALPHA | |
| Cytomap | 22q11.21 | |
| Gene Type | protein-coding | GO ID | GO:0006629 | UniProtAcc | B4DYG5 |
Top |
Malignant transformation analysis |
| Identification of the aberrant gene expression in precancerous and cancerous lesions by comparing the gene expression of stem-like cells in diseased tissues with normal stem cells |
| Entrez ID | Symbol | Replicates | Species | Organ | Tissue | Adj P-value | Log2FC | Malignancy |
| 5297 | PI4KA | AEH-subject4 | Human | Endometrium | AEH | 1.26e-02 | 2.86e-01 | -0.2657 |
| 5297 | PI4KA | AEH-subject5 | Human | Endometrium | AEH | 2.11e-02 | 2.17e-01 | -0.2953 |
| 5297 | PI4KA | EEC-subject4 | Human | Endometrium | EEC | 2.63e-02 | 2.00e-01 | -0.2571 |
| 5297 | PI4KA | EEC-subject5 | Human | Endometrium | EEC | 1.17e-03 | 2.34e-01 | -0.249 |
| 5297 | PI4KA | GSM6177620_NYU_UCEC1_lib2_lib2 | Human | Endometrium | EEC | 7.88e-03 | 5.77e-02 | -0.1875 |
| 5297 | PI4KA | GSM6177622_NYU_UCEC3_lib1_lib1 | Human | Endometrium | EEC | 1.25e-02 | -5.51e-04 | -0.1917 |
| 5297 | PI4KA | GSM6177622_NYU_UCEC3_lib2_lib2 | Human | Endometrium | EEC | 1.06e-04 | -4.66e-02 | -0.1916 |
| 5297 | PI4KA | GSM6177623_NYU_UCEC3_Vis | Human | Endometrium | EEC | 2.48e-23 | 6.25e-01 | -0.1269 |
| 5297 | PI4KA | LZE7T | Human | Esophagus | ESCC | 4.15e-08 | 3.35e-01 | 0.0667 |
| 5297 | PI4KA | LZE8T | Human | Esophagus | ESCC | 1.72e-06 | 1.35e-01 | 0.067 |
| 5297 | PI4KA | LZE20T | Human | Esophagus | ESCC | 2.75e-03 | 8.72e-02 | 0.0662 |
| 5297 | PI4KA | LZE24T | Human | Esophagus | ESCC | 1.67e-14 | 2.72e-01 | 0.0596 |
| 5297 | PI4KA | LZE21T | Human | Esophagus | ESCC | 6.37e-06 | 3.55e-01 | 0.0655 |
| 5297 | PI4KA | P1T-E | Human | Esophagus | ESCC | 1.56e-05 | 2.09e-01 | 0.0875 |
| 5297 | PI4KA | P2T-E | Human | Esophagus | ESCC | 1.14e-08 | 9.95e-02 | 0.1177 |
| 5297 | PI4KA | P4T-E | Human | Esophagus | ESCC | 1.73e-10 | 2.22e-01 | 0.1323 |
| 5297 | PI4KA | P8T-E | Human | Esophagus | ESCC | 1.11e-10 | 2.57e-01 | 0.0889 |
| 5297 | PI4KA | P9T-E | Human | Esophagus | ESCC | 2.10e-09 | 1.89e-01 | 0.1131 |
| 5297 | PI4KA | P10T-E | Human | Esophagus | ESCC | 2.20e-23 | 4.13e-01 | 0.116 |
| 5297 | PI4KA | P11T-E | Human | Esophagus | ESCC | 2.20e-08 | 2.19e-01 | 0.1426 |
| Page: 1 2 3 4 5 6 |
| Tissue | Expression Dynamics | Abbreviation |
| Endometrium | 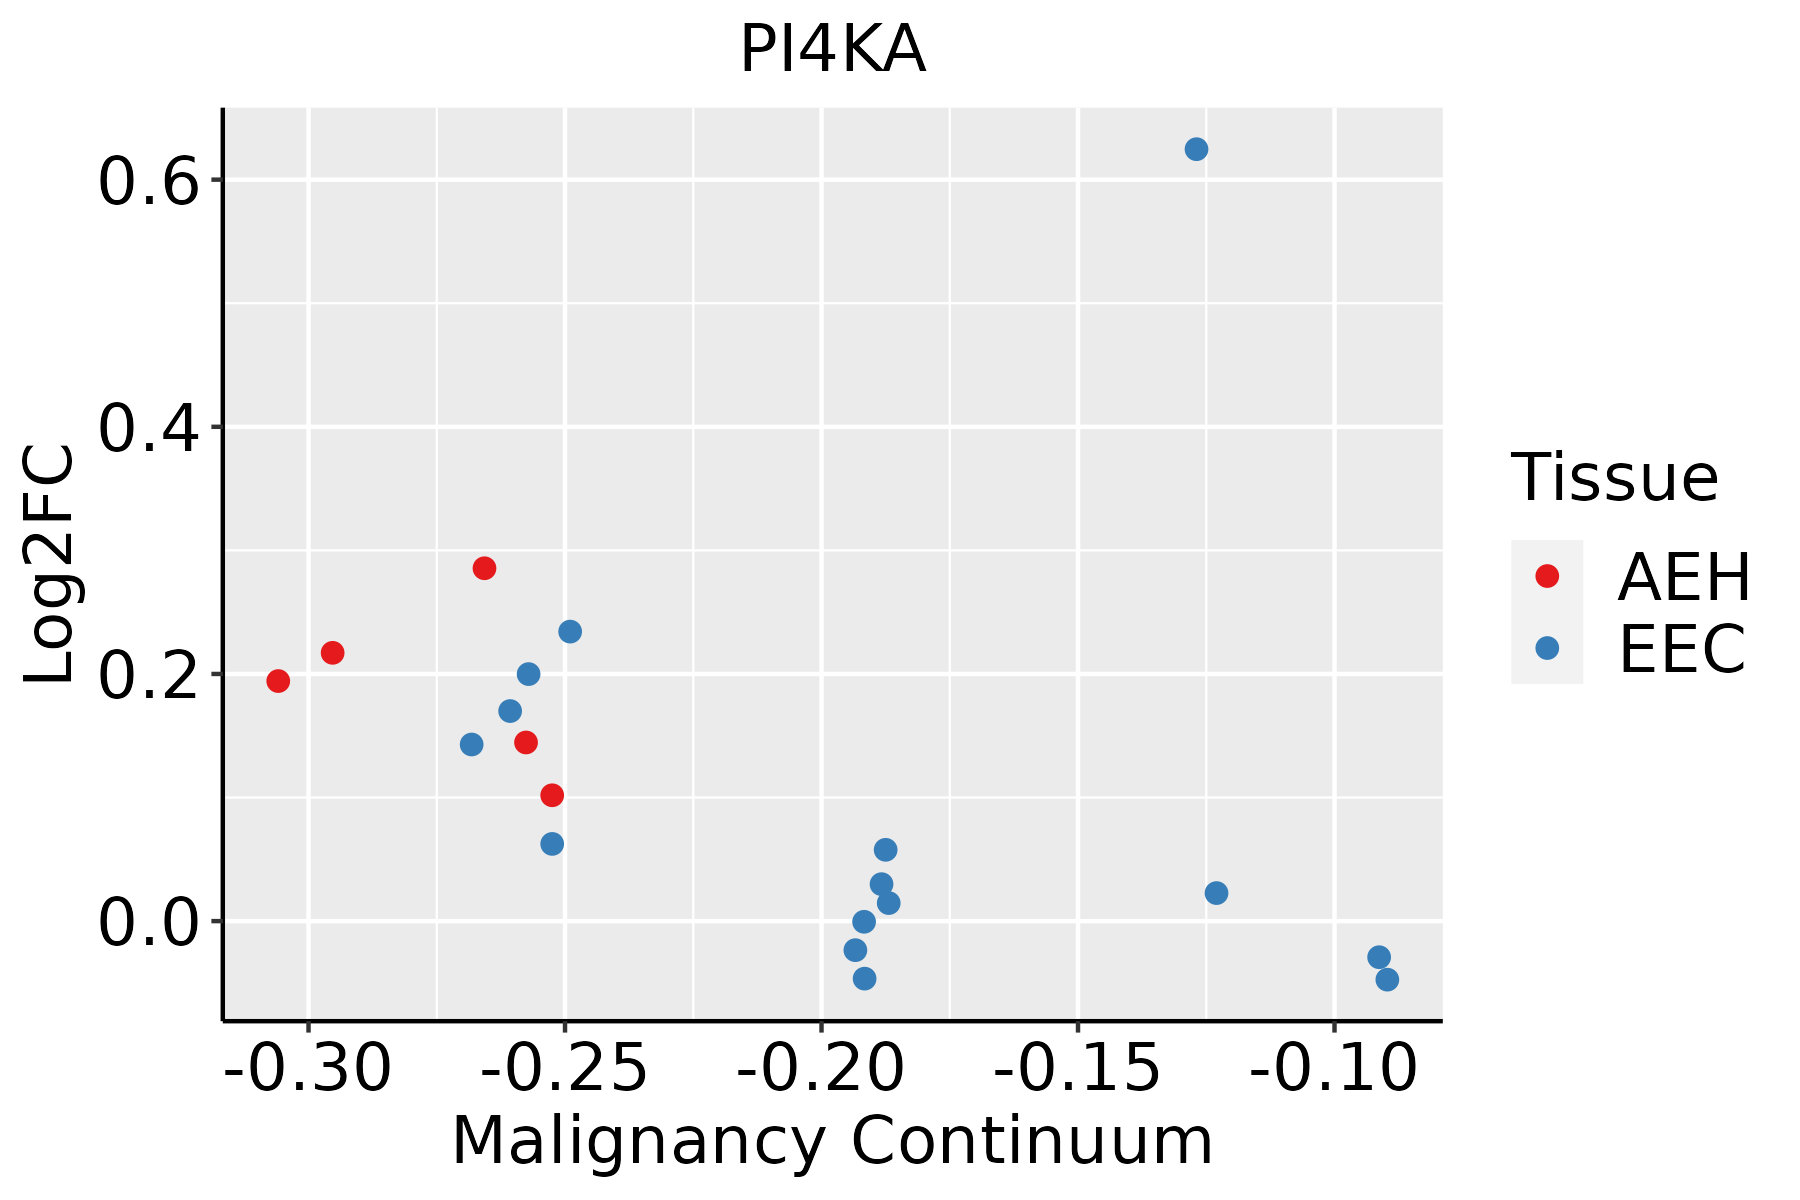 | AEH: Atypical endometrial hyperplasia |
| EEC: Endometrioid Cancer | ||
| Esophagus |  | ESCC: Esophageal squamous cell carcinoma |
| HGIN: High-grade intraepithelial neoplasias | ||
| LGIN: Low-grade intraepithelial neoplasias | ||
| Liver |  | HCC: Hepatocellular carcinoma |
| NAFLD: Non-alcoholic fatty liver disease | ||
| Lung |  | AAH: Atypical adenomatous hyperplasia |
| AIS: Adenocarcinoma in situ | ||
| IAC: Invasive lung adenocarcinoma | ||
| MIA: Minimally invasive adenocarcinoma | ||
| Oral Cavity | 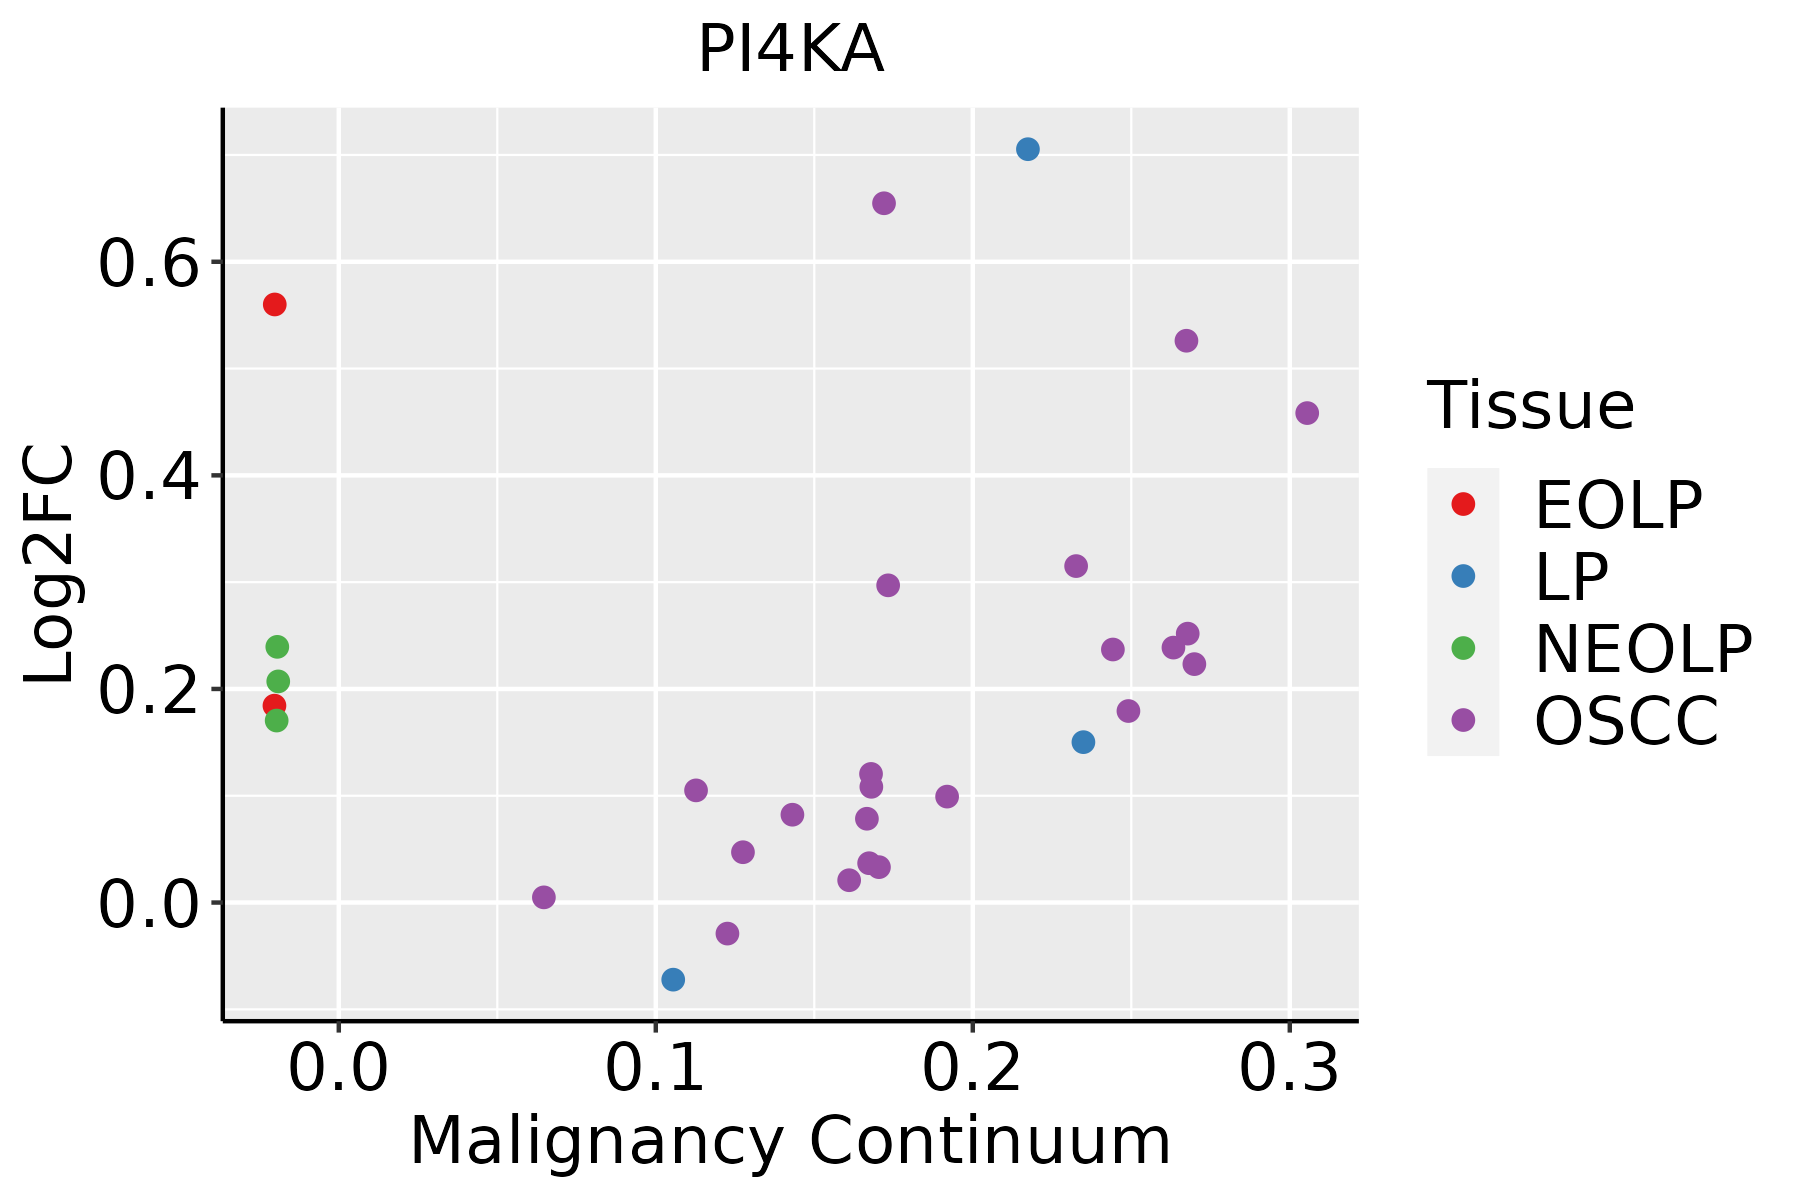 | EOLP: Erosive Oral lichen planus |
| LP: leukoplakia | ||
| NEOLP: Non-erosive oral lichen planus | ||
| OSCC: Oral squamous cell carcinoma |
| ∗log2FC in expression of this searched gene in stem-like cells from each diseased tissue sample relative to stem-like cells in normal samples in each tissue plotted against the malignancy continuum. Samples are colored based on if they are from different disease stage. |
Top |
Malignant transformation related pathway analysis |
| Find out the enriched GO biological processes and KEGG pathways involved in transition from healthy to precancer to cancer |
| Tissue | Disease Stage | Enriched GO biological Processes |
| Colorectum | AD |  |
| Colorectum | SER |  |
| Colorectum | MSS |  |
| Colorectum | MSI-H |  |
| Colorectum | FAP |  |
| ∗Top 15 enriched GO BP terms are showed in the bar plot of each disease state in each tissue. Each row represents a significant GO biological process which is colored according to the -log10(p.adjust). |
| Page: 1 2 3 4 5 6 7 8 9 |
| GO ID | Tissue | Disease Stage | Description | Gene Ratio | Bg Ratio | pvalue | p.adjust | Count |
| GO:001603216 | Endometrium | AEH | viral process | 110/2100 | 415/18723 | 1.99e-18 | 1.09e-15 | 110 |
| GO:001905816 | Endometrium | AEH | viral life cycle | 86/2100 | 317/18723 | 2.53e-15 | 7.58e-13 | 86 |
| GO:001907916 | Endometrium | AEH | viral genome replication | 43/2100 | 131/18723 | 3.22e-11 | 4.60e-09 | 43 |
| GO:00396942 | Endometrium | AEH | viral RNA genome replication | 12/2100 | 35/18723 | 2.69e-04 | 3.12e-03 | 12 |
| GO:00447642 | Endometrium | AEH | multi-organism cellular process | 7/2100 | 14/18723 | 3.71e-04 | 4.02e-03 | 7 |
| GO:001603217 | Endometrium | EEC | viral process | 112/2168 | 415/18723 | 2.48e-18 | 1.35e-15 | 112 |
| GO:001905817 | Endometrium | EEC | viral life cycle | 86/2168 | 317/18723 | 1.63e-14 | 4.65e-12 | 86 |
| GO:001907917 | Endometrium | EEC | viral genome replication | 42/2168 | 131/18723 | 3.43e-10 | 3.61e-08 | 42 |
| GO:00447641 | Endometrium | EEC | multi-organism cellular process | 7/2168 | 14/18723 | 4.53e-04 | 4.69e-03 | 7 |
| GO:00396941 | Endometrium | EEC | viral RNA genome replication | 11/2168 | 35/18723 | 1.44e-03 | 1.17e-02 | 11 |
| GO:0016032111 | Esophagus | ESCC | viral process | 301/8552 | 415/18723 | 3.34e-29 | 1.32e-26 | 301 |
| GO:0019058111 | Esophagus | ESCC | viral life cycle | 226/8552 | 317/18723 | 1.17e-20 | 1.76e-18 | 226 |
| GO:0019079111 | Esophagus | ESCC | viral genome replication | 102/8552 | 131/18723 | 4.31e-14 | 2.19e-12 | 102 |
| GO:00086544 | Esophagus | ESCC | phospholipid biosynthetic process | 162/8552 | 253/18723 | 2.59e-09 | 5.73e-08 | 162 |
| GO:00464744 | Esophagus | ESCC | glycerophospholipid biosynthetic process | 135/8552 | 211/18723 | 5.75e-08 | 1.02e-06 | 135 |
| GO:00450175 | Esophagus | ESCC | glycerolipid biosynthetic process | 154/8552 | 252/18723 | 5.20e-07 | 6.96e-06 | 154 |
| GO:00066446 | Esophagus | ESCC | phospholipid metabolic process | 218/8552 | 383/18723 | 5.37e-06 | 5.59e-05 | 218 |
| GO:00066505 | Esophagus | ESCC | glycerophospholipid metabolic process | 174/8552 | 306/18723 | 4.92e-05 | 3.85e-04 | 174 |
| GO:003969411 | Esophagus | ESCC | viral RNA genome replication | 27/8552 | 35/18723 | 1.48e-04 | 9.88e-04 | 27 |
| GO:00464864 | Esophagus | ESCC | glycerolipid metabolic process | 211/8552 | 392/18723 | 6.51e-04 | 3.46e-03 | 211 |
| Page: 1 2 3 4 |
| Pathway ID | Tissue | Disease Stage | Description | Gene Ratio | Bg Ratio | pvalue | p.adjust | qvalue | Count |
| Page: 1 |
Top |
Cell-cell communication analysis |
| Identification of potential cell-cell interactions between two cell types and their ligand-receptor pairs for different disease states |
| Ligand | Receptor | LRpair | Pathway | Tissue | Disease Stage |
| Page: 1 |
Top |
Single-cell gene regulatory network inference analysis |
| Find out the significant the regulons (TFs) and the target genes of each regulon across cell types for different disease states |
| TF | Cell Type | Tissue | Disease Stage | Target Gene | RSS | Regulon Activity |
| ∗The dot plots of a searched regulon are shown for all cell subpopulations in each disease state of each tissue based on the regulon specific score inferred using pySCENIC and by calculating the average expression. |
| Page: 1 |
Top |
Somatic mutation of malignant transformation related genes |
| Annotation of somatic variants for genes involved in malignant transformation |
| Hugo Symbol | Variant Class | Variant Classification | dbSNP RS | HGVSc | HGVSp | HGVSp Short | SWISSPROT | BIOTYPE | SIFT | PolyPhen | Tumor Sample Barcode | Tissue | Histology | Sex | Age | Stage | Therapy Types | Drugs | Outcome |
| PI4KA | SNV | Missense_Mutation | c.2180N>G | p.Asp727Gly | p.D727G | P42356 | protein_coding | tolerated(0.44) | benign(0.25) | TCGA-A1-A0SO-01 | Breast | breast invasive carcinoma | Female | >=65 | I/II | Chemotherapy | SD | ||
| PI4KA | SNV | Missense_Mutation | c.2179N>T | p.Asp727Tyr | p.D727Y | P42356 | protein_coding | tolerated(1) | benign(0.033) | TCGA-A1-A0SO-01 | Breast | breast invasive carcinoma | Female | >=65 | I/II | Chemotherapy | SD | ||
| PI4KA | SNV | Missense_Mutation | c.385N>A | p.Glu129Lys | p.E129K | P42356 | protein_coding | deleterious(0) | probably_damaging(0.998) | TCGA-A2-A0YK-01 | Breast | breast invasive carcinoma | Female | <65 | I/II | Chemotherapy | cytoxan | SD | |
| PI4KA | SNV | Missense_Mutation | c.767G>C | p.Ser256Thr | p.S256T | P42356 | protein_coding | tolerated(0.37) | benign(0) | TCGA-A7-A0DA-01 | Breast | breast invasive carcinoma | Female | <65 | I/II | Chemotherapy | adriamycin | SD | |
| PI4KA | SNV | Missense_Mutation | rs535848772 | c.6166C>T | p.Leu2056Phe | p.L2056F | P42356 | protein_coding | deleterious(0.01) | benign(0.206) | TCGA-A7-A26J-01 | Breast | breast invasive carcinoma | Female | <65 | I/II | Hormone Therapy | tamoxiphen | SD |
| PI4KA | SNV | Missense_Mutation | c.2684N>A | p.Ser895Tyr | p.S895Y | P42356 | protein_coding | deleterious(0) | probably_damaging(0.996) | TCGA-A8-A09I-01 | Breast | breast invasive carcinoma | Female | >=65 | I/II | Hormone Therapy | anastrozole | SD | |
| PI4KA | SNV | Missense_Mutation | c.4833N>G | p.Cys1611Trp | p.C1611W | P42356 | protein_coding | deleterious(0.01) | probably_damaging(0.962) | TCGA-AC-A23H-01 | Breast | breast invasive carcinoma | Female | >=65 | I/II | Unknown | Unknown | PD | |
| PI4KA | SNV | Missense_Mutation | c.1252N>G | p.Leu418Val | p.L418V | P42356 | protein_coding | tolerated(0.51) | benign(0.283) | TCGA-AO-A0J9-01 | Breast | breast invasive carcinoma | Female | <65 | III/IV | Chemotherapy | cyclophosphamide | PD | |
| PI4KA | SNV | Missense_Mutation | c.1687N>A | p.Glu563Lys | p.E563K | P42356 | protein_coding | deleterious(0) | possibly_damaging(0.791) | TCGA-B6-A0RT-01 | Breast | breast invasive carcinoma | Female | <65 | III/IV | Unknown | Unknown | SD | |
| PI4KA | SNV | Missense_Mutation | c.2731G>C | p.Asp911His | p.D911H | P42356 | protein_coding | deleterious(0.04) | benign(0.396) | TCGA-C8-A26Y-01 | Breast | breast invasive carcinoma | Female | >=65 | I/II | Unknown | Unknown | SD |
| Page: 1 2 3 4 5 6 7 8 9 10 11 12 13 14 15 16 17 18 19 20 21 |
Top |
Related drugs of malignant transformation related genes |
| Identification of chemicals and drugs interact with genes involved in malignant transfromation |
| (DGIdb 4.0) |
| Entrez ID | Symbol | Category | Interaction Types | Drug Claim Name | Drug Name | PMIDs |
| 5297 | PI4KA | DRUGGABLE GENOME, ENZYME, KINASE, PHOSPHATIDYLINOSITOL 3 KINASE | BYL719 | ALPELISIB | ||
| 5297 | PI4KA | DRUGGABLE GENOME, ENZYME, KINASE, PHOSPHATIDYLINOSITOL 3 KINASE | inhibitor | 178102681 | WORTMANNIN | |
| 5297 | PI4KA | DRUGGABLE GENOME, ENZYME, KINASE, PHOSPHATIDYLINOSITOL 3 KINASE | inhibitor | 315661277 |
| Page: 1 |

Copyright 2023-Present -The University of Texas Health Science Center at Houston |