
|
|||||
|
 | |
| |
| |
| |
| |
| |
|
Gene: PI4K2B |
Gene summary for PI4K2B |
| Gene information | Species | Human | Gene symbol | PI4K2B | Gene ID | 55300 |
| Gene name | phosphatidylinositol 4-kinase type 2 beta | |
| Gene Alias | PI4KIIB | |
| Cytomap | 4p15.2 | |
| Gene Type | protein-coding | GO ID | GO:0006629 | UniProtAcc | Q8TCG2 |
Top |
Malignant transformation analysis |
| Identification of the aberrant gene expression in precancerous and cancerous lesions by comparing the gene expression of stem-like cells in diseased tissues with normal stem cells |
| Entrez ID | Symbol | Replicates | Species | Organ | Tissue | Adj P-value | Log2FC | Malignancy |
| 55300 | PI4K2B | LZE24T | Human | Esophagus | ESCC | 4.82e-07 | 4.76e-02 | 0.0596 |
| 55300 | PI4K2B | P1T-E | Human | Esophagus | ESCC | 1.89e-05 | 2.29e-01 | 0.0875 |
| 55300 | PI4K2B | P2T-E | Human | Esophagus | ESCC | 9.45e-14 | 3.05e-01 | 0.1177 |
| 55300 | PI4K2B | P4T-E | Human | Esophagus | ESCC | 1.41e-16 | 1.24e-01 | 0.1323 |
| 55300 | PI4K2B | P5T-E | Human | Esophagus | ESCC | 9.74e-08 | 9.63e-02 | 0.1327 |
| 55300 | PI4K2B | P8T-E | Human | Esophagus | ESCC | 3.26e-06 | 3.54e-02 | 0.0889 |
| 55300 | PI4K2B | P9T-E | Human | Esophagus | ESCC | 5.12e-05 | 1.42e-01 | 0.1131 |
| 55300 | PI4K2B | P10T-E | Human | Esophagus | ESCC | 1.92e-02 | 1.92e-02 | 0.116 |
| 55300 | PI4K2B | P12T-E | Human | Esophagus | ESCC | 3.76e-05 | 6.19e-02 | 0.1122 |
| 55300 | PI4K2B | P16T-E | Human | Esophagus | ESCC | 1.08e-05 | 4.40e-02 | 0.1153 |
| 55300 | PI4K2B | P17T-E | Human | Esophagus | ESCC | 2.40e-07 | 1.56e-01 | 0.1278 |
| 55300 | PI4K2B | P20T-E | Human | Esophagus | ESCC | 2.42e-04 | 3.53e-02 | 0.1124 |
| 55300 | PI4K2B | P21T-E | Human | Esophagus | ESCC | 6.71e-34 | 7.12e-01 | 0.1617 |
| 55300 | PI4K2B | P22T-E | Human | Esophagus | ESCC | 1.67e-03 | 2.76e-02 | 0.1236 |
| 55300 | PI4K2B | P23T-E | Human | Esophagus | ESCC | 1.29e-08 | 1.19e-01 | 0.108 |
| 55300 | PI4K2B | P24T-E | Human | Esophagus | ESCC | 7.87e-04 | 3.64e-02 | 0.1287 |
| 55300 | PI4K2B | P26T-E | Human | Esophagus | ESCC | 3.77e-02 | 4.82e-03 | 0.1276 |
| 55300 | PI4K2B | P27T-E | Human | Esophagus | ESCC | 1.07e-06 | 8.33e-02 | 0.1055 |
| 55300 | PI4K2B | P28T-E | Human | Esophagus | ESCC | 5.20e-05 | 8.16e-02 | 0.1149 |
| 55300 | PI4K2B | P30T-E | Human | Esophagus | ESCC | 5.02e-10 | 2.02e-01 | 0.137 |
| Page: 1 2 3 4 |
| Tissue | Expression Dynamics | Abbreviation |
| Esophagus | 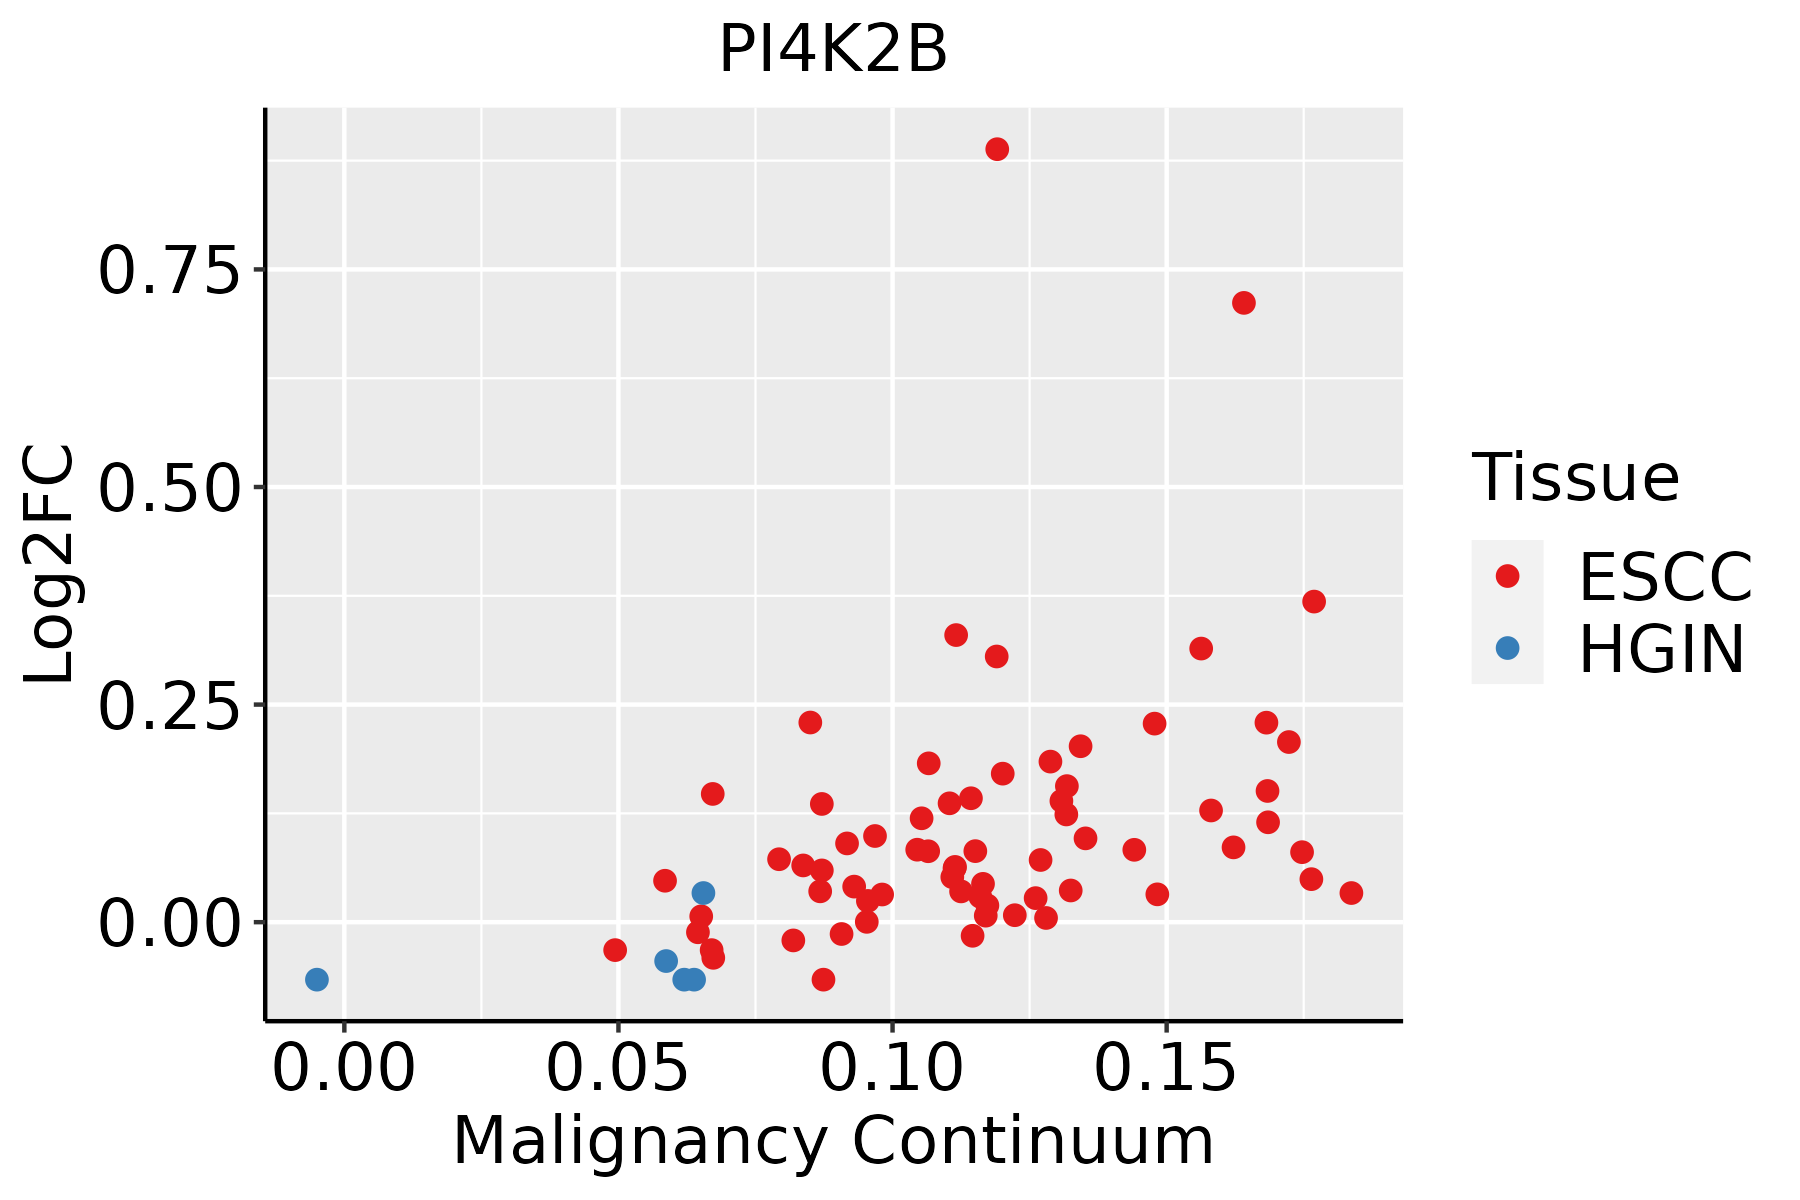 | ESCC: Esophageal squamous cell carcinoma |
| HGIN: High-grade intraepithelial neoplasias | ||
| LGIN: Low-grade intraepithelial neoplasias | ||
| Liver | 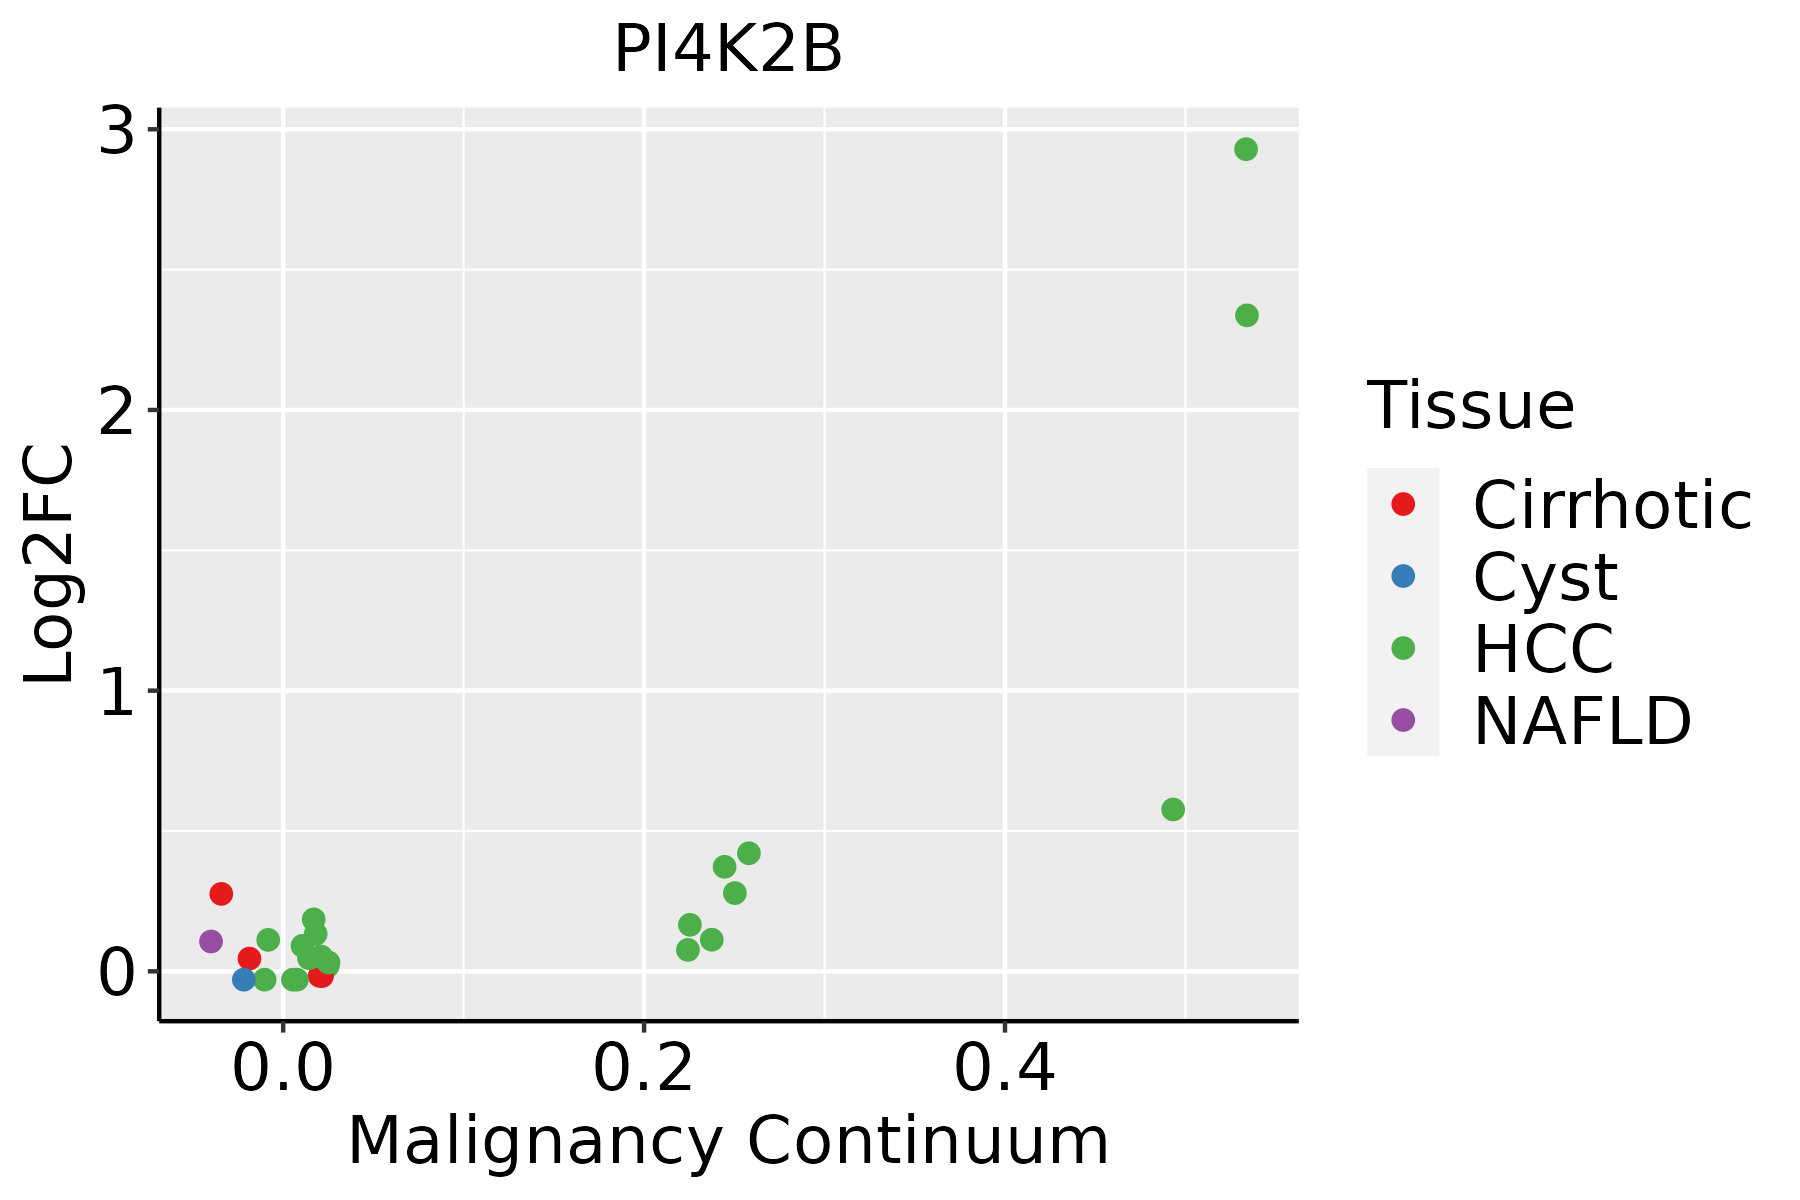 | HCC: Hepatocellular carcinoma |
| NAFLD: Non-alcoholic fatty liver disease | ||
| Oral Cavity | 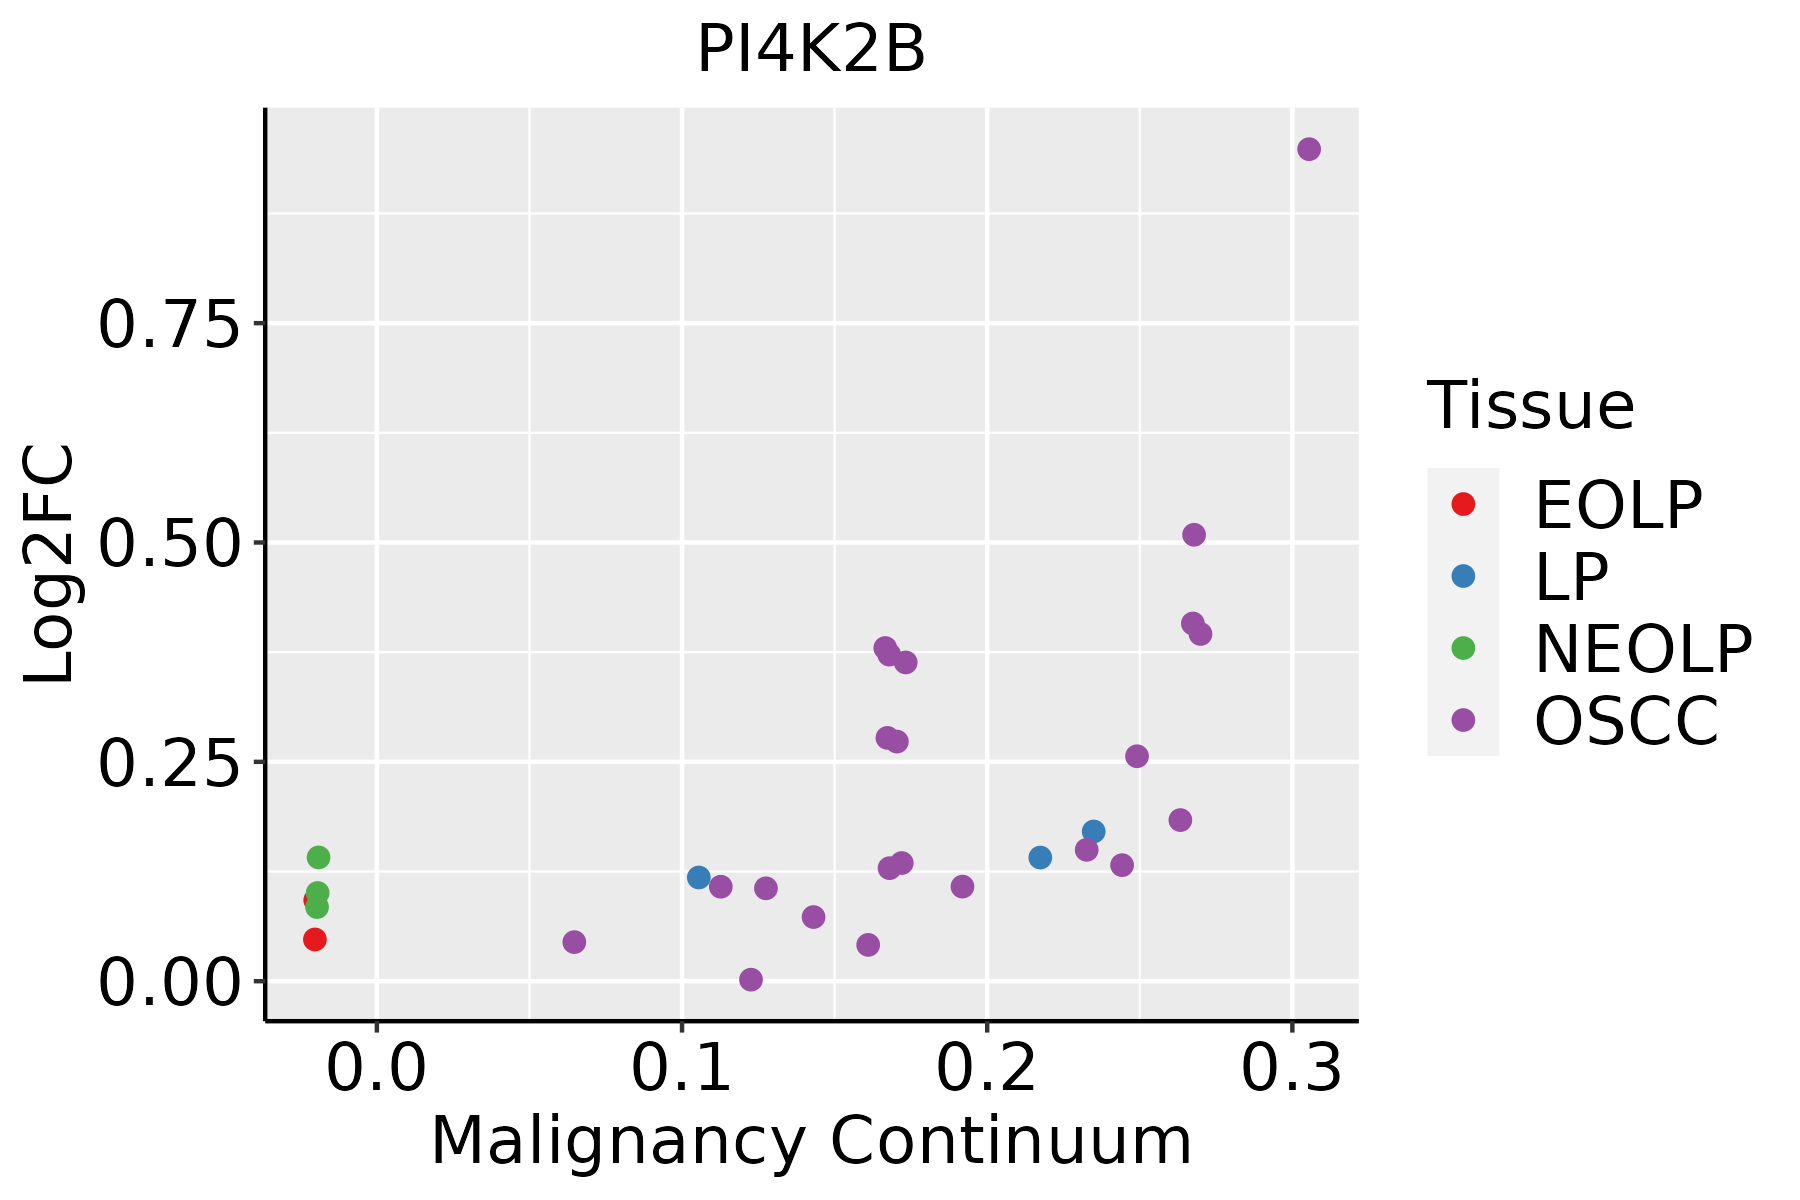 | EOLP: Erosive Oral lichen planus |
| LP: leukoplakia | ||
| NEOLP: Non-erosive oral lichen planus | ||
| OSCC: Oral squamous cell carcinoma | ||
| Skin | 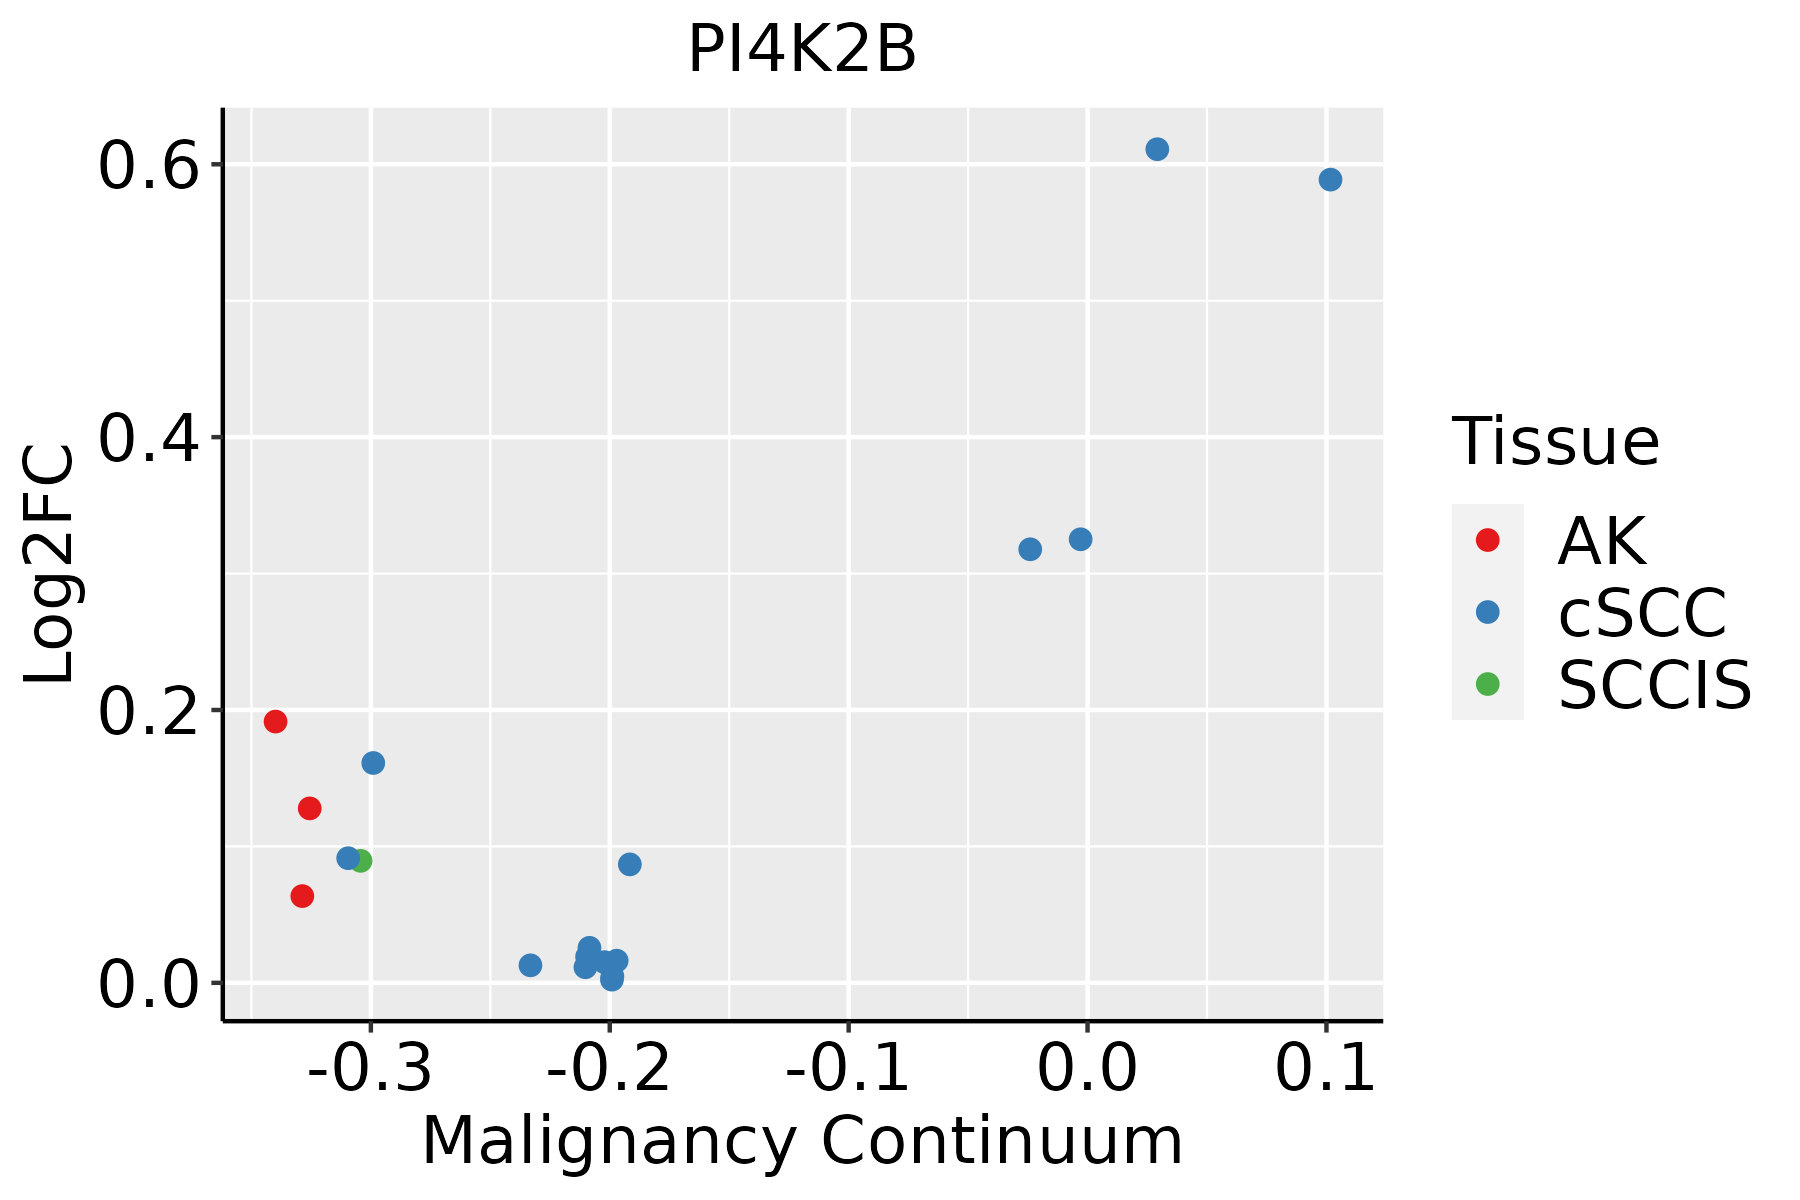 | AK: Actinic keratosis |
| cSCC: Cutaneous squamous cell carcinoma | ||
| SCCIS:squamous cell carcinoma in situ |
| ∗log2FC in expression of this searched gene in stem-like cells from each diseased tissue sample relative to stem-like cells in normal samples in each tissue plotted against the malignancy continuum. Samples are colored based on if they are from different disease stage. |
Top |
Malignant transformation related pathway analysis |
| Find out the enriched GO biological processes and KEGG pathways involved in transition from healthy to precancer to cancer |
| Tissue | Disease Stage | Enriched GO biological Processes |
| Colorectum | AD |  |
| Colorectum | SER |  |
| Colorectum | MSS |  |
| Colorectum | MSI-H |  |
| Colorectum | FAP |  |
| ∗Top 15 enriched GO BP terms are showed in the bar plot of each disease state in each tissue. Each row represents a significant GO biological process which is colored according to the -log10(p.adjust). |
| Page: 1 2 3 4 5 6 7 8 9 |
| GO ID | Tissue | Disease Stage | Description | Gene Ratio | Bg Ratio | pvalue | p.adjust | Count |
| GO:001605014 | Esophagus | ESCC | vesicle organization | 211/8552 | 300/18723 | 2.85e-18 | 2.87e-16 | 211 |
| GO:00086544 | Esophagus | ESCC | phospholipid biosynthetic process | 162/8552 | 253/18723 | 2.59e-09 | 5.73e-08 | 162 |
| GO:00464744 | Esophagus | ESCC | glycerophospholipid biosynthetic process | 135/8552 | 211/18723 | 5.75e-08 | 1.02e-06 | 135 |
| GO:000703214 | Esophagus | ESCC | endosome organization | 61/8552 | 82/18723 | 1.13e-07 | 1.85e-06 | 61 |
| GO:00450175 | Esophagus | ESCC | glycerolipid biosynthetic process | 154/8552 | 252/18723 | 5.20e-07 | 6.96e-06 | 154 |
| GO:00070308 | Esophagus | ESCC | Golgi organization | 101/8552 | 157/18723 | 1.78e-06 | 2.10e-05 | 101 |
| GO:00066446 | Esophagus | ESCC | phospholipid metabolic process | 218/8552 | 383/18723 | 5.37e-06 | 5.59e-05 | 218 |
| GO:00066505 | Esophagus | ESCC | glycerophospholipid metabolic process | 174/8552 | 306/18723 | 4.92e-05 | 3.85e-04 | 174 |
| GO:00464864 | Esophagus | ESCC | glycerolipid metabolic process | 211/8552 | 392/18723 | 6.51e-04 | 3.46e-03 | 211 |
| GO:00066611 | Esophagus | ESCC | phosphatidylinositol biosynthetic process | 73/8552 | 131/18723 | 1.31e-02 | 4.28e-02 | 73 |
| GO:001605011 | Liver | Cirrhotic | vesicle organization | 133/4634 | 300/18723 | 7.35e-14 | 6.41e-12 | 133 |
| GO:00070301 | Liver | Cirrhotic | Golgi organization | 68/4634 | 157/18723 | 2.57e-07 | 6.41e-06 | 68 |
| GO:00070325 | Liver | Cirrhotic | endosome organization | 41/4634 | 82/18723 | 6.91e-07 | 1.47e-05 | 41 |
| GO:001605021 | Liver | HCC | vesicle organization | 194/7958 | 300/18723 | 5.58e-15 | 3.97e-13 | 194 |
| GO:000703211 | Liver | HCC | endosome organization | 61/7958 | 82/18723 | 4.36e-09 | 1.15e-07 | 61 |
| GO:00086542 | Liver | HCC | phospholipid biosynthetic process | 150/7958 | 253/18723 | 4.77e-08 | 1.03e-06 | 150 |
| GO:00066444 | Liver | HCC | phospholipid metabolic process | 214/7958 | 383/18723 | 7.25e-08 | 1.48e-06 | 214 |
| GO:00070302 | Liver | HCC | Golgi organization | 99/7958 | 157/18723 | 1.54e-07 | 2.85e-06 | 99 |
| GO:004648611 | Liver | HCC | glycerolipid metabolic process | 215/7958 | 392/18723 | 4.54e-07 | 7.49e-06 | 215 |
| GO:004501711 | Liver | HCC | glycerolipid biosynthetic process | 143/7958 | 252/18723 | 3.27e-06 | 4.31e-05 | 143 |
| Page: 1 2 |
| Pathway ID | Tissue | Disease Stage | Description | Gene Ratio | Bg Ratio | pvalue | p.adjust | qvalue | Count |
| Page: 1 |
Top |
Cell-cell communication analysis |
| Identification of potential cell-cell interactions between two cell types and their ligand-receptor pairs for different disease states |
| Ligand | Receptor | LRpair | Pathway | Tissue | Disease Stage |
| Page: 1 |
Top |
Single-cell gene regulatory network inference analysis |
| Find out the significant the regulons (TFs) and the target genes of each regulon across cell types for different disease states |
| TF | Cell Type | Tissue | Disease Stage | Target Gene | RSS | Regulon Activity |
| ∗The dot plots of a searched regulon are shown for all cell subpopulations in each disease state of each tissue based on the regulon specific score inferred using pySCENIC and by calculating the average expression. |
| Page: 1 |
Top |
Somatic mutation of malignant transformation related genes |
| Annotation of somatic variants for genes involved in malignant transformation |
| Hugo Symbol | Variant Class | Variant Classification | dbSNP RS | HGVSc | HGVSp | HGVSp Short | SWISSPROT | BIOTYPE | SIFT | PolyPhen | Tumor Sample Barcode | Tissue | Histology | Sex | Age | Stage | Therapy Types | Drugs | Outcome |
| PI4K2B | SNV | Missense_Mutation | c.556T>C | p.Tyr186His | p.Y186H | Q8TCG2 | protein_coding | deleterious(0.01) | probably_damaging(0.989) | TCGA-A8-A06O-01 | Breast | breast invasive carcinoma | Female | <65 | I/II | Hormone Therapy | letrozole | SD | |
| PI4K2B | SNV | Missense_Mutation | novel | c.1407N>T | p.Gln469His | p.Q469H | Q8TCG2 | protein_coding | deleterious(0) | probably_damaging(0.998) | TCGA-AR-A0TU-01 | Breast | breast invasive carcinoma | Female | <65 | I/II | Unspecific | Doxorubicin | SD |
| PI4K2B | SNV | Missense_Mutation | c.729G>C | p.Lys243Asn | p.K243N | Q8TCG2 | protein_coding | tolerated(0.07) | possibly_damaging(0.83) | TCGA-BH-A0DK-01 | Breast | breast invasive carcinoma | Female | <65 | I/II | Hormone Therapy | tamoxiphen | SD | |
| PI4K2B | SNV | Missense_Mutation | c.725G>A | p.Arg242Lys | p.R242K | Q8TCG2 | protein_coding | tolerated(0.25) | benign(0.015) | TCGA-D8-A27G-01 | Breast | breast invasive carcinoma | Female | >=65 | I/II | Unknown | Unknown | SD | |
| PI4K2B | insertion | Frame_Shift_Ins | novel | c.961_962insGAGGG | p.Lys321ArgfsTer22 | p.K321Rfs*22 | Q8TCG2 | protein_coding | TCGA-AO-A128-01 | Breast | breast invasive carcinoma | Female | <65 | I/II | Chemotherapy | doxorubicin | SD | ||
| PI4K2B | SNV | Missense_Mutation | novel | c.703N>C | p.Glu235Gln | p.E235Q | Q8TCG2 | protein_coding | tolerated(0.09) | probably_damaging(0.988) | TCGA-VS-A953-01 | Cervix | cervical & endocervical cancer | Female | <65 | I/II | Unknown | Unknown | PD |
| PI4K2B | SNV | Missense_Mutation | c.1109N>G | p.Ala370Gly | p.A370G | Q8TCG2 | protein_coding | deleterious(0) | probably_damaging(0.992) | TCGA-A6-5656-01 | Colorectum | colon adenocarcinoma | Male | >=65 | I/II | Unknown | Unknown | SD | |
| PI4K2B | SNV | Missense_Mutation | c.924N>G | p.Asp308Glu | p.D308E | Q8TCG2 | protein_coding | deleterious(0.01) | probably_damaging(0.927) | TCGA-EI-6513-01 | Colorectum | rectum adenocarcinoma | Male | <65 | III/IV | Unknown | Unknown | SD | |
| PI4K2B | deletion | Frame_Shift_Del | c.1242delT | p.Phe414LeufsTer7 | p.F414Lfs*7 | Q8TCG2 | protein_coding | TCGA-AA-3811-01 | Colorectum | colon adenocarcinoma | Female | >=65 | III/IV | Unknown | Unknown | PD | |||
| PI4K2B | insertion | Frame_Shift_Ins | novel | c.727_728insTTTGCATTAT | p.Lys243IlefsTer7 | p.K243Ifs*7 | Q8TCG2 | protein_coding | TCGA-AM-5820-01 | Colorectum | colon adenocarcinoma | Female | <65 | I/II | Unknown | Unknown | SD |
| Page: 1 2 3 4 |
Top |
Related drugs of malignant transformation related genes |
| Identification of chemicals and drugs interact with genes involved in malignant transfromation |
| (DGIdb 4.0) |
| Entrez ID | Symbol | Category | Interaction Types | Drug Claim Name | Drug Name | PMIDs |
| 55300 | PI4K2B | ENZYME, PHOSPHATIDYLINOSITOL 3 KINASE, DRUGGABLE GENOME, KINASE | inhibitor | 135651426 | ADENOSINE |
| Page: 1 |

Copyright 2023-Present -The University of Texas Health Science Center at Houston |