
|
|||||
|
 | |
| |
| |
| |
| |
| |
|
Gene: PI4K2A |
Gene summary for PI4K2A |
| Gene information | Species | Human | Gene symbol | PI4K2A | Gene ID | 55361 |
| Gene name | phosphatidylinositol 4-kinase type 2 alpha | |
| Gene Alias | PI4KII | |
| Cytomap | 10q24.2 | |
| Gene Type | protein-coding | GO ID | GO:0001775 | UniProtAcc | Q9BTU6 |
Top |
Malignant transformation analysis |
| Identification of the aberrant gene expression in precancerous and cancerous lesions by comparing the gene expression of stem-like cells in diseased tissues with normal stem cells |
| Entrez ID | Symbol | Replicates | Species | Organ | Tissue | Adj P-value | Log2FC | Malignancy |
| 55361 | PI4K2A | HCC1_Meng | Human | Liver | HCC | 3.73e-06 | 1.05e-02 | 0.0246 |
| 55361 | PI4K2A | HCC2 | Human | Liver | HCC | 3.26e-05 | 2.25e+00 | 0.5341 |
| 55361 | PI4K2A | S014 | Human | Liver | HCC | 4.05e-03 | 1.97e-01 | 0.2254 |
| 55361 | PI4K2A | S027 | Human | Liver | HCC | 1.04e-04 | 3.64e-01 | 0.2446 |
| 55361 | PI4K2A | S028 | Human | Liver | HCC | 4.89e-13 | 4.37e-01 | 0.2503 |
| 55361 | PI4K2A | S029 | Human | Liver | HCC | 1.03e-11 | 5.33e-01 | 0.2581 |
| 55361 | PI4K2A | C04 | Human | Oral cavity | OSCC | 8.81e-04 | 3.79e-01 | 0.2633 |
| 55361 | PI4K2A | C21 | Human | Oral cavity | OSCC | 1.12e-16 | 5.64e-01 | 0.2678 |
| 55361 | PI4K2A | C30 | Human | Oral cavity | OSCC | 2.04e-22 | 8.97e-01 | 0.3055 |
| 55361 | PI4K2A | C38 | Human | Oral cavity | OSCC | 3.69e-02 | 3.96e-01 | 0.172 |
| 55361 | PI4K2A | C43 | Human | Oral cavity | OSCC | 1.64e-04 | 8.76e-02 | 0.1704 |
| 55361 | PI4K2A | C51 | Human | Oral cavity | OSCC | 2.21e-02 | 3.07e-01 | 0.2674 |
| 55361 | PI4K2A | C57 | Human | Oral cavity | OSCC | 1.82e-02 | 2.38e-01 | 0.1679 |
| 55361 | PI4K2A | C08 | Human | Oral cavity | OSCC | 2.13e-06 | 1.48e-01 | 0.1919 |
| 55361 | PI4K2A | SYSMH1 | Human | Oral cavity | OSCC | 1.60e-12 | 1.89e-01 | 0.1127 |
| 55361 | PI4K2A | SYSMH2 | Human | Oral cavity | OSCC | 7.76e-05 | 1.97e-01 | 0.2326 |
| 55361 | PI4K2A | SYSMH3 | Human | Oral cavity | OSCC | 4.03e-12 | 3.39e-01 | 0.2442 |
| Page: 1 |
| Tissue | Expression Dynamics | Abbreviation |
| Liver |  | HCC: Hepatocellular carcinoma |
| NAFLD: Non-alcoholic fatty liver disease | ||
| Oral Cavity | 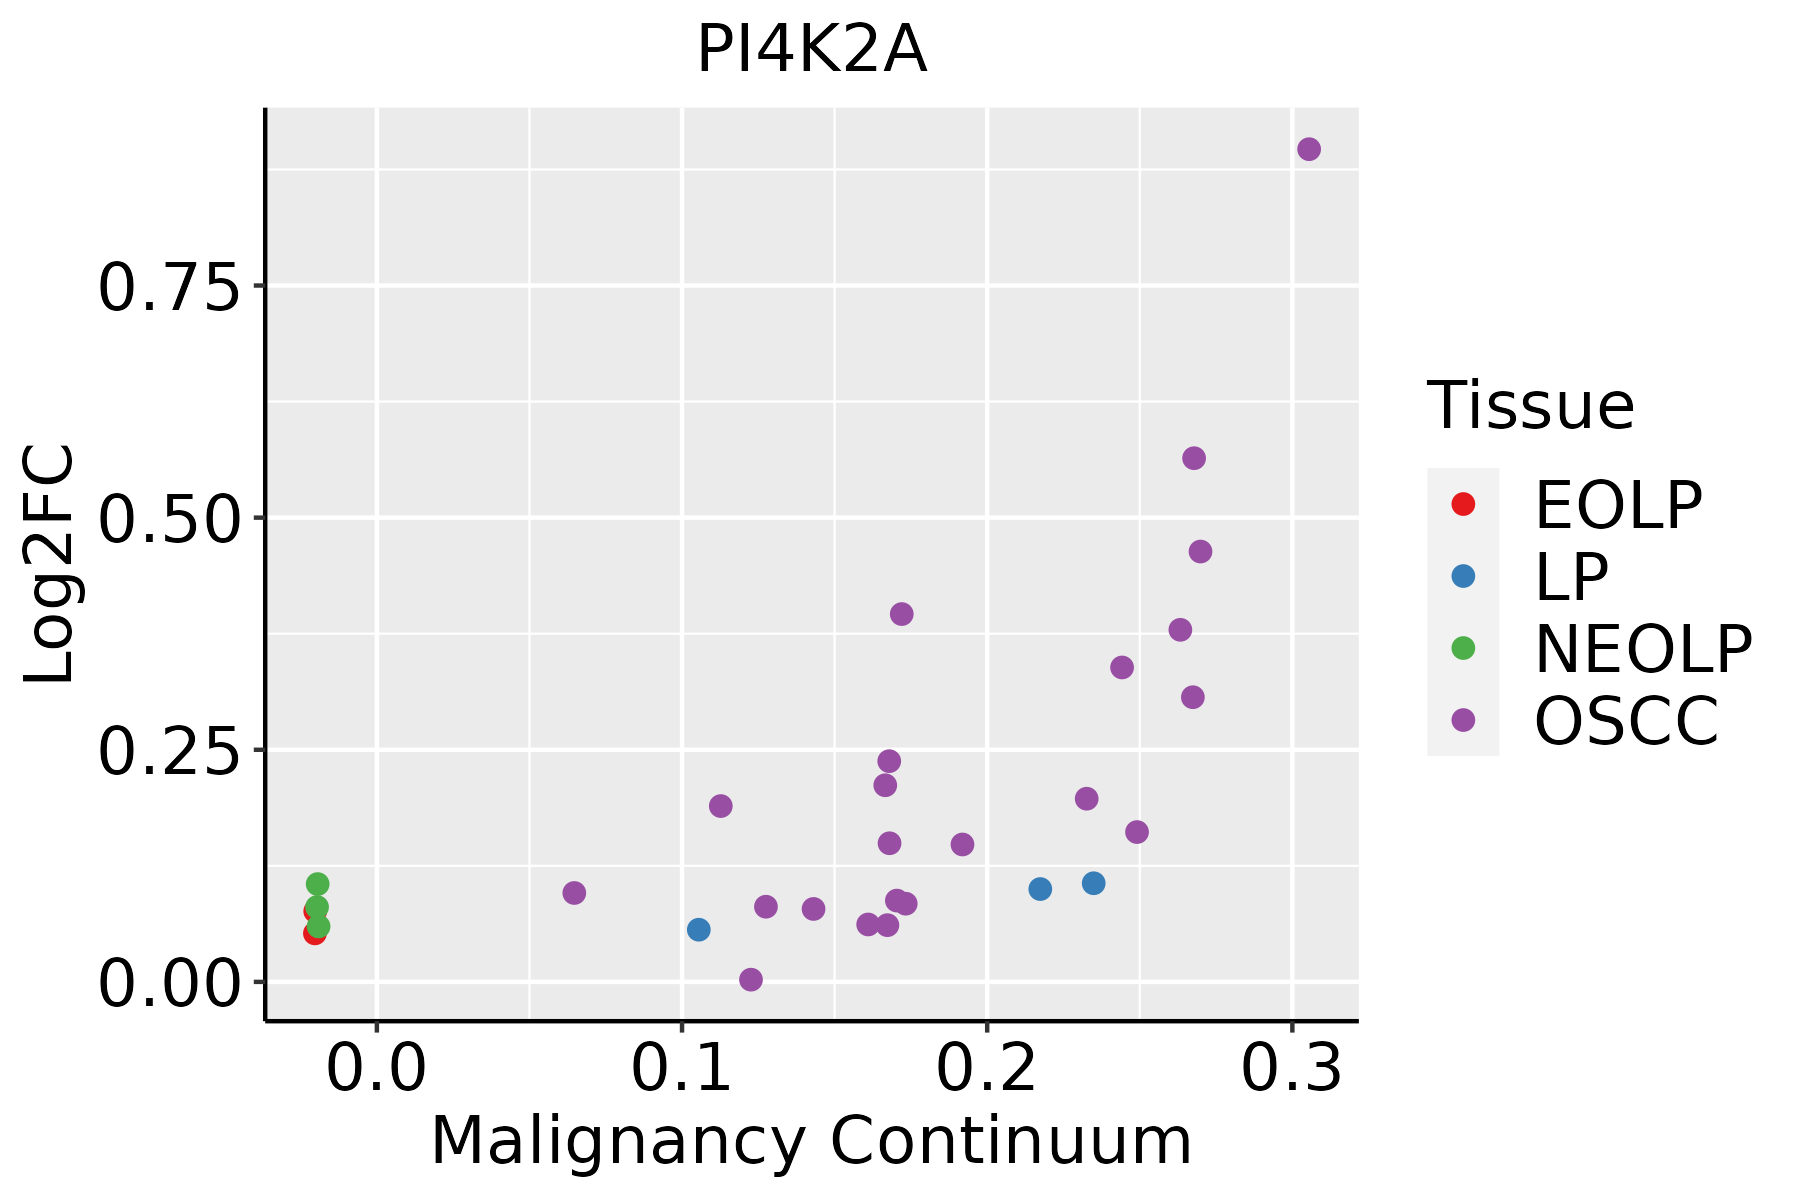 | EOLP: Erosive Oral lichen planus |
| LP: leukoplakia | ||
| NEOLP: Non-erosive oral lichen planus | ||
| OSCC: Oral squamous cell carcinoma |
| ∗log2FC in expression of this searched gene in stem-like cells from each diseased tissue sample relative to stem-like cells in normal samples in each tissue plotted against the malignancy continuum. Samples are colored based on if they are from different disease stage. |
Top |
Malignant transformation related pathway analysis |
| Find out the enriched GO biological processes and KEGG pathways involved in transition from healthy to precancer to cancer |
| Tissue | Disease Stage | Enriched GO biological Processes |
| Colorectum | AD |  |
| Colorectum | SER |  |
| Colorectum | MSS |  |
| Colorectum | MSI-H |  |
| Colorectum | FAP |  |
| ∗Top 15 enriched GO BP terms are showed in the bar plot of each disease state in each tissue. Each row represents a significant GO biological process which is colored according to the -log10(p.adjust). |
| Page: 1 2 3 4 5 6 7 8 9 |
| GO ID | Tissue | Disease Stage | Description | Gene Ratio | Bg Ratio | pvalue | p.adjust | Count |
| GO:001605021 | Liver | HCC | vesicle organization | 194/7958 | 300/18723 | 5.58e-15 | 3.97e-13 | 194 |
| GO:000703211 | Liver | HCC | endosome organization | 61/7958 | 82/18723 | 4.36e-09 | 1.15e-07 | 61 |
| GO:00086542 | Liver | HCC | phospholipid biosynthetic process | 150/7958 | 253/18723 | 4.77e-08 | 1.03e-06 | 150 |
| GO:00066444 | Liver | HCC | phospholipid metabolic process | 214/7958 | 383/18723 | 7.25e-08 | 1.48e-06 | 214 |
| GO:00070302 | Liver | HCC | Golgi organization | 99/7958 | 157/18723 | 1.54e-07 | 2.85e-06 | 99 |
| GO:004648611 | Liver | HCC | glycerolipid metabolic process | 215/7958 | 392/18723 | 4.54e-07 | 7.49e-06 | 215 |
| GO:004501711 | Liver | HCC | glycerolipid biosynthetic process | 143/7958 | 252/18723 | 3.27e-06 | 4.31e-05 | 143 |
| GO:00066504 | Liver | HCC | glycerophospholipid metabolic process | 168/7958 | 306/18723 | 7.27e-06 | 8.62e-05 | 168 |
| GO:004647411 | Liver | HCC | glycerophospholipid biosynthetic process | 121/7958 | 211/18723 | 9.12e-06 | 1.06e-04 | 121 |
| GO:0006661 | Liver | HCC | phosphatidylinositol biosynthetic process | 69/7958 | 131/18723 | 1.19e-02 | 4.35e-02 | 69 |
| GO:00160508 | Oral cavity | OSCC | vesicle organization | 189/7305 | 300/18723 | 2.40e-17 | 2.14e-15 | 189 |
| GO:00070327 | Oral cavity | OSCC | endosome organization | 59/7305 | 82/18723 | 1.41e-09 | 3.39e-08 | 59 |
| GO:00070307 | Oral cavity | OSCC | Golgi organization | 92/7305 | 157/18723 | 4.96e-07 | 7.27e-06 | 92 |
| GO:00086543 | Oral cavity | OSCC | phospholipid biosynthetic process | 130/7305 | 253/18723 | 3.96e-05 | 3.46e-04 | 130 |
| GO:00464743 | Oral cavity | OSCC | glycerophospholipid biosynthetic process | 102/7305 | 211/18723 | 3.50e-03 | 1.48e-02 | 102 |
| GO:0036230 | Oral cavity | OSCC | granulocyte activation | 26/7305 | 43/18723 | 3.55e-03 | 1.49e-02 | 26 |
| GO:00066445 | Oral cavity | OSCC | phospholipid metabolic process | 175/7305 | 383/18723 | 4.21e-03 | 1.71e-02 | 175 |
| GO:00024441 | Oral cavity | OSCC | myeloid leukocyte mediated immunity | 50/7305 | 99/18723 | 1.31e-02 | 4.34e-02 | 50 |
| Page: 1 |
| Pathway ID | Tissue | Disease Stage | Description | Gene Ratio | Bg Ratio | pvalue | p.adjust | qvalue | Count |
| Page: 1 |
Top |
Cell-cell communication analysis |
| Identification of potential cell-cell interactions between two cell types and their ligand-receptor pairs for different disease states |
| Ligand | Receptor | LRpair | Pathway | Tissue | Disease Stage |
| Page: 1 |
Top |
Single-cell gene regulatory network inference analysis |
| Find out the significant the regulons (TFs) and the target genes of each regulon across cell types for different disease states |
| TF | Cell Type | Tissue | Disease Stage | Target Gene | RSS | Regulon Activity |
| ∗The dot plots of a searched regulon are shown for all cell subpopulations in each disease state of each tissue based on the regulon specific score inferred using pySCENIC and by calculating the average expression. |
| Page: 1 |
Top |
Somatic mutation of malignant transformation related genes |
| Annotation of somatic variants for genes involved in malignant transformation |
| Hugo Symbol | Variant Class | Variant Classification | dbSNP RS | HGVSc | HGVSp | HGVSp Short | SWISSPROT | BIOTYPE | SIFT | PolyPhen | Tumor Sample Barcode | Tissue | Histology | Sex | Age | Stage | Therapy Types | Drugs | Outcome |
| PI4K2A | SNV | Missense_Mutation | c.832G>A | p.Glu278Lys | p.E278K | Q9BTU6 | protein_coding | deleterious(0.04) | possibly_damaging(0.733) | TCGA-C8-A1HM-01 | Breast | breast invasive carcinoma | Female | >=65 | I/II | Chemotherapy | doxorubicin | CR | |
| PI4K2A | insertion | Frame_Shift_Ins | novel | c.1075_1076insCTTGTCCTTTTCCTTTTCATGCACCACTGAA | p.Trp359SerfsTer44 | p.W359Sfs*44 | Q9BTU6 | protein_coding | TCGA-AO-A0J9-01 | Breast | breast invasive carcinoma | Female | <65 | III/IV | Chemotherapy | cyclophosphamide | PD | ||
| PI4K2A | SNV | Missense_Mutation | c.887N>T | p.Arg296Leu | p.R296L | Q9BTU6 | protein_coding | deleterious(0.03) | possibly_damaging(0.733) | TCGA-DS-A7WF-01 | Cervix | cervical & endocervical cancer | Female | <65 | I/II | Chemotherapy | cisplatin | PD | |
| PI4K2A | SNV | Missense_Mutation | rs754584429 | c.913N>T | p.Arg305Cys | p.R305C | Q9BTU6 | protein_coding | deleterious(0) | probably_damaging(1) | TCGA-A6-6653-01 | Colorectum | colon adenocarcinoma | Male | >=65 | I/II | Unknown | Unknown | SD |
| PI4K2A | SNV | Missense_Mutation | c.618N>G | p.Asn206Lys | p.N206K | Q9BTU6 | protein_coding | deleterious(0.02) | benign(0.42) | TCGA-AA-3710-01 | Colorectum | colon adenocarcinoma | Female | >=65 | I/II | Unknown | Unknown | SD | |
| PI4K2A | SNV | Missense_Mutation | rs773928681 | c.1375N>T | p.Arg459Trp | p.R459W | Q9BTU6 | protein_coding | deleterious(0) | possibly_damaging(0.586) | TCGA-AA-3864-01 | Colorectum | colon adenocarcinoma | Male | >=65 | I/II | Unknown | Unknown | SD |
| PI4K2A | SNV | Missense_Mutation | novel | c.608N>C | p.Leu203Pro | p.L203P | Q9BTU6 | protein_coding | deleterious(0) | probably_damaging(0.999) | TCGA-CA-6717-01 | Colorectum | colon adenocarcinoma | Male | <65 | I/II | Chemotherapy | oxaliplatin | CR |
| PI4K2A | SNV | Missense_Mutation | c.817N>C | p.Trp273Arg | p.W273R | Q9BTU6 | protein_coding | deleterious(0) | probably_damaging(0.979) | TCGA-CA-6718-01 | Colorectum | colon adenocarcinoma | Male | <65 | I/II | Unknown | Unknown | PD | |
| PI4K2A | SNV | Missense_Mutation | rs750236260 | c.886N>T | p.Arg296Trp | p.R296W | Q9BTU6 | protein_coding | deleterious(0) | probably_damaging(0.998) | TCGA-G4-6628-01 | Colorectum | colon adenocarcinoma | Male | >=65 | I/II | Unknown | Unknown | SD |
| PI4K2A | SNV | Missense_Mutation | novel | c.739N>T | p.Arg247Trp | p.R247W | Q9BTU6 | protein_coding | deleterious(0.01) | probably_damaging(0.932) | TCGA-A5-A0G2-01 | Endometrium | uterine corpus endometrioid carcinoma | Female | <65 | III/IV | Unknown | Unknown | SD |
| Page: 1 2 3 4 |
Top |
Related drugs of malignant transformation related genes |
| Identification of chemicals and drugs interact with genes involved in malignant transfromation |
| (DGIdb 4.0) |
| Entrez ID | Symbol | Category | Interaction Types | Drug Claim Name | Drug Name | PMIDs |
| 55361 | PI4K2A | DRUGGABLE GENOME, PHOSPHATIDYLINOSITOL 3 KINASE, KINASE, ENZYME | inhibitor | 135651426 | ADENOSINE |
| Page: 1 |

Copyright 2023-Present -The University of Texas Health Science Center at Houston |