
|
|||||
|
 | |
| |
| |
| |
| |
| |
|
Gene: PI15 |
Gene summary for PI15 |
| Gene information | Species | Human | Gene symbol | PI15 | Gene ID | 51050 |
| Gene name | peptidase inhibitor 15 | |
| Gene Alias | CRISP8 | |
| Cytomap | 8q21.13 | |
| Gene Type | protein-coding | GO ID | GO:0006508 | UniProtAcc | O43692 |
Top |
Malignant transformation analysis |
| Identification of the aberrant gene expression in precancerous and cancerous lesions by comparing the gene expression of stem-like cells in diseased tissues with normal stem cells |
| Entrez ID | Symbol | Replicates | Species | Organ | Tissue | Adj P-value | Log2FC | Malignancy |
| 51050 | PI15 | GSM4909307 | Human | Breast | IDC | 3.61e-29 | 7.31e-01 | 0.1569 |
| 51050 | PI15 | GSM4909308 | Human | Breast | IDC | 1.34e-31 | 6.45e-01 | 0.158 |
| 51050 | PI15 | DCIS2 | Human | Breast | DCIS | 3.72e-03 | 5.40e-02 | 0.0085 |
| 51050 | PI15 | GSM5252137_BPH556PrGA2_Fcol | Human | Prostate | BPH | 6.16e-04 | 5.92e-01 | -0.23 |
| 51050 | PI15 | 052099_1652-all-cells | Human | Prostate | BPH | 4.97e-02 | 2.98e-01 | 0.1038 |
| 51050 | PI15 | Dong_P3 | Human | Prostate | Tumor | 1.39e-03 | 1.01e-01 | 0.0278 |
| 51050 | PI15 | GSM5353215_PA_AUG_PB_1B_S2 | Human | Prostate | Tumor | 1.92e-05 | 8.78e-01 | 0.1557 |
| 51050 | PI15 | GSM5353224_PA_PR5186_Pool_1_2_3_S27_L001 | Human | Prostate | Tumor | 3.40e-05 | 6.37e-01 | 0.1621 |
| 51050 | PI15 | GSM5353236_PA_PR5251_T1_S7_L001 | Human | Prostate | Tumor | 4.62e-08 | 9.04e-01 | 0.1608 |
| 51050 | PI15 | GSM5353237_PA_PR5251_T2_S8_L001 | Human | Prostate | Tumor | 2.10e-04 | 7.96e-01 | 0.1622 |
| 51050 | PI15 | GSM5353240_PA_PR5254_T1_S15_L001 | Human | Prostate | Tumor | 1.34e-03 | 4.26e-01 | 0.1575 |
| 51050 | PI15 | GSM5353243_PA_PR5261_T1_S23_L002 | Human | Prostate | Tumor | 1.34e-03 | 3.39e-01 | 0.1545 |
| 51050 | PI15 | GSM5353244_PA_PR5261_T2_S24_L002 | Human | Prostate | Tumor | 1.59e-03 | 4.21e-01 | 0.1569 |
| Page: 1 |
| Tissue | Expression Dynamics | Abbreviation |
| Breast | 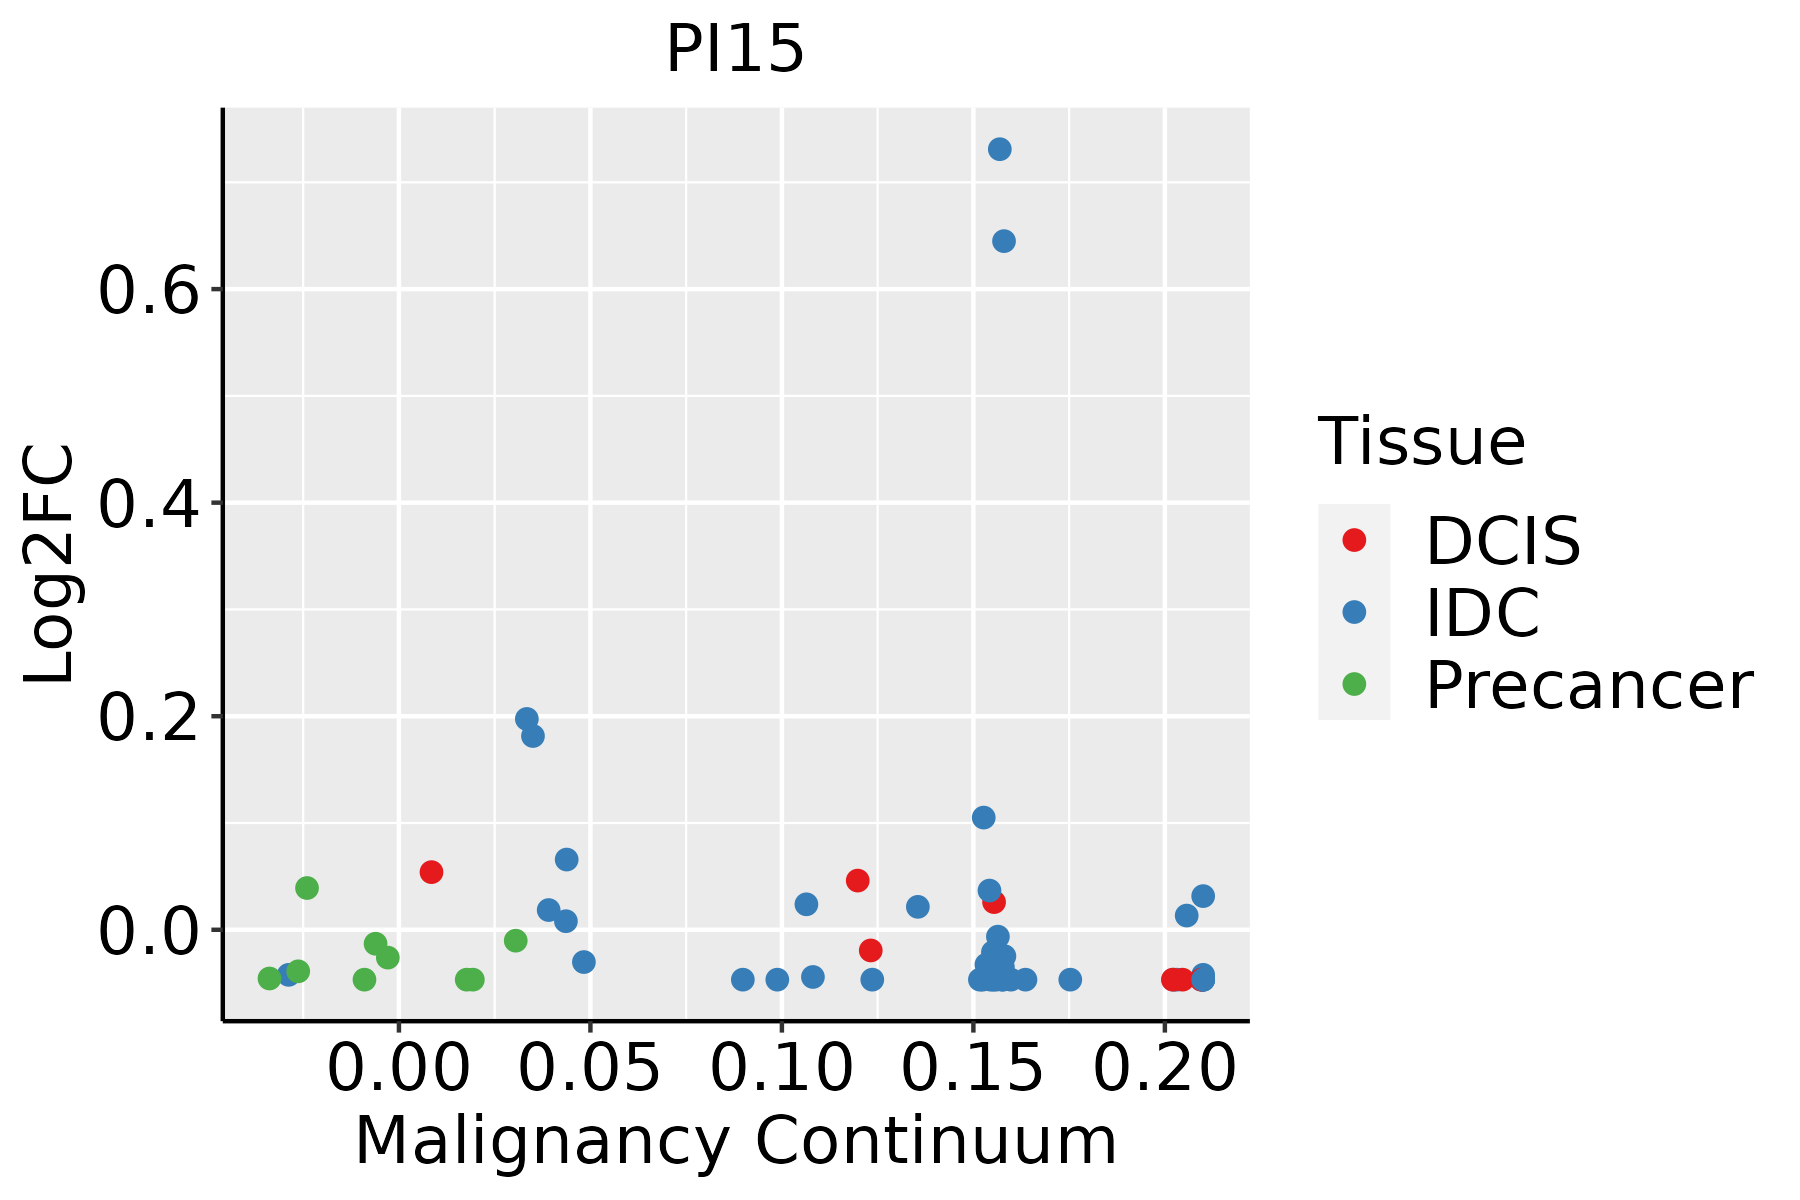 | IDC: Invasive ductal carcinoma |
| DCIS: Ductal carcinoma in situ | ||
| Precancer(BRCA1-mut): Precancerous lesion from BRCA1 mutation carriers | ||
| Prostate | 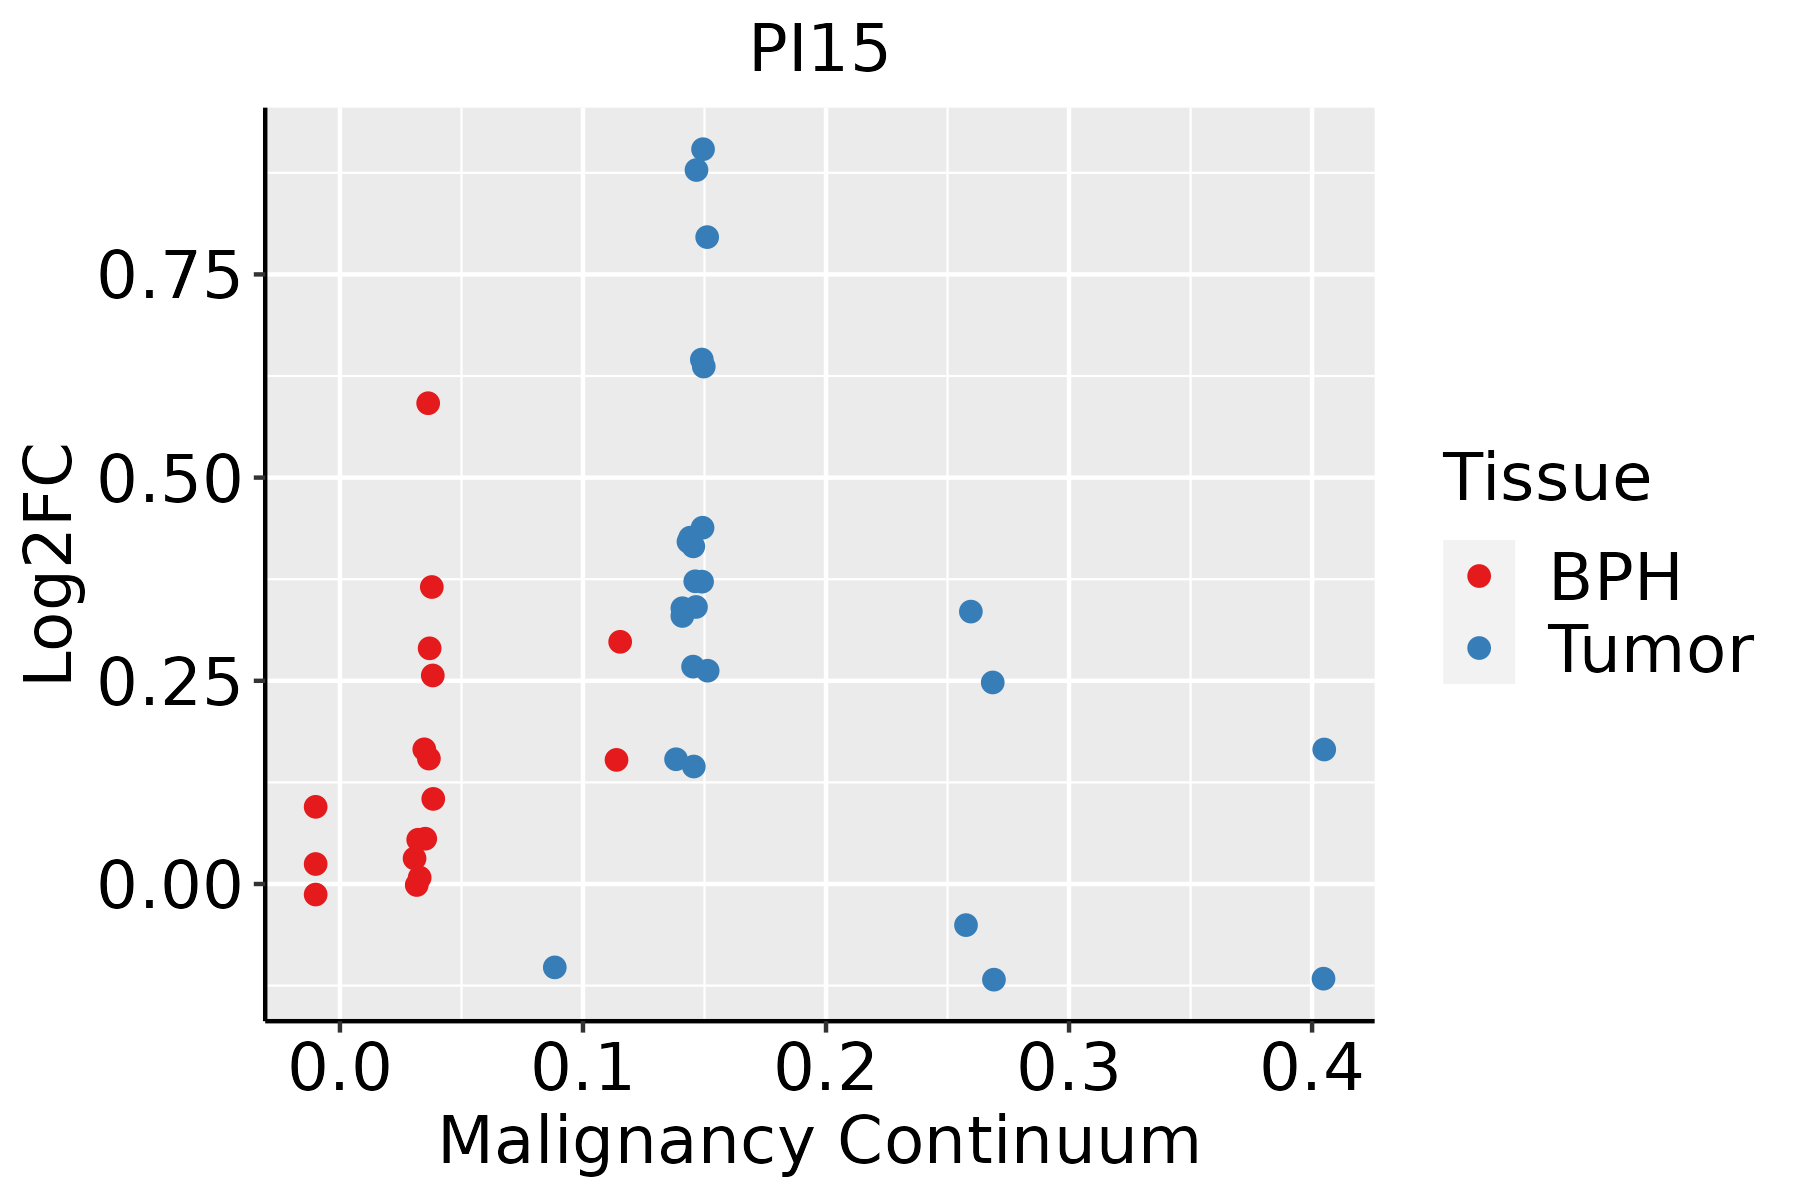 | BPH: Benign Prostatic Hyperplasia |
| ∗log2FC in expression of this searched gene in stem-like cells from each diseased tissue sample relative to stem-like cells in normal samples in each tissue plotted against the malignancy continuum. Samples are colored based on if they are from different disease stage. |
Top |
Malignant transformation related pathway analysis |
| Find out the enriched GO biological processes and KEGG pathways involved in transition from healthy to precancer to cancer |
| Tissue | Disease Stage | Enriched GO biological Processes |
| Colorectum | AD |  |
| Colorectum | SER |  |
| Colorectum | MSS |  |
| Colorectum | MSI-H |  |
| Colorectum | FAP |  |
| ∗Top 15 enriched GO BP terms are showed in the bar plot of each disease state in each tissue. Each row represents a significant GO biological process which is colored according to the -log10(p.adjust). |
| Page: 1 2 3 4 5 6 7 8 9 |
| GO ID | Tissue | Disease Stage | Description | Gene Ratio | Bg Ratio | pvalue | p.adjust | Count |
| GO:005254714 | Breast | IDC | regulation of peptidase activity | 96/1434 | 461/18723 | 7.58e-20 | 6.15e-17 | 96 |
| GO:004586114 | Breast | IDC | negative regulation of proteolysis | 70/1434 | 351/18723 | 8.21e-14 | 2.22e-11 | 70 |
| GO:005134613 | Breast | IDC | negative regulation of hydrolase activity | 71/1434 | 379/18723 | 1.33e-12 | 2.90e-10 | 71 |
| GO:001046613 | Breast | IDC | negative regulation of peptidase activity | 56/1434 | 262/18723 | 1.39e-12 | 2.92e-10 | 56 |
| GO:005254723 | Breast | DCIS | regulation of peptidase activity | 88/1390 | 461/18723 | 1.18e-16 | 4.78e-14 | 88 |
| GO:004586123 | Breast | DCIS | negative regulation of proteolysis | 63/1390 | 351/18723 | 4.39e-11 | 6.06e-09 | 63 |
| GO:005134623 | Breast | DCIS | negative regulation of hydrolase activity | 64/1390 | 379/18723 | 4.32e-10 | 4.80e-08 | 64 |
| GO:001046622 | Breast | DCIS | negative regulation of peptidase activity | 49/1390 | 262/18723 | 1.54e-09 | 1.43e-07 | 49 |
| GO:005254718 | Prostate | BPH | regulation of peptidase activity | 133/3107 | 461/18723 | 2.08e-11 | 1.43e-09 | 133 |
| GO:004586118 | Prostate | BPH | negative regulation of proteolysis | 98/3107 | 351/18723 | 5.43e-08 | 1.49e-06 | 98 |
| GO:005134616 | Prostate | BPH | negative regulation of hydrolase activity | 94/3107 | 379/18723 | 2.46e-05 | 2.94e-04 | 94 |
| GO:001046616 | Prostate | BPH | negative regulation of peptidase activity | 68/3107 | 262/18723 | 7.28e-05 | 7.13e-04 | 68 |
| GO:005254719 | Prostate | Tumor | regulation of peptidase activity | 137/3246 | 461/18723 | 2.48e-11 | 1.71e-09 | 137 |
| GO:004586119 | Prostate | Tumor | negative regulation of proteolysis | 102/3246 | 351/18723 | 3.09e-08 | 9.94e-07 | 102 |
| GO:005134617 | Prostate | Tumor | negative regulation of hydrolase activity | 97/3246 | 379/18723 | 2.87e-05 | 3.46e-04 | 97 |
| GO:001046617 | Prostate | Tumor | negative regulation of peptidase activity | 70/3246 | 262/18723 | 8.76e-05 | 8.66e-04 | 70 |
| Page: 1 |
| Pathway ID | Tissue | Disease Stage | Description | Gene Ratio | Bg Ratio | pvalue | p.adjust | qvalue | Count |
| Page: 1 |
Top |
Cell-cell communication analysis |
| Identification of potential cell-cell interactions between two cell types and their ligand-receptor pairs for different disease states |
| Ligand | Receptor | LRpair | Pathway | Tissue | Disease Stage |
| Page: 1 |
Top |
Single-cell gene regulatory network inference analysis |
| Find out the significant the regulons (TFs) and the target genes of each regulon across cell types for different disease states |
| TF | Cell Type | Tissue | Disease Stage | Target Gene | RSS | Regulon Activity |
| ∗The dot plots of a searched regulon are shown for all cell subpopulations in each disease state of each tissue based on the regulon specific score inferred using pySCENIC and by calculating the average expression. |
| Page: 1 |
Top |
Somatic mutation of malignant transformation related genes |
| Annotation of somatic variants for genes involved in malignant transformation |
| Hugo Symbol | Variant Class | Variant Classification | dbSNP RS | HGVSc | HGVSp | HGVSp Short | SWISSPROT | BIOTYPE | SIFT | PolyPhen | Tumor Sample Barcode | Tissue | Histology | Sex | Age | Stage | Therapy Types | Drugs | Outcome |
| PI15 | SNV | Missense_Mutation | novel | c.299N>T | p.Ser100Leu | p.S100L | O43692 | protein_coding | deleterious(0.01) | benign(0.04) | TCGA-AN-A046-01 | Breast | breast invasive carcinoma | Female | >=65 | I/II | Unknown | Unknown | SD |
| PI15 | SNV | Missense_Mutation | rs200651515 | c.382N>T | p.Arg128Cys | p.R128C | O43692 | protein_coding | deleterious(0.01) | probably_damaging(0.917) | TCGA-AR-A24K-01 | Breast | breast invasive carcinoma | Female | <65 | I/II | Unspecific | Paclitaxel | SD |
| PI15 | SNV | Missense_Mutation | c.386N>T | p.Thr129Ile | p.T129I | O43692 | protein_coding | tolerated(0.39) | probably_damaging(0.928) | TCGA-AR-A256-01 | Breast | breast invasive carcinoma | Female | <65 | I/II | Chemotherapy | doxorubicin | PD | |
| PI15 | SNV | Missense_Mutation | c.724N>C | p.Asp242His | p.D242H | O43692 | protein_coding | deleterious(0) | possibly_damaging(0.472) | TCGA-E9-A1R5-01 | Breast | breast invasive carcinoma | Female | <65 | I/II | Hormone Therapy | tamoxiphen | SD | |
| PI15 | deletion | Frame_Shift_Del | novel | c.460delN | p.Gln155ArgfsTer9 | p.Q155Rfs*9 | O43692 | protein_coding | TCGA-D8-A27V-01 | Breast | breast invasive carcinoma | Female | <65 | I/II | Hormone Therapy | tamoxiphen | SD | ||
| PI15 | SNV | Missense_Mutation | rs142164571 | c.559N>A | p.Ala187Thr | p.A187T | O43692 | protein_coding | deleterious(0) | probably_damaging(1) | TCGA-2W-A8YY-01 | Cervix | cervical & endocervical cancer | Female | <65 | I/II | Chemotherapy | cisplatin | CR |
| PI15 | SNV | Missense_Mutation | rs200713288 | c.383N>A | p.Arg128His | p.R128H | O43692 | protein_coding | tolerated(1) | benign(0.007) | TCGA-AA-3837-01 | Colorectum | colon adenocarcinoma | Male | >=65 | I/II | Unknown | Unknown | SD |
| PI15 | SNV | Missense_Mutation | novel | c.365G>T | p.Gly122Val | p.G122V | O43692 | protein_coding | deleterious(0) | probably_damaging(0.999) | TCGA-AA-3867-01 | Colorectum | colon adenocarcinoma | Male | >=65 | III/IV | Unknown | Unknown | PD |
| PI15 | SNV | Missense_Mutation | novel | c.586N>A | p.Val196Ile | p.V196I | O43692 | protein_coding | tolerated(0.1) | possibly_damaging(0.794) | TCGA-AA-3930-01 | Colorectum | colon adenocarcinoma | Male | >=65 | III/IV | Chemotherapy | capecitabine | PD |
| PI15 | SNV | Missense_Mutation | rs192682386 | c.188C>T | p.Ser63Leu | p.S63L | O43692 | protein_coding | tolerated(0.05) | possibly_damaging(0.808) | TCGA-AA-A00N-01 | Colorectum | colon adenocarcinoma | Male | >=65 | I/II | Unknown | Unknown | PD |
| Page: 1 2 3 4 5 6 7 |
Top |
Related drugs of malignant transformation related genes |
| Identification of chemicals and drugs interact with genes involved in malignant transfromation |
| (DGIdb 4.0) |
| Entrez ID | Symbol | Category | Interaction Types | Drug Claim Name | Drug Name | PMIDs |
| Page: 1 |

Copyright 2023-Present -The University of Texas Health Science Center at Houston |