
|
|||||
|
 | |
| |
| |
| |
| |
| |
|
Gene: PHYKPL |
Gene summary for PHYKPL |
| Gene information | Species | Human | Gene symbol | PHYKPL | Gene ID | 85007 |
| Gene name | 5-phosphohydroxy-L-lysine phospho-lyase | |
| Gene Alias | AGXT2L2 | |
| Cytomap | 5q35.3 | |
| Gene Type | protein-coding | GO ID | GO:0005575 | UniProtAcc | Q8IUZ5 |
Top |
Malignant transformation analysis |
| Identification of the aberrant gene expression in precancerous and cancerous lesions by comparing the gene expression of stem-like cells in diseased tissues with normal stem cells |
| Entrez ID | Symbol | Replicates | Species | Organ | Tissue | Adj P-value | Log2FC | Malignancy |
| 85007 | PHYKPL | HTA11_3410_2000001011 | Human | Colorectum | AD | 8.60e-06 | -3.73e-01 | 0.0155 |
| 85007 | PHYKPL | HTA11_347_2000001011 | Human | Colorectum | AD | 1.04e-24 | 8.64e-01 | -0.1954 |
| 85007 | PHYKPL | HTA11_411_2000001011 | Human | Colorectum | SER | 1.16e-03 | 8.25e-01 | -0.2602 |
| 85007 | PHYKPL | HTA11_2112_2000001011 | Human | Colorectum | SER | 3.67e-02 | 6.70e-01 | -0.2196 |
| 85007 | PHYKPL | HTA11_83_2000001011 | Human | Colorectum | SER | 6.07e-09 | 6.68e-01 | -0.1526 |
| 85007 | PHYKPL | HTA11_696_2000001011 | Human | Colorectum | AD | 6.14e-13 | 6.90e-01 | -0.1464 |
| 85007 | PHYKPL | HTA11_866_2000001011 | Human | Colorectum | AD | 1.35e-10 | 5.80e-01 | -0.1001 |
| 85007 | PHYKPL | HTA11_1391_2000001011 | Human | Colorectum | AD | 2.38e-02 | 4.47e-01 | -0.059 |
| 85007 | PHYKPL | HTA11_546_2000001011 | Human | Colorectum | AD | 2.02e-02 | 4.95e-01 | -0.0842 |
| 85007 | PHYKPL | F007 | Human | Colorectum | FAP | 2.93e-04 | -3.30e-01 | 0.1176 |
| 85007 | PHYKPL | A001-C-207 | Human | Colorectum | FAP | 6.93e-04 | -3.18e-01 | 0.1278 |
| 85007 | PHYKPL | A015-C-203 | Human | Colorectum | FAP | 1.59e-27 | -4.63e-01 | -0.1294 |
| 85007 | PHYKPL | A015-C-204 | Human | Colorectum | FAP | 2.72e-10 | -4.70e-01 | -0.0228 |
| 85007 | PHYKPL | A014-C-040 | Human | Colorectum | FAP | 5.90e-04 | -4.77e-01 | -0.1184 |
| 85007 | PHYKPL | A002-C-201 | Human | Colorectum | FAP | 2.70e-14 | -4.43e-01 | 0.0324 |
| 85007 | PHYKPL | A002-C-203 | Human | Colorectum | FAP | 9.83e-07 | -2.76e-01 | 0.2786 |
| 85007 | PHYKPL | A001-C-119 | Human | Colorectum | FAP | 2.13e-07 | -4.11e-01 | -0.1557 |
| 85007 | PHYKPL | A001-C-108 | Human | Colorectum | FAP | 1.79e-14 | -3.21e-01 | -0.0272 |
| 85007 | PHYKPL | A002-C-205 | Human | Colorectum | FAP | 1.89e-19 | -4.41e-01 | -0.1236 |
| 85007 | PHYKPL | A001-C-104 | Human | Colorectum | FAP | 3.05e-04 | -3.07e-01 | 0.0184 |
| Page: 1 2 3 4 5 6 7 |
| Tissue | Expression Dynamics | Abbreviation |
| Colorectum (GSE201348) |  | FAP: Familial adenomatous polyposis |
| CRC: Colorectal cancer | ||
| Colorectum (HTA11) |  | AD: Adenomas |
| SER: Sessile serrated lesions | ||
| MSI-H: Microsatellite-high colorectal cancer | ||
| MSS: Microsatellite stable colorectal cancer | ||
| Esophagus | 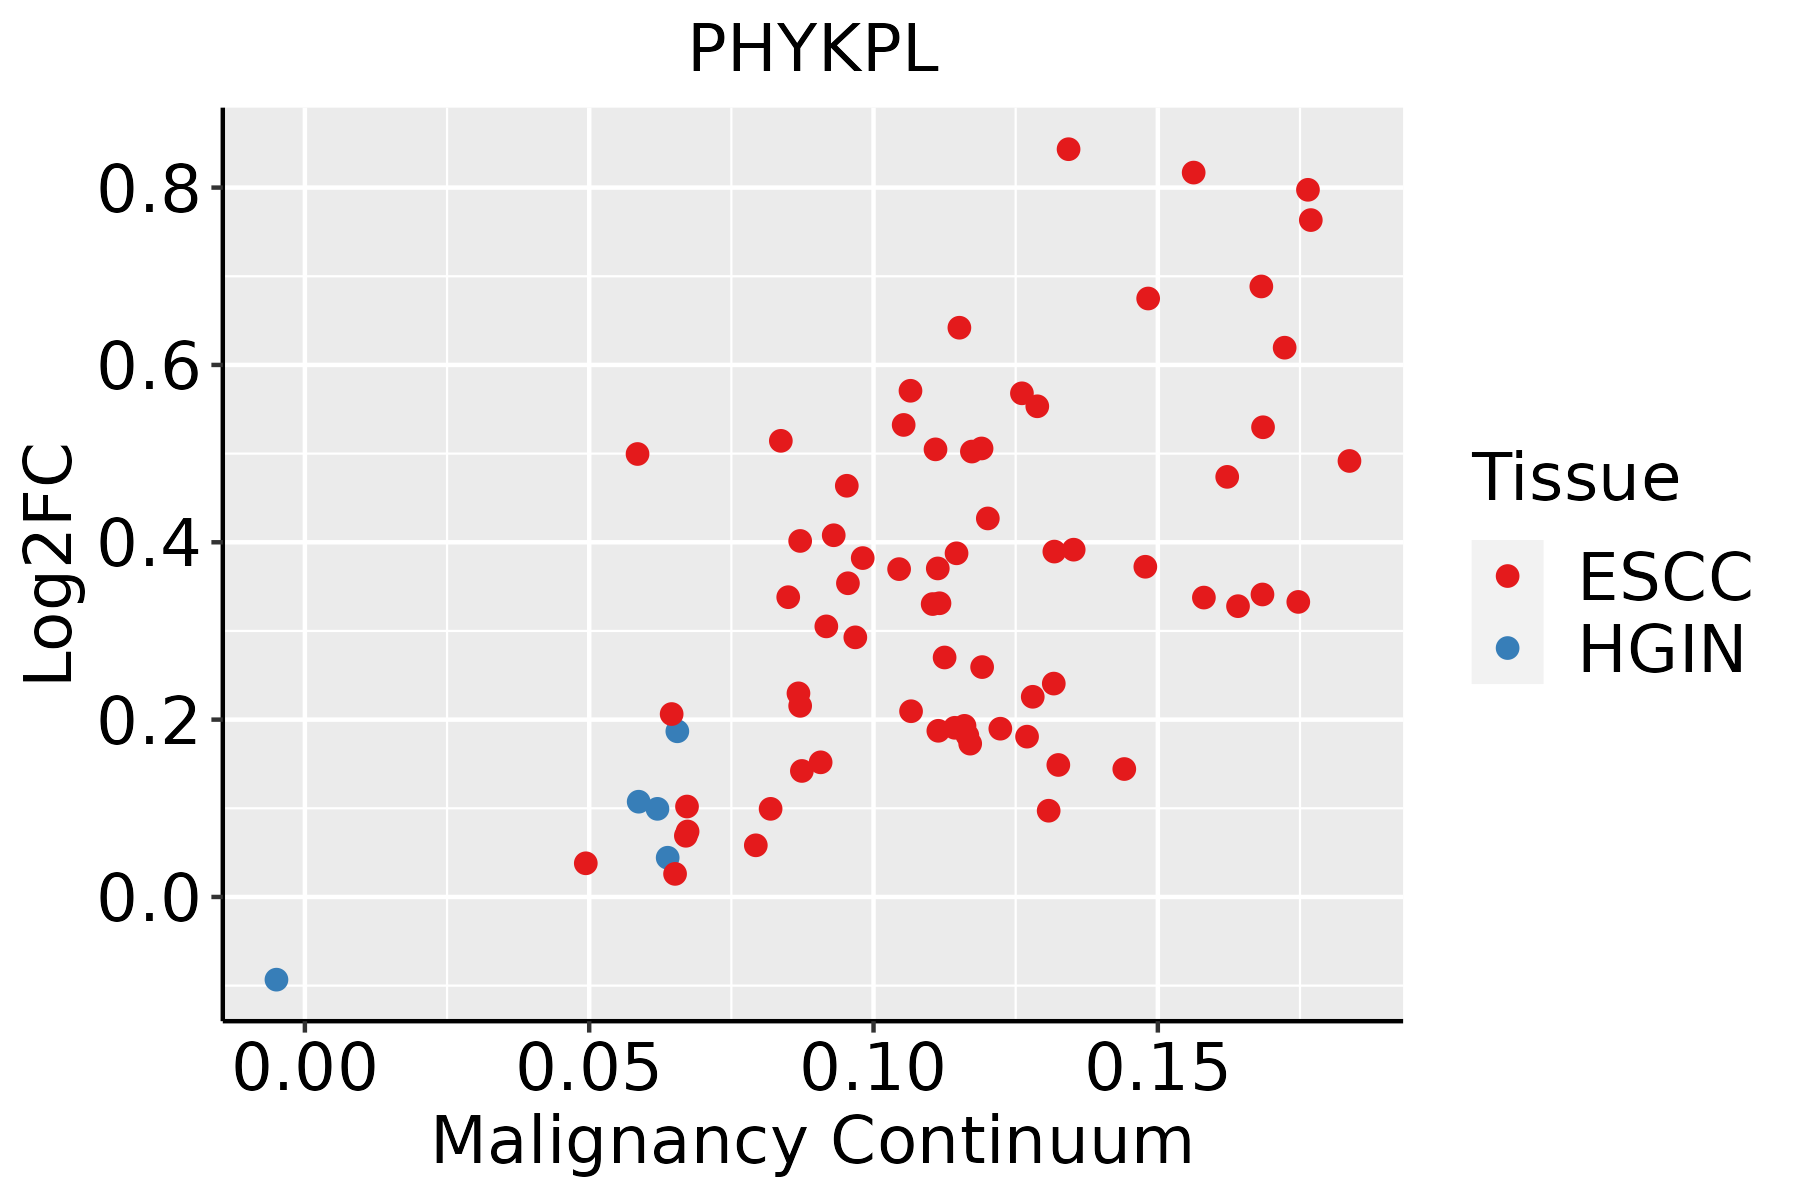 | ESCC: Esophageal squamous cell carcinoma |
| HGIN: High-grade intraepithelial neoplasias | ||
| LGIN: Low-grade intraepithelial neoplasias | ||
| Liver |  | HCC: Hepatocellular carcinoma |
| NAFLD: Non-alcoholic fatty liver disease | ||
| Oral Cavity |  | EOLP: Erosive Oral lichen planus |
| LP: leukoplakia | ||
| NEOLP: Non-erosive oral lichen planus | ||
| OSCC: Oral squamous cell carcinoma | ||
| Thyroid |  | ATC: Anaplastic thyroid cancer |
| HT: Hashimoto's thyroiditis | ||
| PTC: Papillary thyroid cancer |
| ∗log2FC in expression of this searched gene in stem-like cells from each diseased tissue sample relative to stem-like cells in normal samples in each tissue plotted against the malignancy continuum. Samples are colored based on if they are from different disease stage. |
Top |
Malignant transformation related pathway analysis |
| Find out the enriched GO biological processes and KEGG pathways involved in transition from healthy to precancer to cancer |
| Tissue | Disease Stage | Enriched GO biological Processes |
| Colorectum | AD |  |
| Colorectum | SER |  |
| Colorectum | MSS |  |
| Colorectum | MSI-H |  |
| Colorectum | FAP |  |
| ∗Top 15 enriched GO BP terms are showed in the bar plot of each disease state in each tissue. Each row represents a significant GO biological process which is colored according to the -log10(p.adjust). |
| Page: 1 2 3 4 5 6 7 8 9 |
| GO ID | Tissue | Disease Stage | Description | Gene Ratio | Bg Ratio | pvalue | p.adjust | Count |
| Page: 1 |
| Pathway ID | Tissue | Disease Stage | Description | Gene Ratio | Bg Ratio | pvalue | p.adjust | qvalue | Count |
| hsa00310 | Colorectum | AD | Lysine degradation | 27/2092 | 63/8465 | 1.17e-03 | 7.75e-03 | 4.94e-03 | 27 |
| hsa003101 | Colorectum | AD | Lysine degradation | 27/2092 | 63/8465 | 1.17e-03 | 7.75e-03 | 4.94e-03 | 27 |
| hsa003104 | Colorectum | FAP | Lysine degradation | 23/1404 | 63/8465 | 1.04e-04 | 9.46e-04 | 5.76e-04 | 23 |
| hsa003105 | Colorectum | FAP | Lysine degradation | 23/1404 | 63/8465 | 1.04e-04 | 9.46e-04 | 5.76e-04 | 23 |
| hsa003106 | Colorectum | CRC | Lysine degradation | 18/1091 | 63/8465 | 7.21e-04 | 6.34e-03 | 4.30e-03 | 18 |
| hsa003107 | Colorectum | CRC | Lysine degradation | 18/1091 | 63/8465 | 7.21e-04 | 6.34e-03 | 4.30e-03 | 18 |
| hsa0031010 | Esophagus | ESCC | Lysine degradation | 41/4205 | 63/8465 | 9.63e-03 | 2.27e-02 | 1.16e-02 | 41 |
| hsa0031013 | Esophagus | ESCC | Lysine degradation | 41/4205 | 63/8465 | 9.63e-03 | 2.27e-02 | 1.16e-02 | 41 |
| hsa003108 | Liver | NAFLD | Lysine degradation | 21/1043 | 63/8465 | 1.09e-05 | 3.58e-04 | 2.89e-04 | 21 |
| hsa0031011 | Liver | NAFLD | Lysine degradation | 21/1043 | 63/8465 | 1.09e-05 | 3.58e-04 | 2.89e-04 | 21 |
| hsa0031021 | Liver | Cirrhotic | Lysine degradation | 29/2530 | 63/8465 | 4.81e-03 | 1.74e-02 | 1.07e-02 | 29 |
| hsa0031031 | Liver | Cirrhotic | Lysine degradation | 29/2530 | 63/8465 | 4.81e-03 | 1.74e-02 | 1.07e-02 | 29 |
| hsa0031041 | Liver | HCC | Lysine degradation | 47/4020 | 63/8465 | 1.02e-05 | 7.58e-05 | 4.22e-05 | 47 |
| hsa0031051 | Liver | HCC | Lysine degradation | 47/4020 | 63/8465 | 1.02e-05 | 7.58e-05 | 4.22e-05 | 47 |
| Page: 1 |
Top |
Cell-cell communication analysis |
| Identification of potential cell-cell interactions between two cell types and their ligand-receptor pairs for different disease states |
| Ligand | Receptor | LRpair | Pathway | Tissue | Disease Stage |
| Page: 1 |
Top |
Single-cell gene regulatory network inference analysis |
| Find out the significant the regulons (TFs) and the target genes of each regulon across cell types for different disease states |
| TF | Cell Type | Tissue | Disease Stage | Target Gene | RSS | Regulon Activity |
| ∗The dot plots of a searched regulon are shown for all cell subpopulations in each disease state of each tissue based on the regulon specific score inferred using pySCENIC and by calculating the average expression. |
| Page: 1 |
Top |
Somatic mutation of malignant transformation related genes |
| Annotation of somatic variants for genes involved in malignant transformation |
| Hugo Symbol | Variant Class | Variant Classification | dbSNP RS | HGVSc | HGVSp | HGVSp Short | SWISSPROT | BIOTYPE | SIFT | PolyPhen | Tumor Sample Barcode | Tissue | Histology | Sex | Age | Stage | Therapy Types | Drugs | Outcome |
| PHYKPL | SNV | Missense_Mutation | novel | c.308A>C | p.Gln103Pro | p.Q103P | Q8IUZ5 | protein_coding | tolerated(0.48) | benign(0) | TCGA-A8-A06Q-01 | Breast | breast invasive carcinoma | Female | <65 | III/IV | Unknown | Unknown | SD |
| PHYKPL | SNV | Missense_Mutation | c.1043G>T | p.Gly348Val | p.G348V | Q8IUZ5 | protein_coding | tolerated(0.09) | benign(0.009) | TCGA-BH-A18G-01 | Breast | breast invasive carcinoma | Female | >=65 | I/II | Unknown | Unknown | SD | |
| PHYKPL | SNV | Missense_Mutation | novel | c.287N>A | p.Leu96Gln | p.L96Q | Q8IUZ5 | protein_coding | deleterious(0) | probably_damaging(0.995) | TCGA-EW-A3U0-01 | Breast | breast invasive carcinoma | Female | <65 | III/IV | Chemotherapy | cisplatin | CR |
| PHYKPL | SNV | Missense_Mutation | novel | c.1147G>A | p.Glu383Lys | p.E383K | Q8IUZ5 | protein_coding | tolerated(0.38) | benign(0.005) | TCGA-OL-A5DA-01 | Breast | breast invasive carcinoma | Female | <65 | I/II | Unknown | Unknown | SD |
| PHYKPL | SNV | Missense_Mutation | novel | c.739N>A | p.Glu247Lys | p.E247K | Q8IUZ5 | protein_coding | deleterious(0.04) | probably_damaging(0.999) | TCGA-PE-A5DE-01 | Breast | breast invasive carcinoma | Female | <65 | I/II | Chemotherapy | taxotere | CR |
| PHYKPL | SNV | Missense_Mutation | c.1120N>C | p.Asp374His | p.D374H | Q8IUZ5 | protein_coding | deleterious(0) | probably_damaging(0.953) | TCGA-C5-A1BJ-01 | Cervix | cervical & endocervical cancer | Female | <65 | I/II | Unknown | Unknown | SD | |
| PHYKPL | SNV | Missense_Mutation | novel | c.164N>A | p.Ser55Asn | p.S55N | Q8IUZ5 | protein_coding | tolerated(1) | benign(0) | TCGA-MA-AA3W-01 | Cervix | cervical & endocervical cancer | Female | <65 | I/II | Chemotherapy | cisplatin | CR |
| PHYKPL | SNV | Missense_Mutation | rs757976712 | c.466N>T | p.Arg156Cys | p.R156C | Q8IUZ5 | protein_coding | deleterious(0.01) | possibly_damaging(0.846) | TCGA-A6-2686-01 | Colorectum | colon adenocarcinoma | Female | >=65 | I/II | Unknown | Unknown | SD |
| PHYKPL | SNV | Missense_Mutation | rs781248682 | c.536N>A | p.Arg179Gln | p.R179Q | Q8IUZ5 | protein_coding | deleterious(0.03) | benign(0.273) | TCGA-A6-5665-01 | Colorectum | colon adenocarcinoma | Female | >=65 | I/II | Unknown | Unknown | PD |
| PHYKPL | SNV | Missense_Mutation | rs756247782 | c.268N>A | p.Val90Met | p.V90M | Q8IUZ5 | protein_coding | deleterious(0.01) | probably_damaging(0.963) | TCGA-AA-3811-01 | Colorectum | colon adenocarcinoma | Female | >=65 | III/IV | Unknown | Unknown | PD |
| Page: 1 2 3 4 |
Top |
Related drugs of malignant transformation related genes |
| Identification of chemicals and drugs interact with genes involved in malignant transfromation |
| (DGIdb 4.0) |
| Entrez ID | Symbol | Category | Interaction Types | Drug Claim Name | Drug Name | PMIDs |
| Page: 1 |

Copyright 2023-Present -The University of Texas Health Science Center at Houston |