
|
|||||
|
 | |
| |
| |
| |
| |
| |
|
Gene: PHPT1 |
Gene summary for PHPT1 |
| Gene information | Species | Human | Gene symbol | PHPT1 | Gene ID | 29085 |
| Gene name | phosphohistidine phosphatase 1 | |
| Gene Alias | CGI-202 | |
| Cytomap | 9q34.3 | |
| Gene Type | protein-coding | GO ID | GO:0001678 | UniProtAcc | Q9NRX4 |
Top |
Malignant transformation analysis |
| Identification of the aberrant gene expression in precancerous and cancerous lesions by comparing the gene expression of stem-like cells in diseased tissues with normal stem cells |
| Entrez ID | Symbol | Replicates | Species | Organ | Tissue | Adj P-value | Log2FC | Malignancy |
| 29085 | PHPT1 | GSM4909282 | Human | Breast | IDC | 2.25e-06 | -3.88e-01 | -0.0288 |
| 29085 | PHPT1 | GSM4909285 | Human | Breast | IDC | 2.02e-02 | -2.37e-01 | 0.21 |
| 29085 | PHPT1 | GSM4909288 | Human | Breast | IDC | 8.56e-04 | 1.99e-01 | 0.0988 |
| 29085 | PHPT1 | GSM4909291 | Human | Breast | IDC | 3.95e-02 | 2.78e-01 | 0.1753 |
| 29085 | PHPT1 | GSM4909293 | Human | Breast | IDC | 2.60e-15 | 4.59e-01 | 0.1581 |
| 29085 | PHPT1 | GSM4909294 | Human | Breast | IDC | 1.71e-05 | 1.89e-01 | 0.2022 |
| 29085 | PHPT1 | GSM4909295 | Human | Breast | IDC | 1.78e-06 | 3.99e-01 | 0.0898 |
| 29085 | PHPT1 | GSM4909296 | Human | Breast | IDC | 5.28e-16 | 9.73e-02 | 0.1524 |
| 29085 | PHPT1 | GSM4909297 | Human | Breast | IDC | 6.77e-17 | -1.33e-01 | 0.1517 |
| 29085 | PHPT1 | GSM4909301 | Human | Breast | IDC | 1.44e-11 | 4.10e-01 | 0.1577 |
| 29085 | PHPT1 | GSM4909302 | Human | Breast | IDC | 5.28e-04 | 1.75e-01 | 0.1545 |
| 29085 | PHPT1 | GSM4909307 | Human | Breast | IDC | 4.26e-09 | 3.46e-01 | 0.1569 |
| 29085 | PHPT1 | GSM4909308 | Human | Breast | IDC | 1.83e-16 | 4.50e-01 | 0.158 |
| 29085 | PHPT1 | GSM4909309 | Human | Breast | IDC | 1.57e-02 | 5.42e-02 | 0.0483 |
| 29085 | PHPT1 | GSM4909311 | Human | Breast | IDC | 1.85e-42 | -8.28e-02 | 0.1534 |
| 29085 | PHPT1 | GSM4909312 | Human | Breast | IDC | 3.27e-15 | -1.60e-01 | 0.1552 |
| 29085 | PHPT1 | GSM4909315 | Human | Breast | IDC | 4.49e-50 | 7.76e-01 | 0.21 |
| 29085 | PHPT1 | GSM4909316 | Human | Breast | IDC | 1.05e-15 | 5.51e-01 | 0.21 |
| 29085 | PHPT1 | GSM4909319 | Human | Breast | IDC | 3.56e-51 | -2.83e-01 | 0.1563 |
| 29085 | PHPT1 | GSM4909320 | Human | Breast | IDC | 1.32e-05 | 1.41e-02 | 0.1575 |
| Page: 1 2 3 4 5 6 7 8 9 10 11 12 13 14 |
| Tissue | Expression Dynamics | Abbreviation |
| Breast |  | IDC: Invasive ductal carcinoma |
| DCIS: Ductal carcinoma in situ | ||
| Precancer(BRCA1-mut): Precancerous lesion from BRCA1 mutation carriers | ||
| Cervix |  | CC: Cervix cancer |
| HSIL_HPV: HPV-infected high-grade squamous intraepithelial lesions | ||
| N_HPV: HPV-infected normal cervix | ||
| Endometrium | 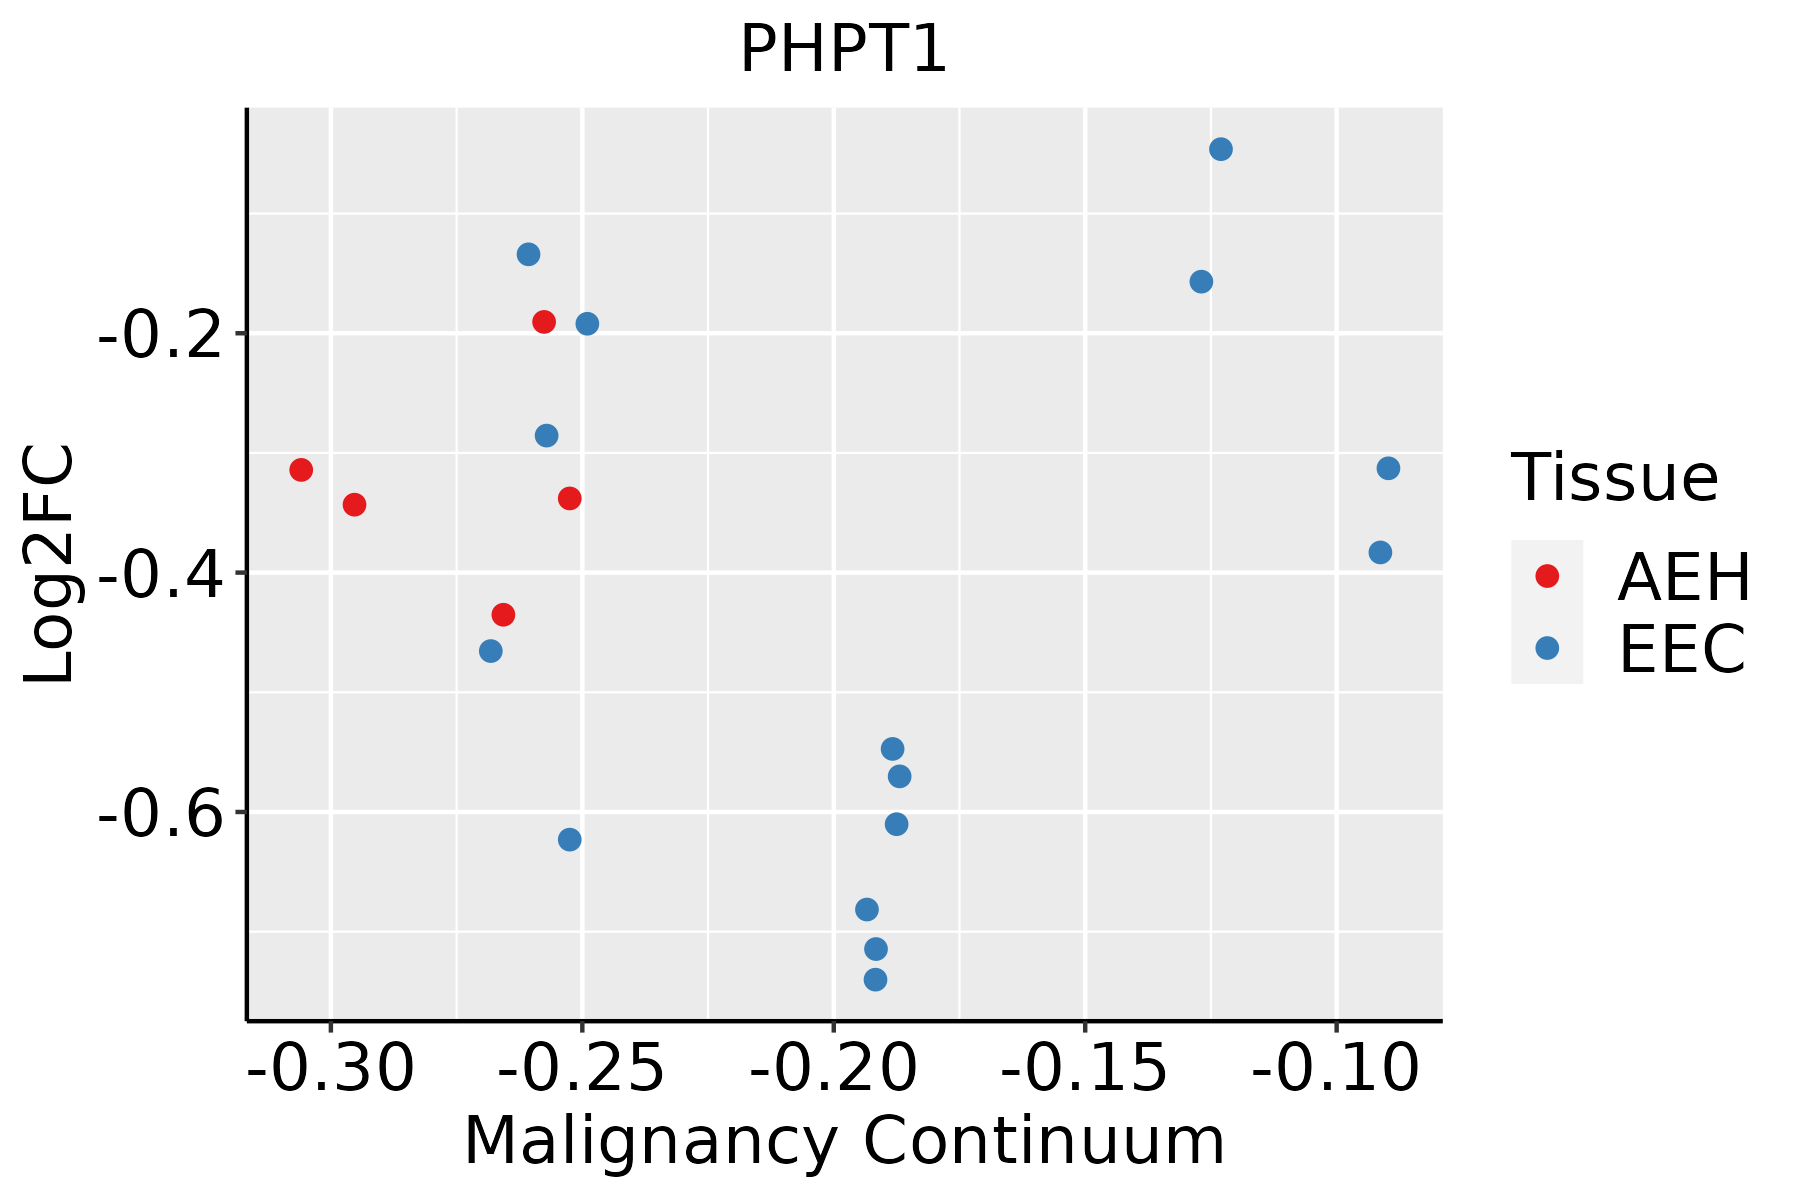 | AEH: Atypical endometrial hyperplasia |
| EEC: Endometrioid Cancer | ||
| Esophagus | 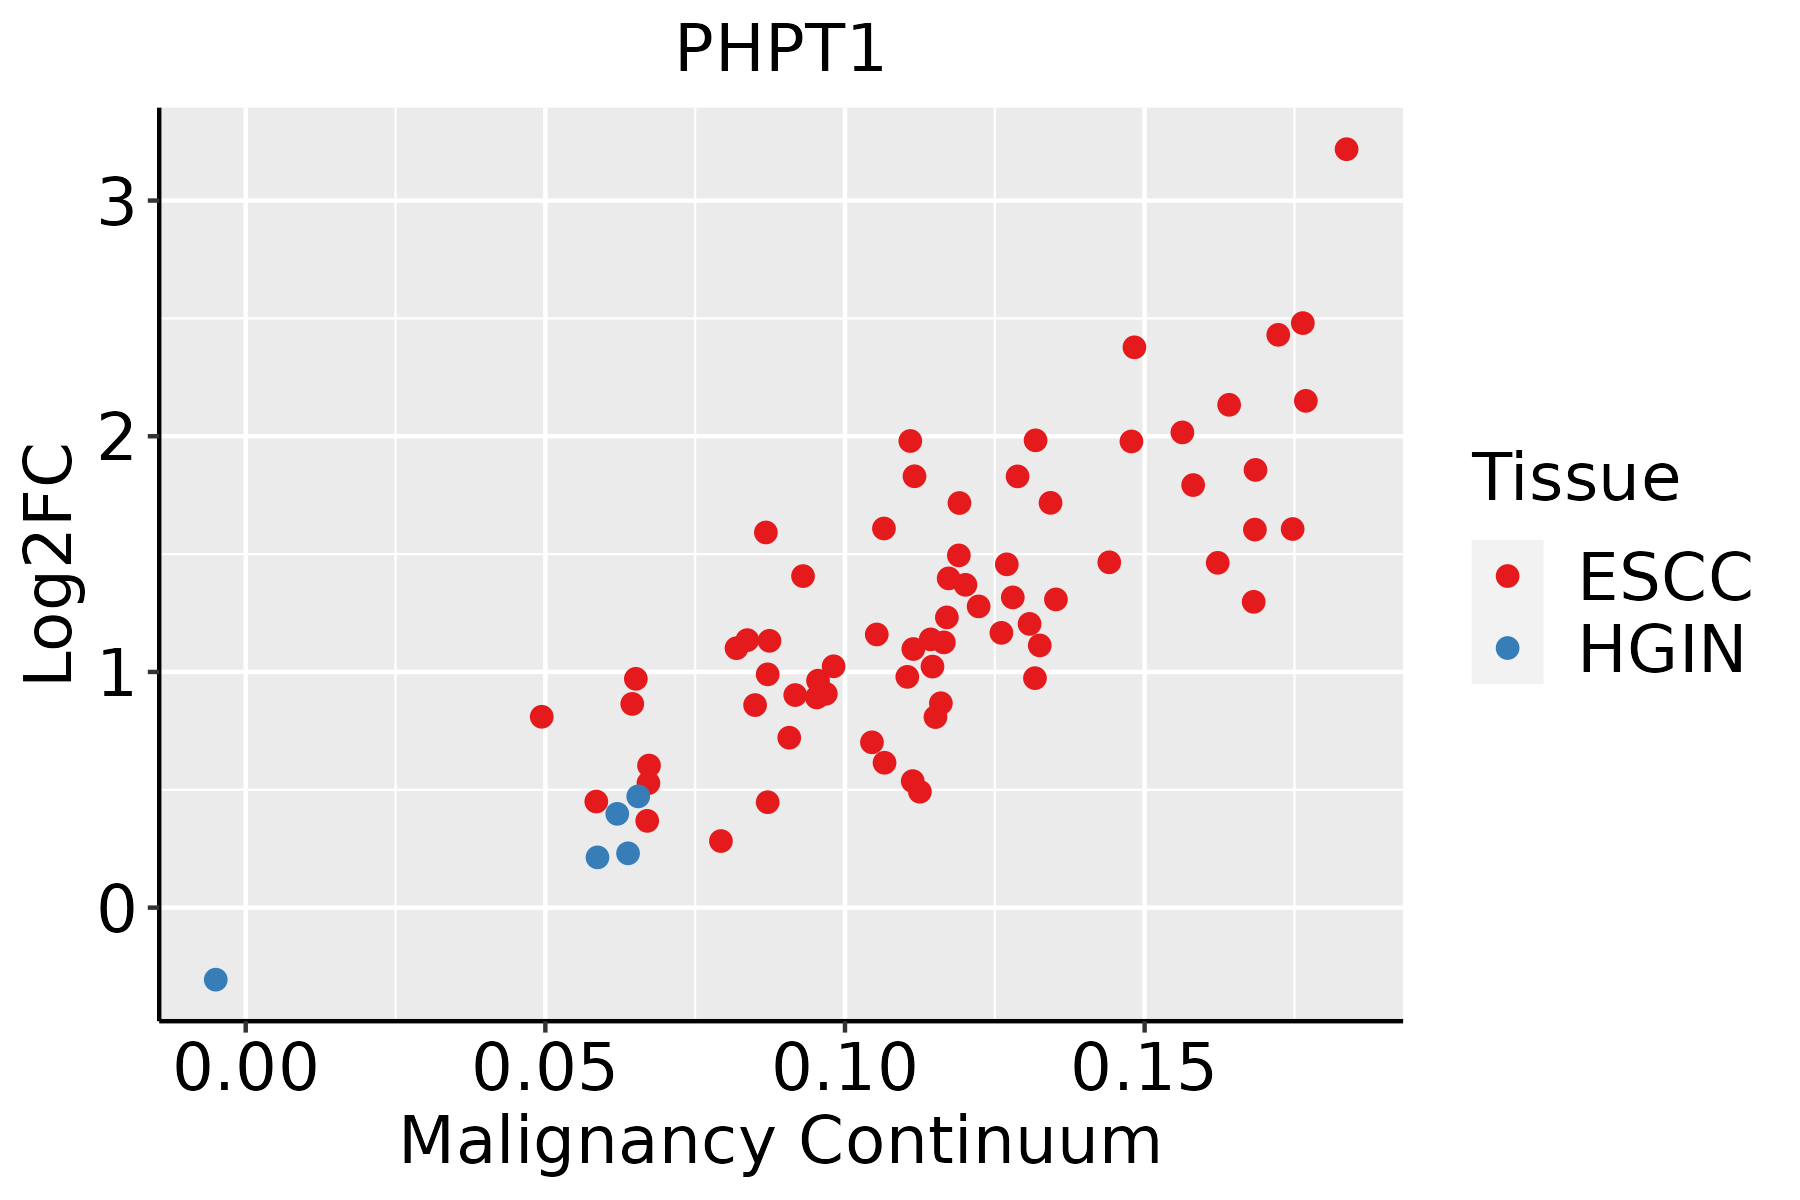 | ESCC: Esophageal squamous cell carcinoma |
| HGIN: High-grade intraepithelial neoplasias | ||
| LGIN: Low-grade intraepithelial neoplasias | ||
| GC |  | CAG: Chronic atrophic gastritis |
| CAG with IM: Chronic atrophic gastritis with intestinal metaplasia | ||
| CSG: Chronic superficial gastritis | ||
| GC: Gastric cancer | ||
| SIM: Severe intestinal metaplasia | ||
| WIM: Wild intestinal metaplasia | ||
| Liver | 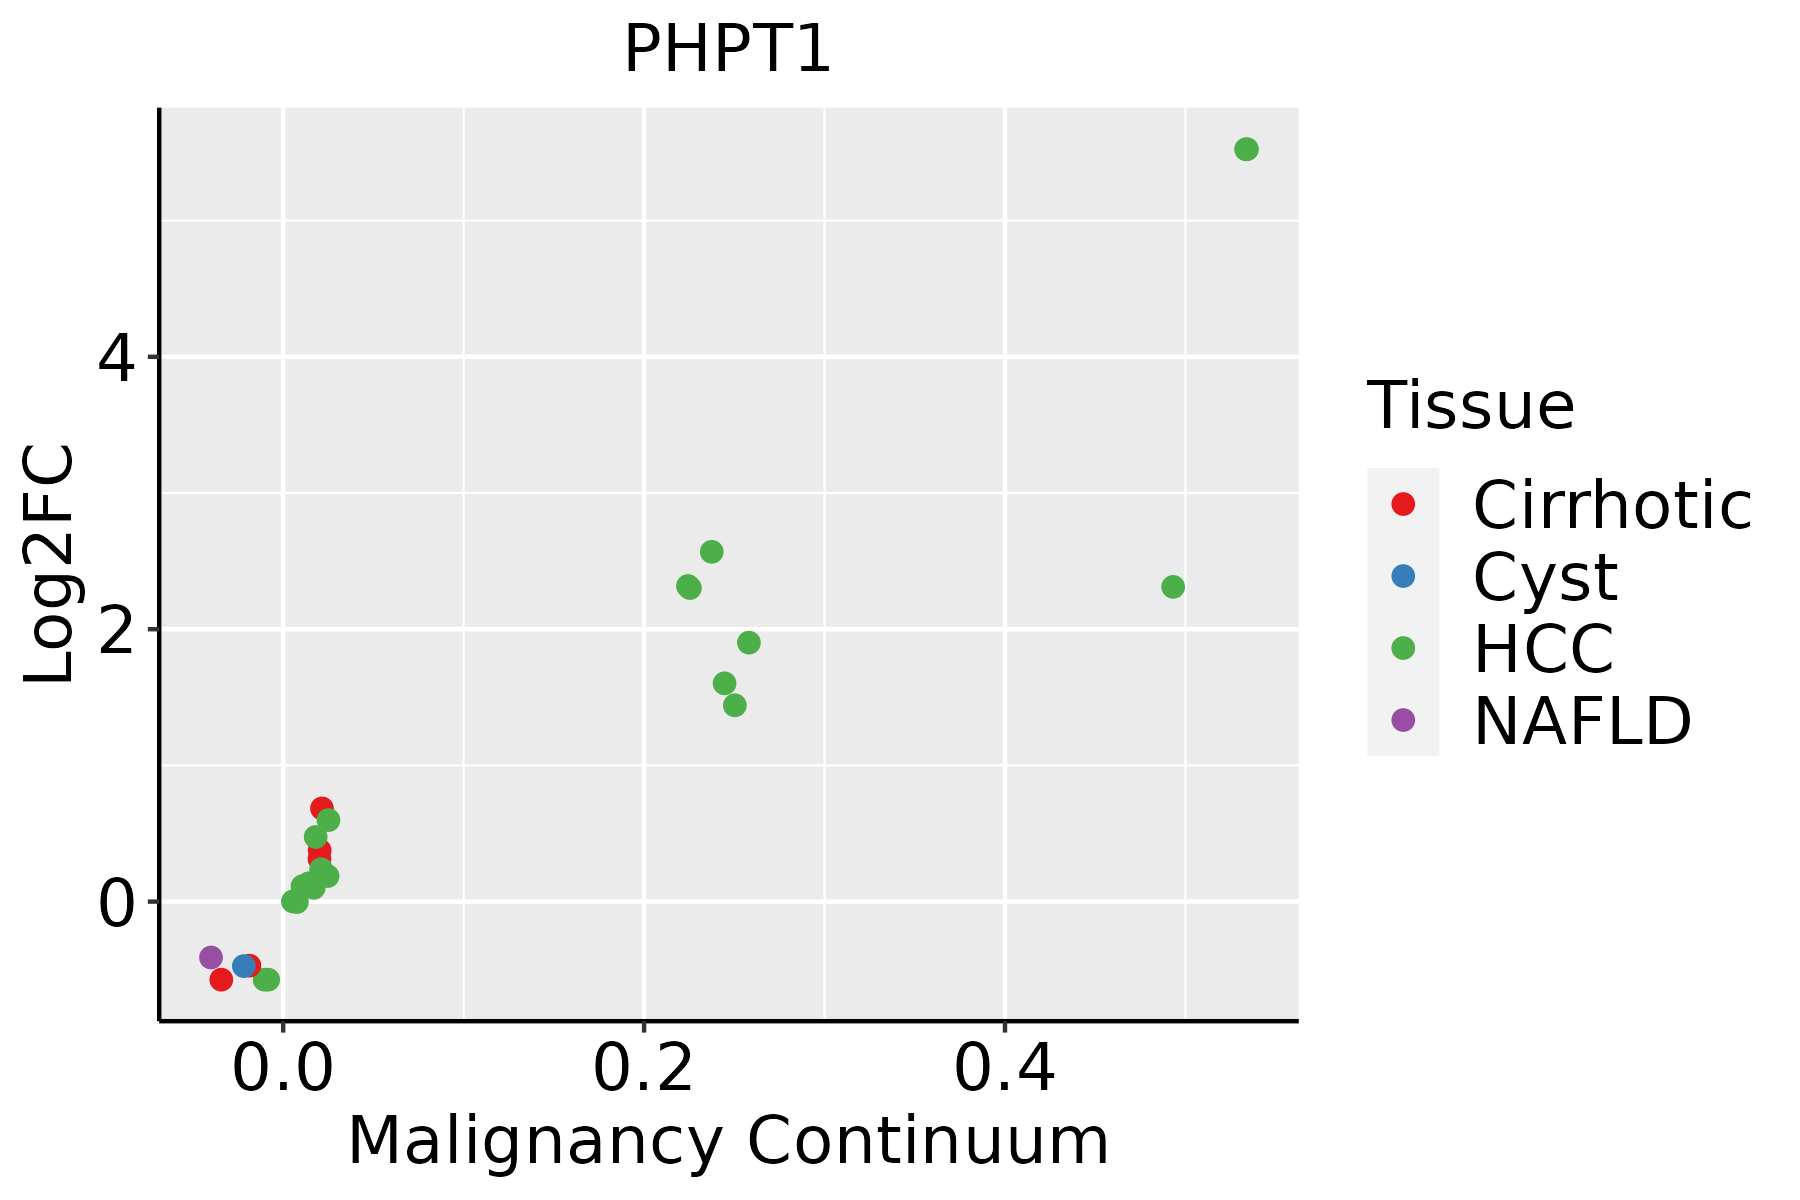 | HCC: Hepatocellular carcinoma |
| NAFLD: Non-alcoholic fatty liver disease | ||
| Lung | 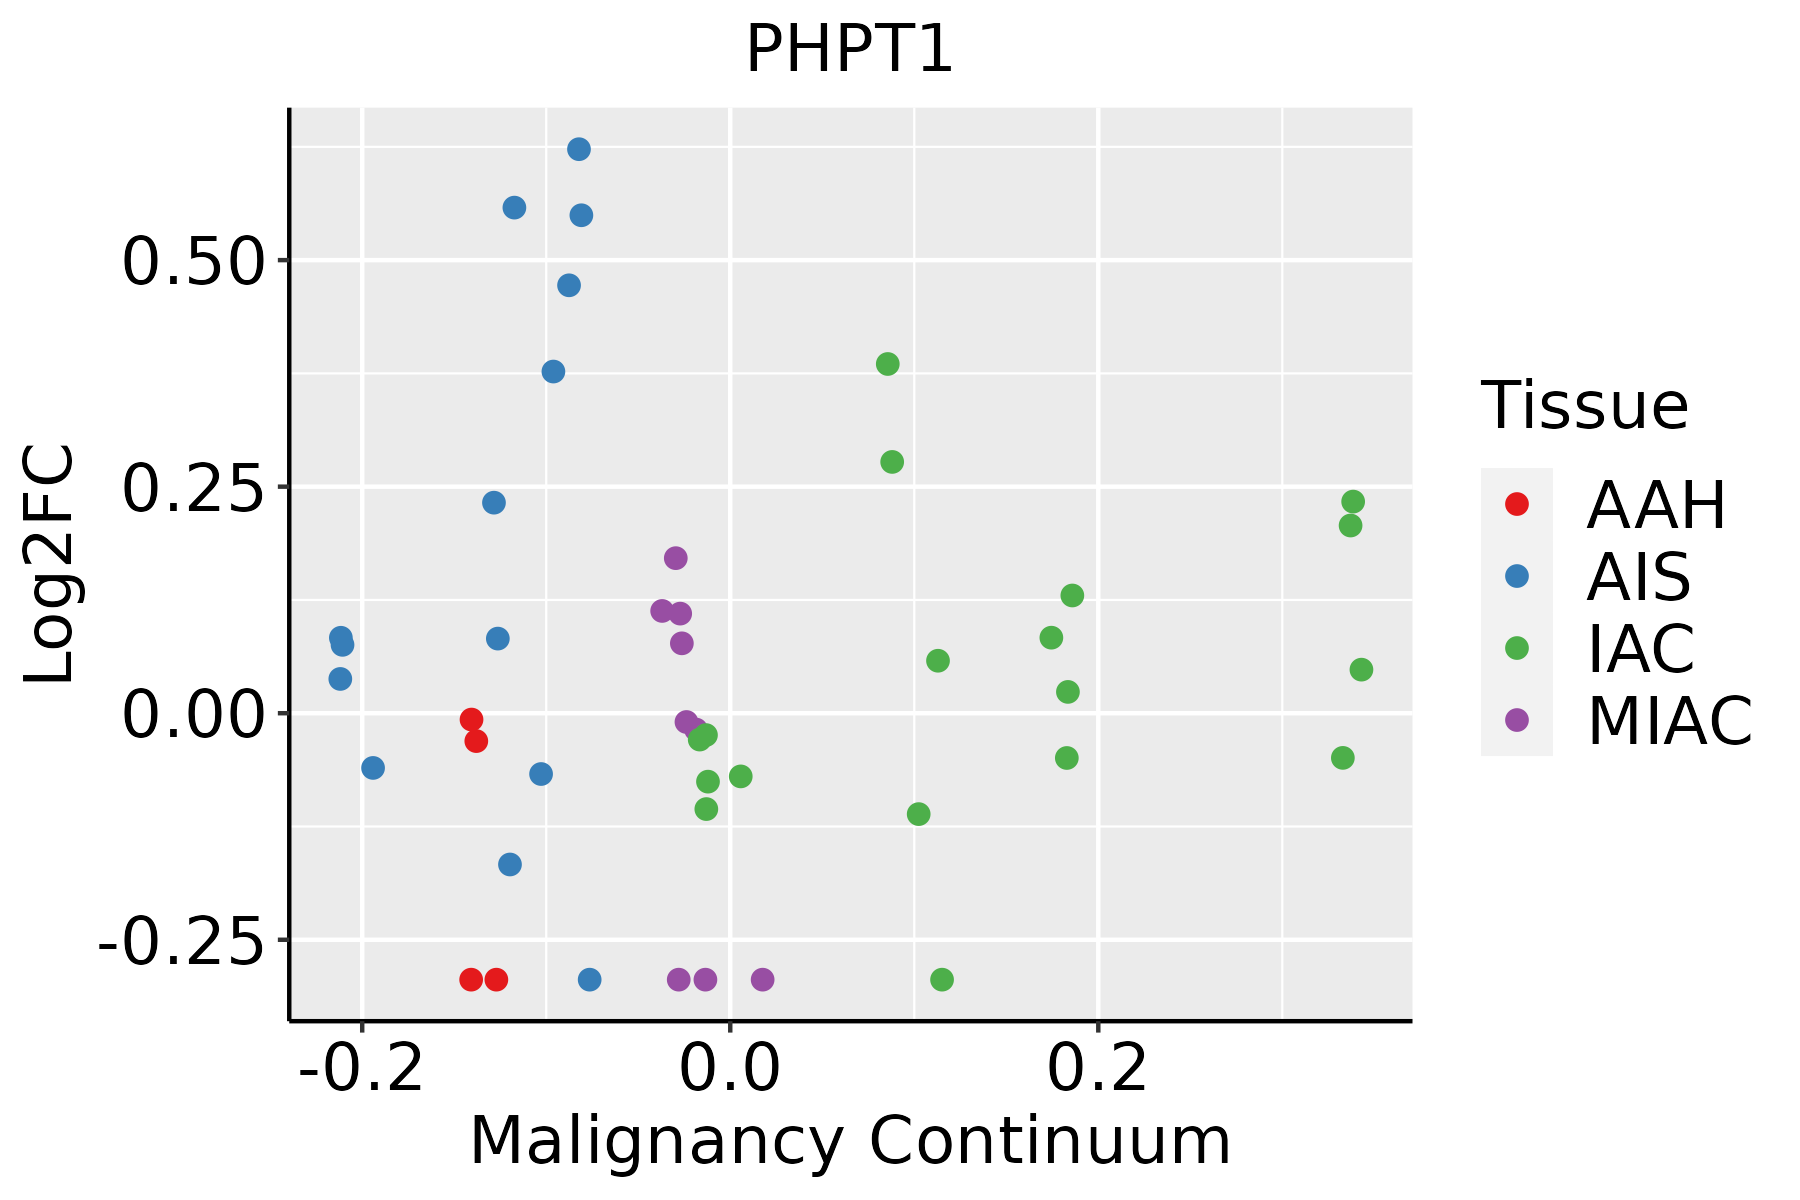 | AAH: Atypical adenomatous hyperplasia |
| AIS: Adenocarcinoma in situ | ||
| IAC: Invasive lung adenocarcinoma | ||
| MIA: Minimally invasive adenocarcinoma | ||
| Oral Cavity | 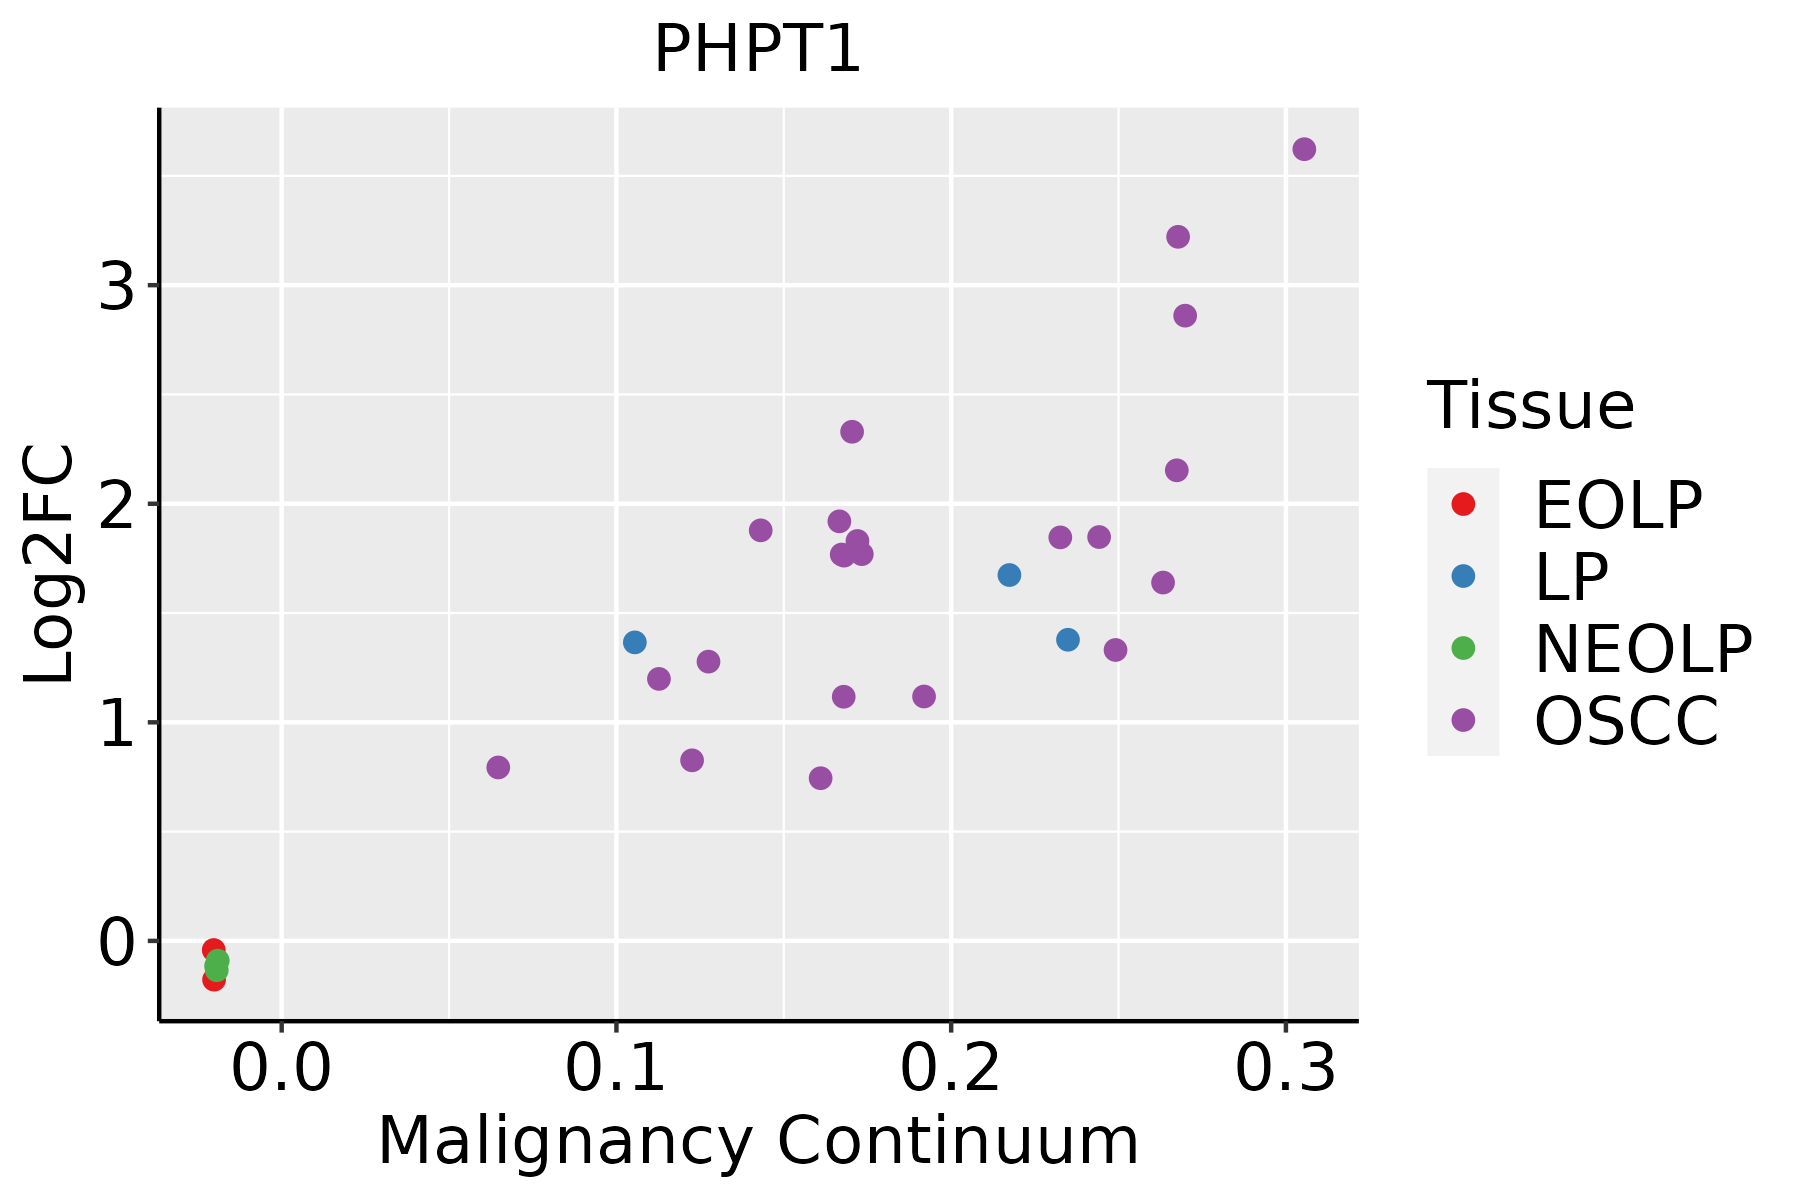 | EOLP: Erosive Oral lichen planus |
| LP: leukoplakia | ||
| NEOLP: Non-erosive oral lichen planus | ||
| OSCC: Oral squamous cell carcinoma | ||
| Prostate | 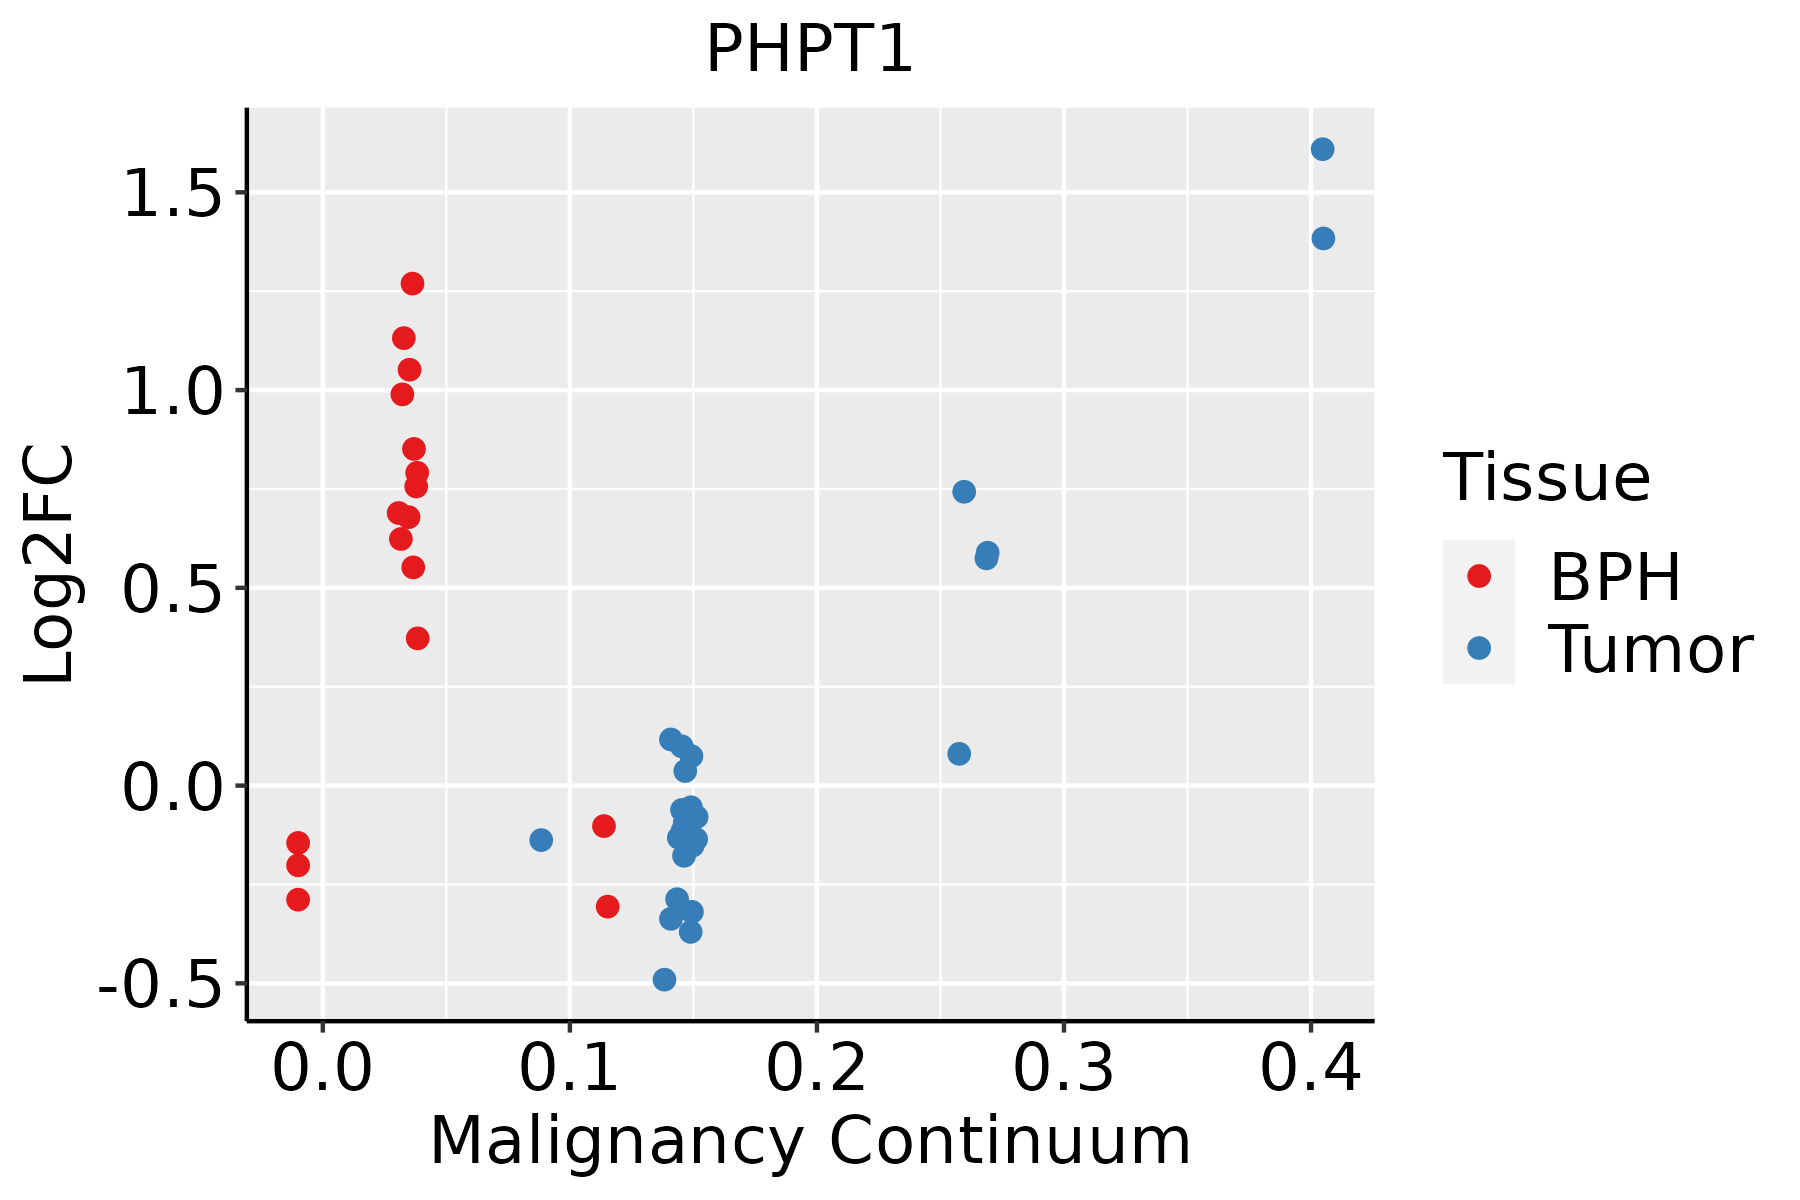 | BPH: Benign Prostatic Hyperplasia |
| Skin |  | AK: Actinic keratosis |
| cSCC: Cutaneous squamous cell carcinoma | ||
| SCCIS:squamous cell carcinoma in situ | ||
| Thyroid | 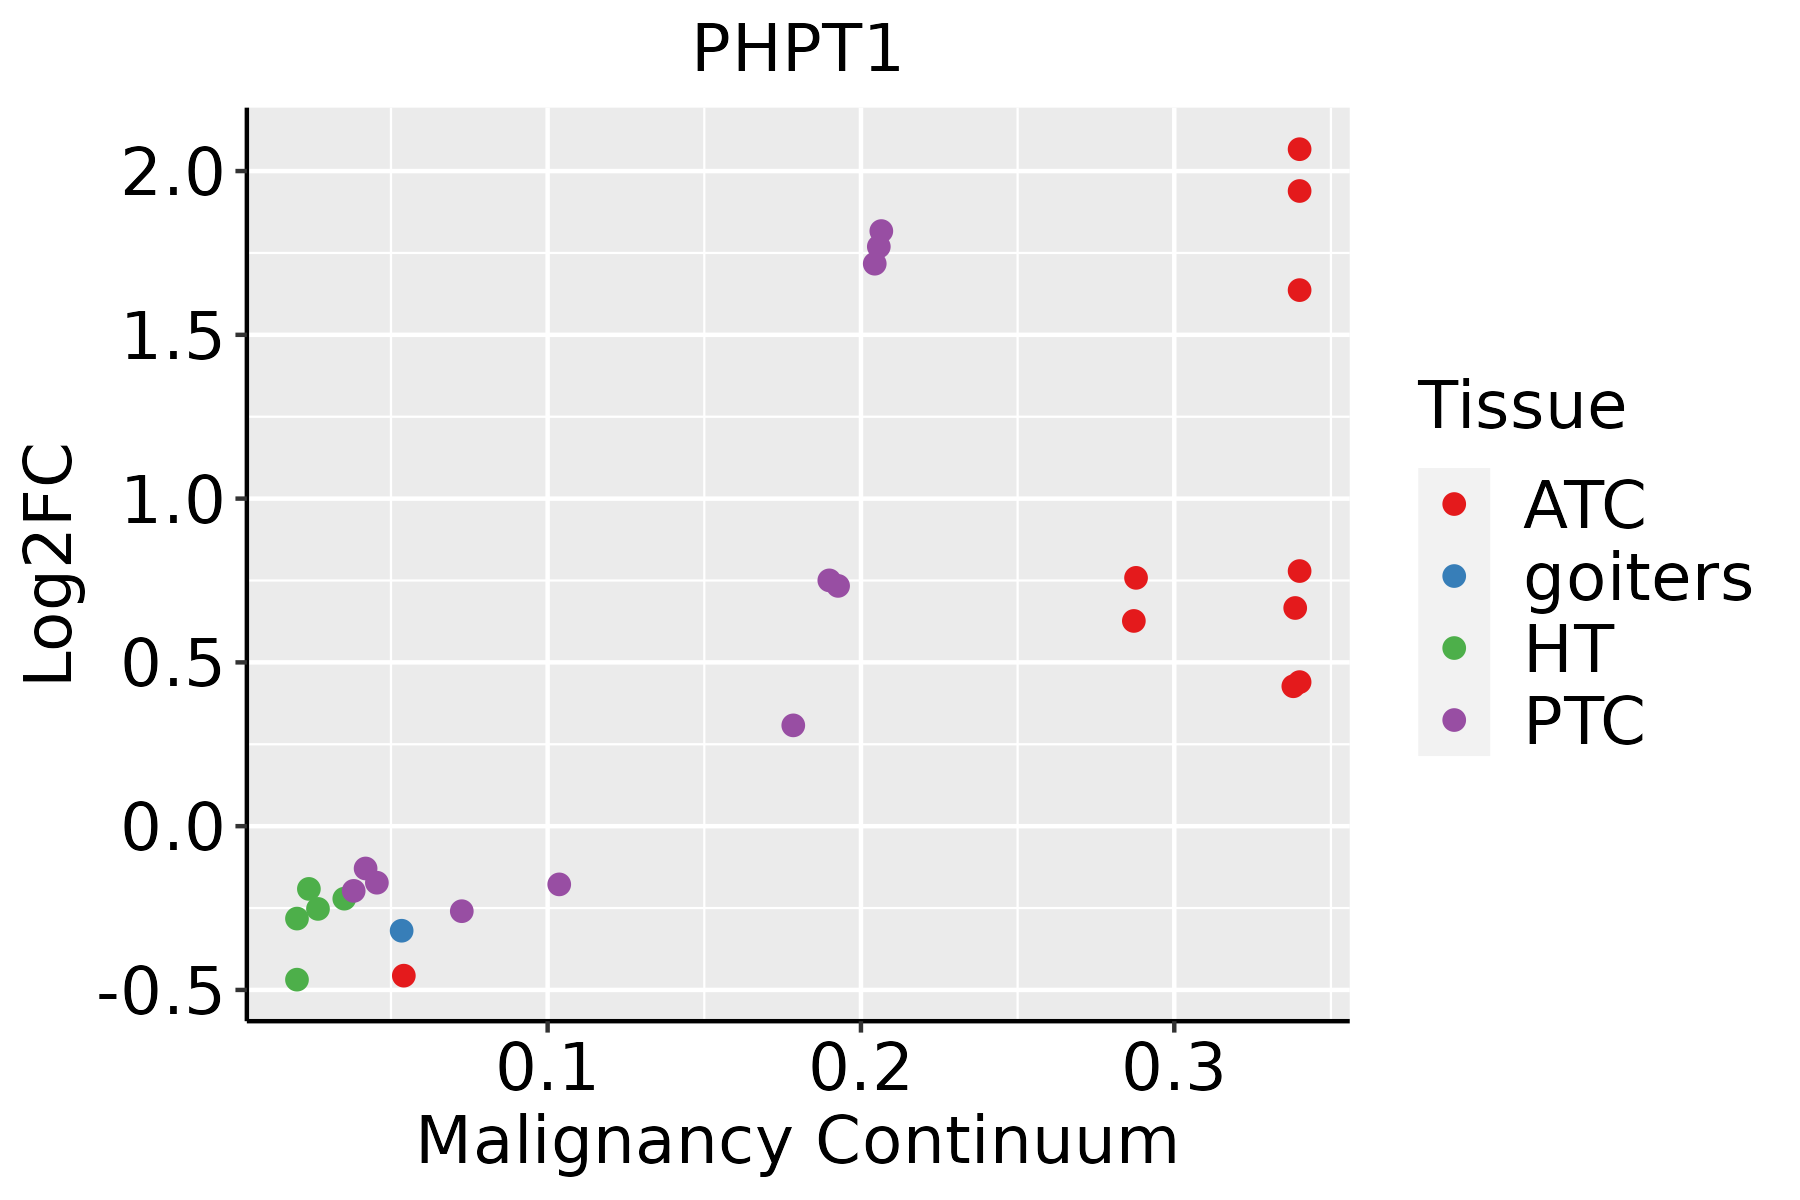 | ATC: Anaplastic thyroid cancer |
| HT: Hashimoto's thyroiditis | ||
| PTC: Papillary thyroid cancer |
| ∗log2FC in expression of this searched gene in stem-like cells from each diseased tissue sample relative to stem-like cells in normal samples in each tissue plotted against the malignancy continuum. Samples are colored based on if they are from different disease stage. |
Top |
Malignant transformation related pathway analysis |
| Find out the enriched GO biological processes and KEGG pathways involved in transition from healthy to precancer to cancer |
| Tissue | Disease Stage | Enriched GO biological Processes |
| Colorectum | AD |  |
| Colorectum | SER |  |
| Colorectum | MSS |  |
| Colorectum | MSI-H |  |
| Colorectum | FAP |  |
| ∗Top 15 enriched GO BP terms are showed in the bar plot of each disease state in each tissue. Each row represents a significant GO biological process which is colored according to the -log10(p.adjust). |
| Page: 1 2 3 4 5 6 7 8 9 |
| GO ID | Tissue | Disease Stage | Description | Gene Ratio | Bg Ratio | pvalue | p.adjust | Count |
| GO:00342849 | Breast | Precancer | response to monosaccharide | 29/1080 | 225/18723 | 4.19e-05 | 9.00e-04 | 29 |
| GO:00097439 | Breast | Precancer | response to carbohydrate | 31/1080 | 253/18723 | 6.15e-05 | 1.25e-03 | 31 |
| GO:00425938 | Breast | Precancer | glucose homeostasis | 31/1080 | 258/18723 | 8.89e-05 | 1.69e-03 | 31 |
| GO:19049519 | Breast | Precancer | positive regulation of establishment of protein localization | 36/1080 | 319/18723 | 9.30e-05 | 1.75e-03 | 36 |
| GO:00335008 | Breast | Precancer | carbohydrate homeostasis | 31/1080 | 259/18723 | 9.56e-05 | 1.79e-03 | 31 |
| GO:00329709 | Breast | Precancer | regulation of actin filament-based process | 42/1080 | 397/18723 | 1.11e-04 | 2.01e-03 | 42 |
| GO:00097469 | Breast | Precancer | response to hexose | 27/1080 | 219/18723 | 1.61e-04 | 2.69e-03 | 27 |
| GO:00097498 | Breast | Precancer | response to glucose | 25/1080 | 212/18723 | 5.46e-04 | 7.00e-03 | 25 |
| GO:00329569 | Breast | Precancer | regulation of actin cytoskeleton organization | 36/1080 | 358/18723 | 8.56e-04 | 9.88e-03 | 36 |
| GO:00016787 | Breast | Precancer | cellular glucose homeostasis | 21/1080 | 172/18723 | 9.38e-04 | 1.06e-02 | 21 |
| GO:00713337 | Breast | Precancer | cellular response to glucose stimulus | 19/1080 | 151/18723 | 1.12e-03 | 1.23e-02 | 19 |
| GO:00713228 | Breast | Precancer | cellular response to carbohydrate stimulus | 20/1080 | 163/18723 | 1.15e-03 | 1.26e-02 | 20 |
| GO:00713317 | Breast | Precancer | cellular response to hexose stimulus | 19/1080 | 153/18723 | 1.31e-03 | 1.39e-02 | 19 |
| GO:00026836 | Breast | Precancer | negative regulation of immune system process | 41/1080 | 434/18723 | 1.33e-03 | 1.40e-02 | 41 |
| GO:00713267 | Breast | Precancer | cellular response to monosaccharide stimulus | 19/1080 | 154/18723 | 1.42e-03 | 1.48e-02 | 19 |
| GO:00512229 | Breast | Precancer | positive regulation of protein transport | 31/1080 | 303/18723 | 1.44e-03 | 1.50e-02 | 31 |
| GO:00507086 | Breast | Precancer | regulation of protein secretion | 28/1080 | 268/18723 | 1.76e-03 | 1.74e-02 | 28 |
| GO:00158336 | Breast | Precancer | peptide transport | 27/1080 | 264/18723 | 2.84e-03 | 2.49e-02 | 27 |
| GO:00900875 | Breast | Precancer | regulation of peptide transport | 22/1080 | 202/18723 | 3.14e-03 | 2.65e-02 | 22 |
| GO:00513489 | Breast | Precancer | negative regulation of transferase activity | 27/1080 | 268/18723 | 3.49e-03 | 2.90e-02 | 27 |
| Page: 1 2 3 4 5 6 7 8 9 10 11 12 13 14 15 16 17 18 19 20 21 22 23 24 25 26 27 28 29 30 31 32 33 34 |
| Pathway ID | Tissue | Disease Stage | Description | Gene Ratio | Bg Ratio | pvalue | p.adjust | qvalue | Count |
| Page: 1 |
Top |
Cell-cell communication analysis |
| Identification of potential cell-cell interactions between two cell types and their ligand-receptor pairs for different disease states |
| Ligand | Receptor | LRpair | Pathway | Tissue | Disease Stage |
| Page: 1 |
Top |
Single-cell gene regulatory network inference analysis |
| Find out the significant the regulons (TFs) and the target genes of each regulon across cell types for different disease states |
| TF | Cell Type | Tissue | Disease Stage | Target Gene | RSS | Regulon Activity |
| ∗The dot plots of a searched regulon are shown for all cell subpopulations in each disease state of each tissue based on the regulon specific score inferred using pySCENIC and by calculating the average expression. |
| Page: 1 |
Top |
Somatic mutation of malignant transformation related genes |
| Annotation of somatic variants for genes involved in malignant transformation |
| Hugo Symbol | Variant Class | Variant Classification | dbSNP RS | HGVSc | HGVSp | HGVSp Short | SWISSPROT | BIOTYPE | SIFT | PolyPhen | Tumor Sample Barcode | Tissue | Histology | Sex | Age | Stage | Therapy Types | Drugs | Outcome |
| PHPT1 | SNV | Missense_Mutation | novel | c.192N>A | p.Met64Ile | p.M64I | Q9NRX4 | protein_coding | tolerated(0.48) | benign(0) | TCGA-2W-A8YY-01 | Cervix | cervical & endocervical cancer | Female | <65 | I/II | Chemotherapy | cisplatin | CR |
| PHPT1 | SNV | Missense_Mutation | novel | c.203N>A | p.Gly68Asp | p.G68D | Q9NRX4 | protein_coding | deleterious(0.03) | probably_damaging(0.999) | TCGA-EA-A410-01 | Cervix | cervical & endocervical cancer | Female | <65 | I/II | Unknown | Unknown | SD |
| PHPT1 | SNV | Missense_Mutation | novel | c.98C>G | p.Ser33Cys | p.S33C | Q9NRX4 | protein_coding | deleterious(0.03) | possibly_damaging(0.45) | TCGA-VS-A9UH-01 | Cervix | cervical & endocervical cancer | Female | <65 | I/II | Chemotherapy | cisplatin | CR |
| PHPT1 | SNV | Missense_Mutation | c.308N>T | p.Ala103Val | p.A103V | Q9NRX4 | protein_coding | deleterious(0.02) | benign(0.222) | TCGA-B5-A11E-01 | Endometrium | uterine corpus endometrioid carcinoma | Female | <65 | I/II | Unknown | Unknown | SD | |
| PHPT1 | SNV | Missense_Mutation | novel | c.317N>T | p.Thr106Ile | p.T106I | Q9NRX4 | protein_coding | tolerated(0.15) | probably_damaging(0.97) | TCGA-DF-A2KN-01 | Endometrium | uterine corpus endometrioid carcinoma | Female | Unknown | I/II | Unknown | Unknown | SD |
| PHPT1 | SNV | Missense_Mutation | rs764705291 | c.367G>A | p.Asp123Asn | p.D123N | Q9NRX4 | protein_coding | deleterious(0.01) | benign(0.104) | TCGA-EO-A22R-01 | Endometrium | uterine corpus endometrioid carcinoma | Female | <65 | I/II | Unknown | Unknown | SD |
| PHPT1 | SNV | Missense_Mutation | rs751950321 | c.203G>T | p.Gly68Val | p.G68V | Q9NRX4 | protein_coding | deleterious(0.02) | probably_damaging(0.968) | TCGA-DD-AADJ-01 | Liver | liver hepatocellular carcinoma | Female | >=65 | I/II | Unknown | Unknown | SD |
| PHPT1 | SNV | Missense_Mutation | novel | c.347N>T | p.Tyr116Phe | p.Y116F | Q9NRX4 | protein_coding | deleterious(0) | probably_damaging(0.995) | TCGA-05-4427-01 | Lung | lung adenocarcinoma | Female | >=65 | I/II | Chemotherapy | cisplatin | CR |
| PHPT1 | SNV | Missense_Mutation | c.218N>T | p.Cys73Phe | p.C73F | Q9NRX4 | protein_coding | deleterious(0) | probably_damaging(1) | TCGA-L9-A7SV-01 | Lung | lung adenocarcinoma | Male | >=65 | I/II | Chemotherapy | cisplatin | CR | |
| PHPT1 | SNV | Missense_Mutation | novel | c.147G>T | p.Trp49Cys | p.W49C | Q9NRX4 | protein_coding | tolerated(0.07) | probably_damaging(0.999) | TCGA-56-8308-01 | Lung | lung squamous cell carcinoma | Male | >=65 | I/II | Chemotherapy | paclitaxel | SD |
| Page: 1 2 |
Top |
Related drugs of malignant transformation related genes |
| Identification of chemicals and drugs interact with genes involved in malignant transfromation |
| (DGIdb 4.0) |
| Entrez ID | Symbol | Category | Interaction Types | Drug Claim Name | Drug Name | PMIDs |
| Page: 1 |

Copyright 2023-Present -The University of Texas Health Science Center at Houston |