| Tissue | Expression Dynamics | Abbreviation |
| Cervix |  | CC: Cervix cancer |
| HSIL_HPV: HPV-infected high-grade squamous intraepithelial lesions |
| N_HPV: HPV-infected normal cervix |
| Colorectum (GSE201348) |  | FAP: Familial adenomatous polyposis |
| CRC: Colorectal cancer |
| Colorectum (HTA11) |  | AD: Adenomas |
| SER: Sessile serrated lesions |
| MSI-H: Microsatellite-high colorectal cancer |
| MSS: Microsatellite stable colorectal cancer |
| Endometrium | 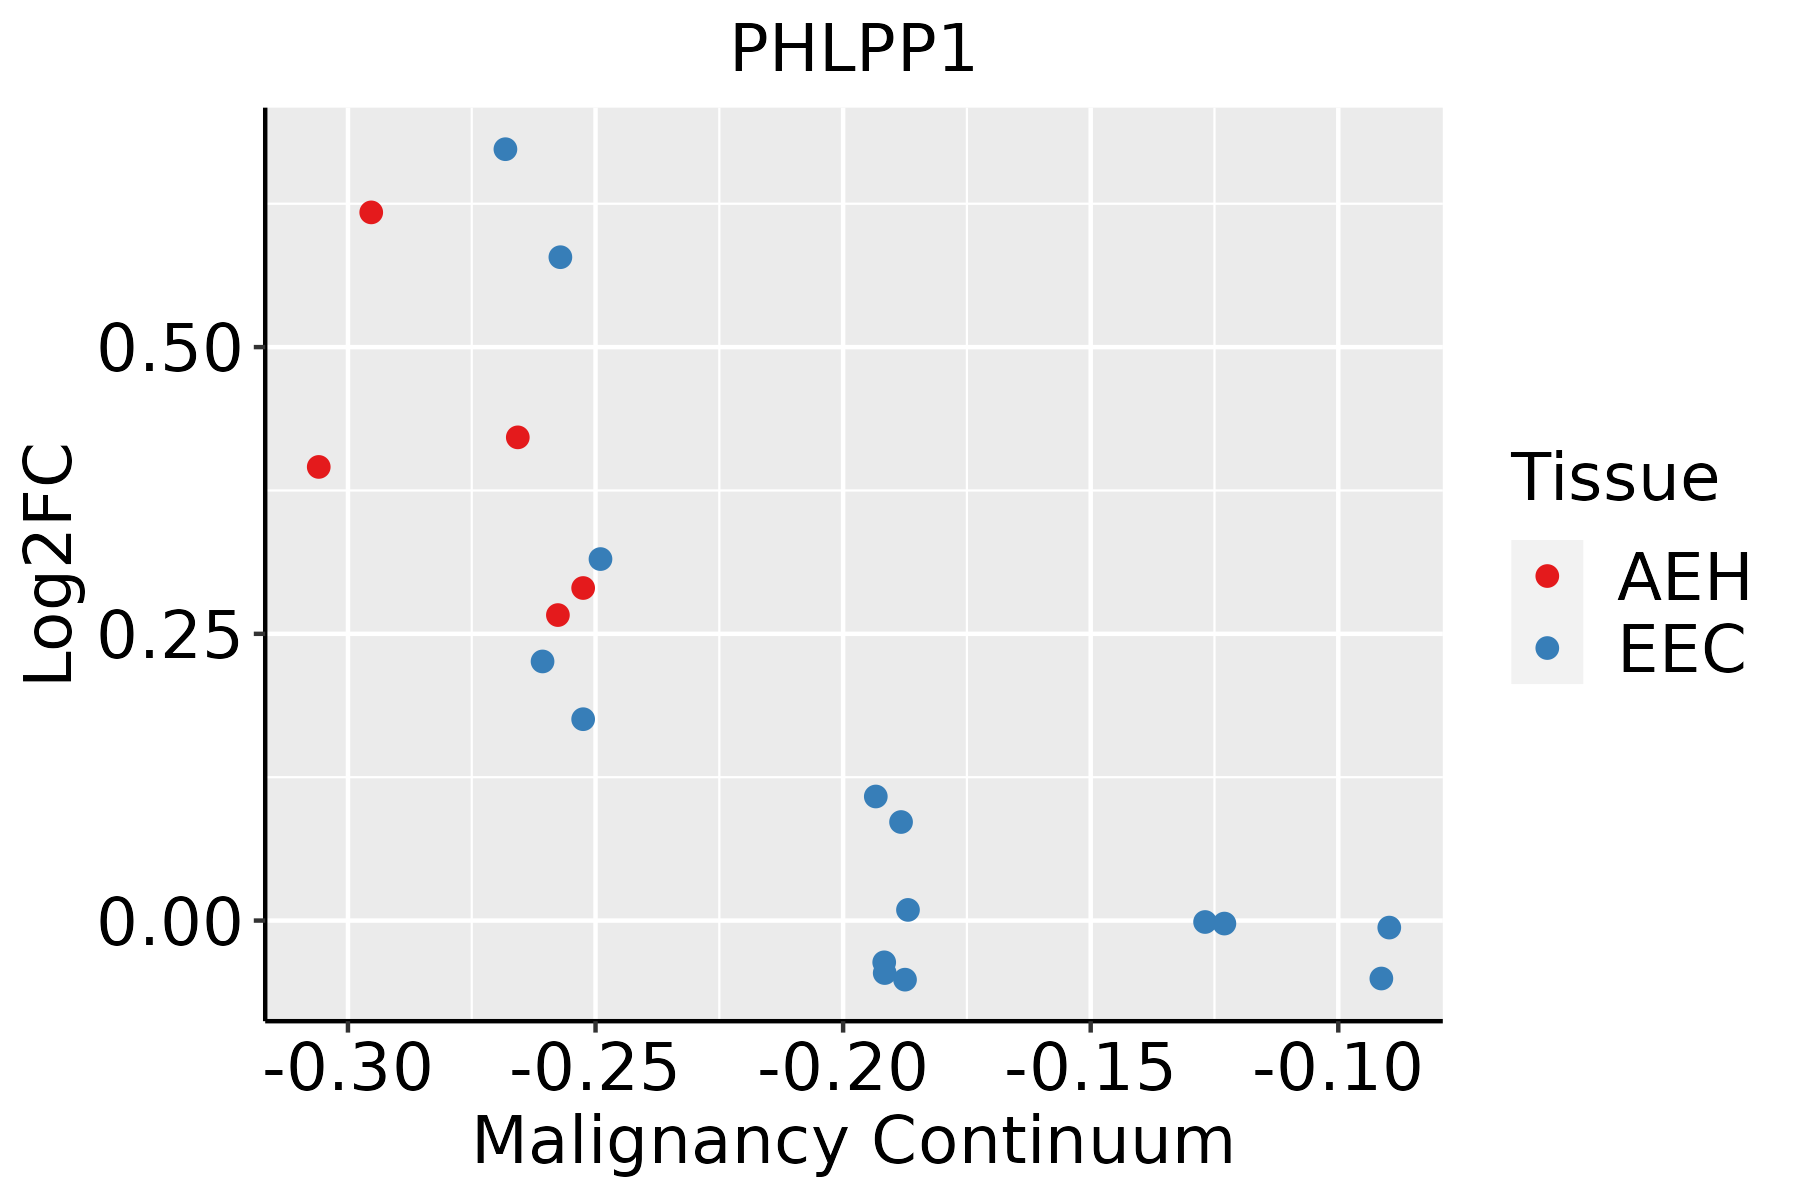 | AEH: Atypical endometrial hyperplasia |
| EEC: Endometrioid Cancer |
| Liver | 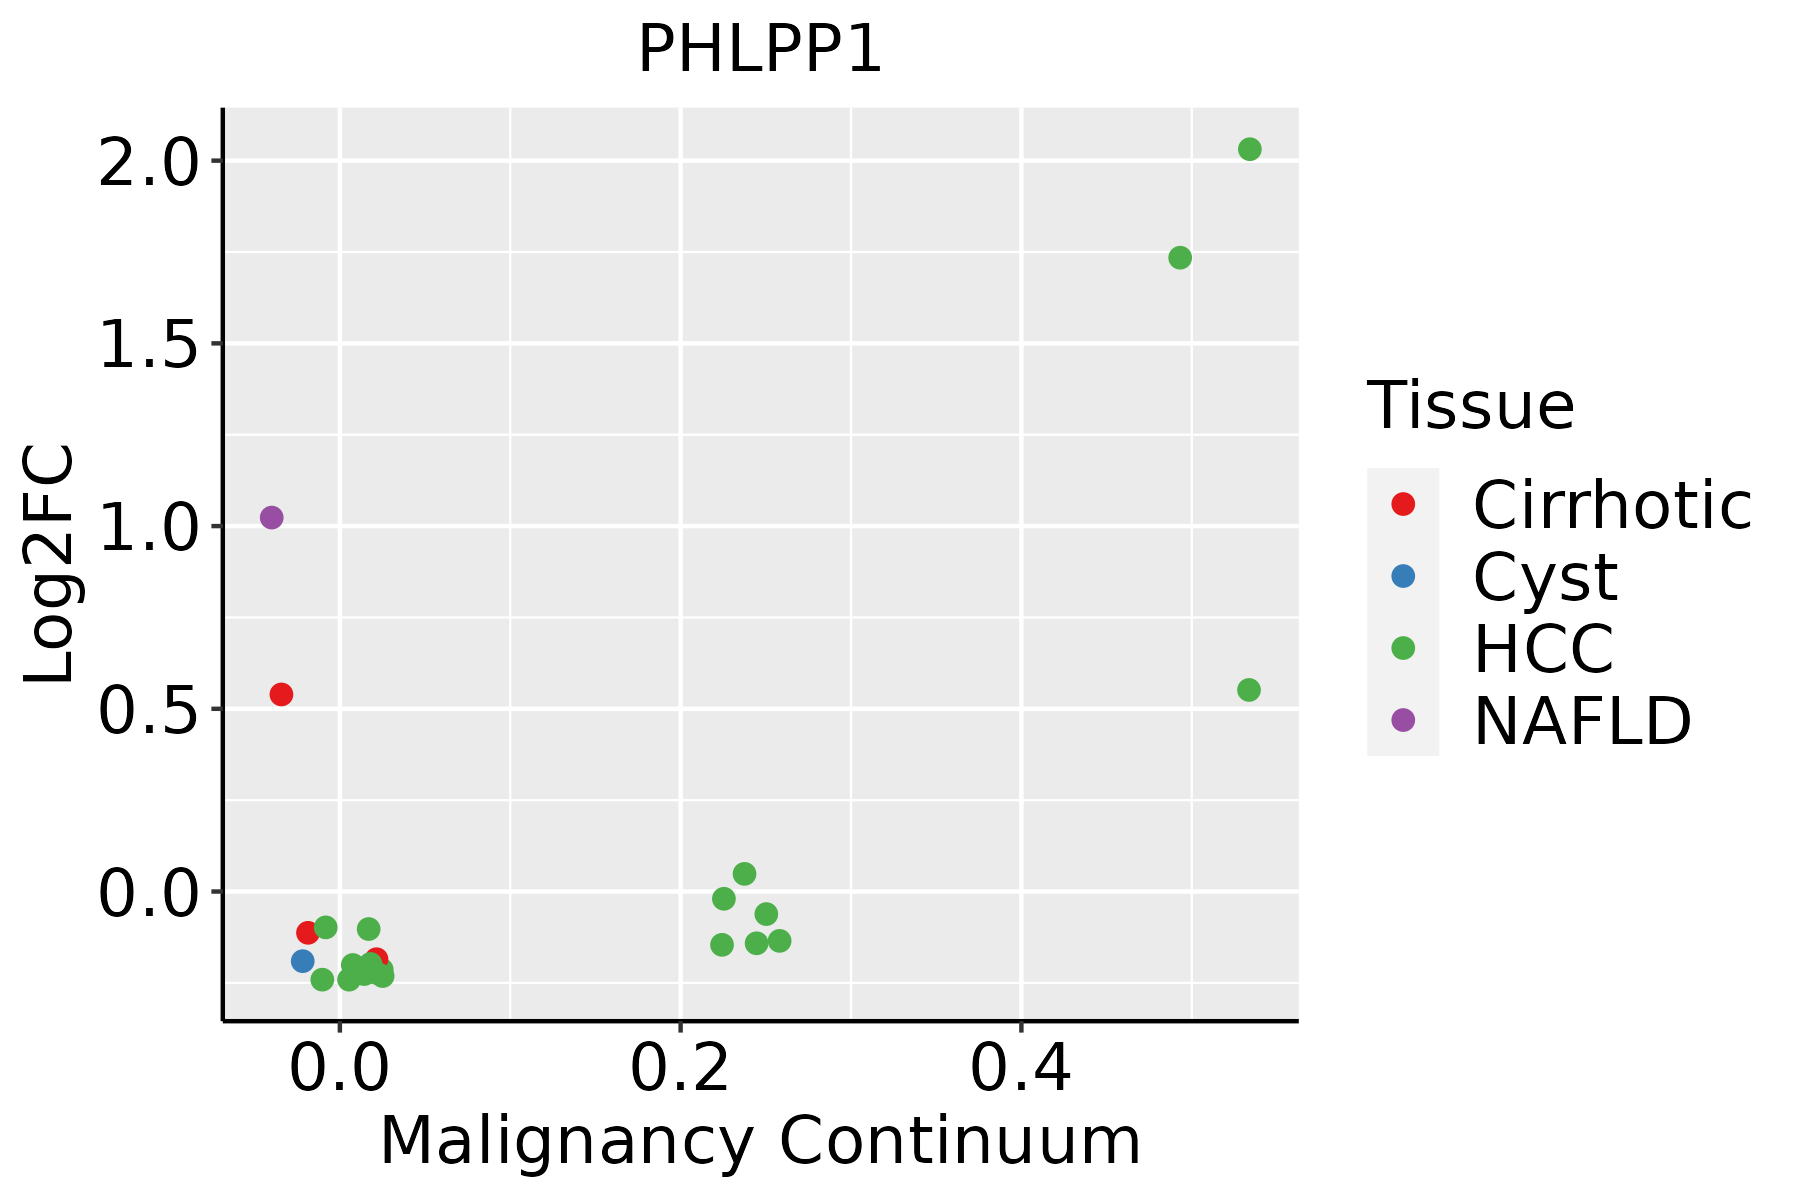 | HCC: Hepatocellular carcinoma |
| NAFLD: Non-alcoholic fatty liver disease |
| Lung | 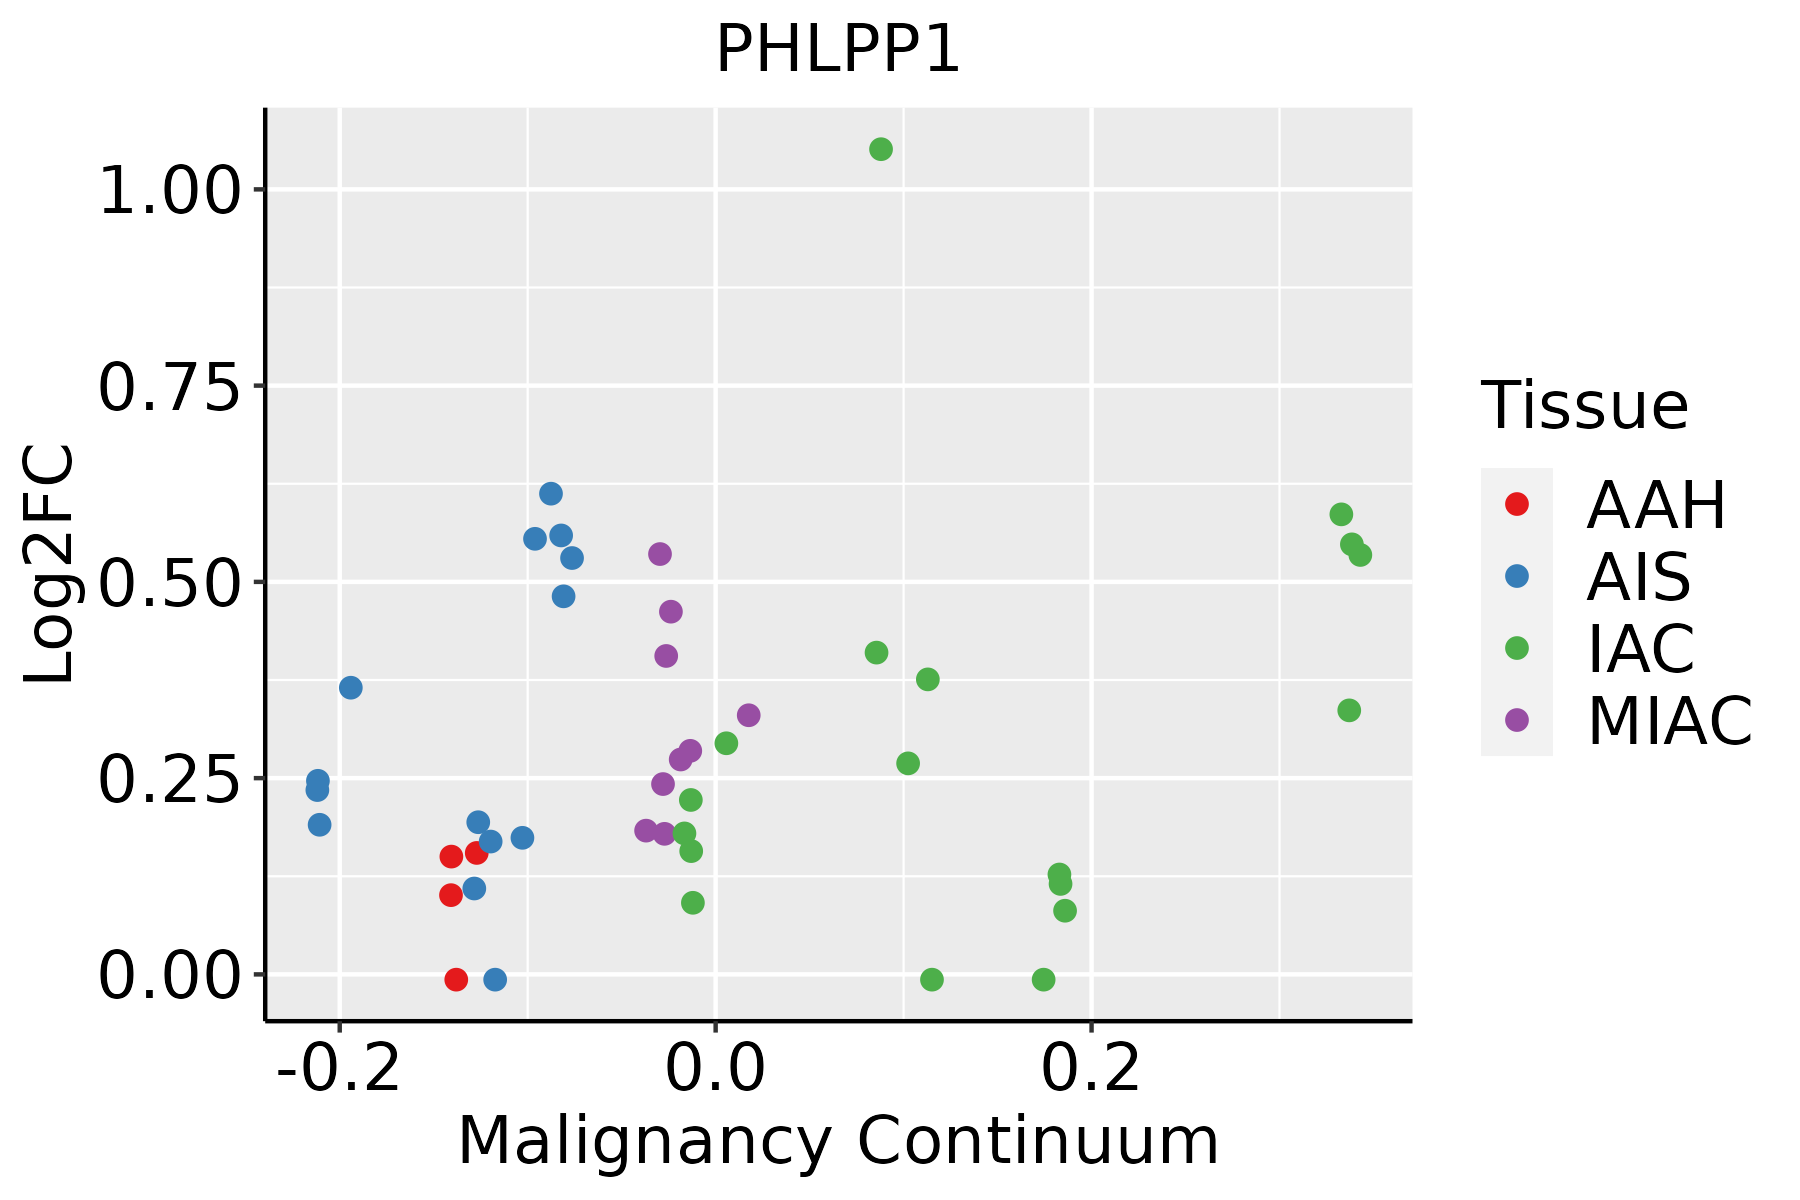 | AAH: Atypical adenomatous hyperplasia |
| AIS: Adenocarcinoma in situ |
| IAC: Invasive lung adenocarcinoma |
| MIA: Minimally invasive adenocarcinoma |
| Prostate | 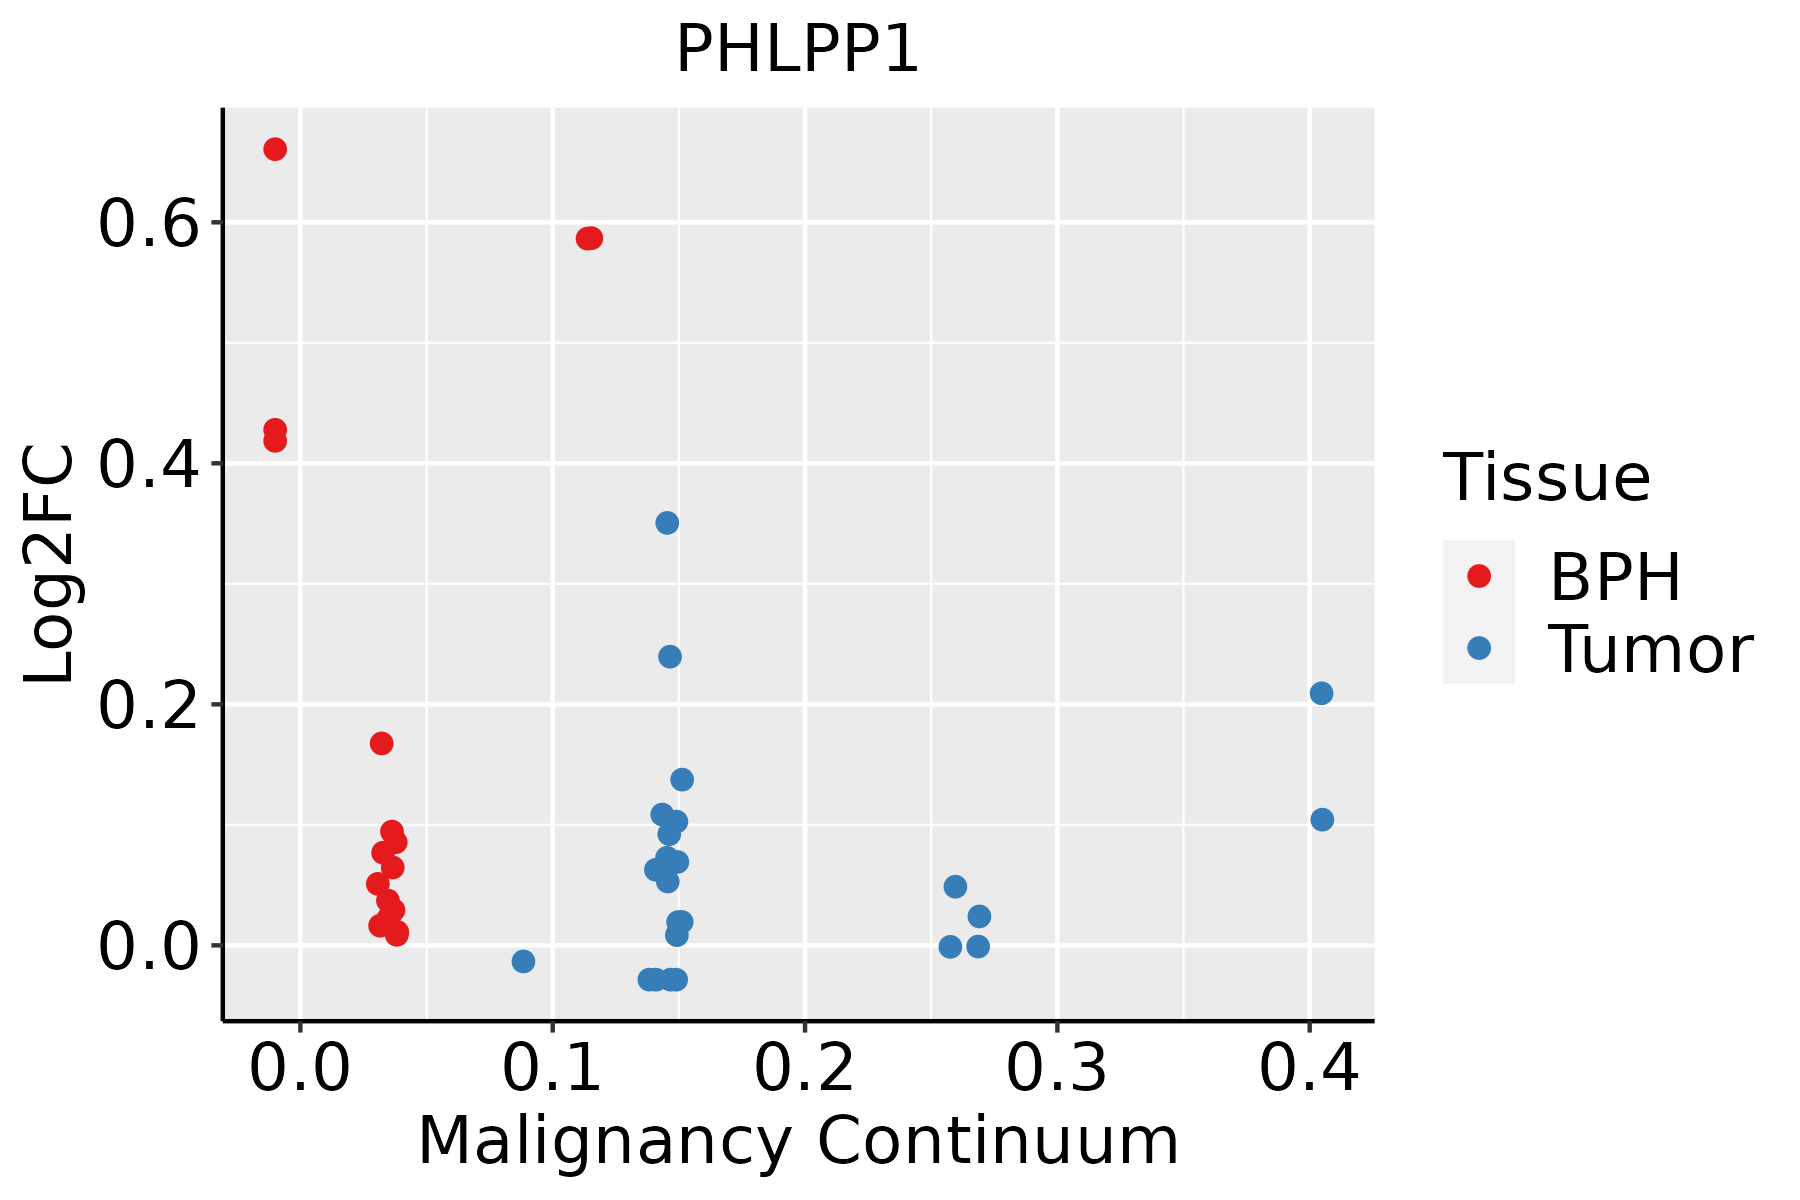 | BPH: Benign Prostatic Hyperplasia |
| Skin | 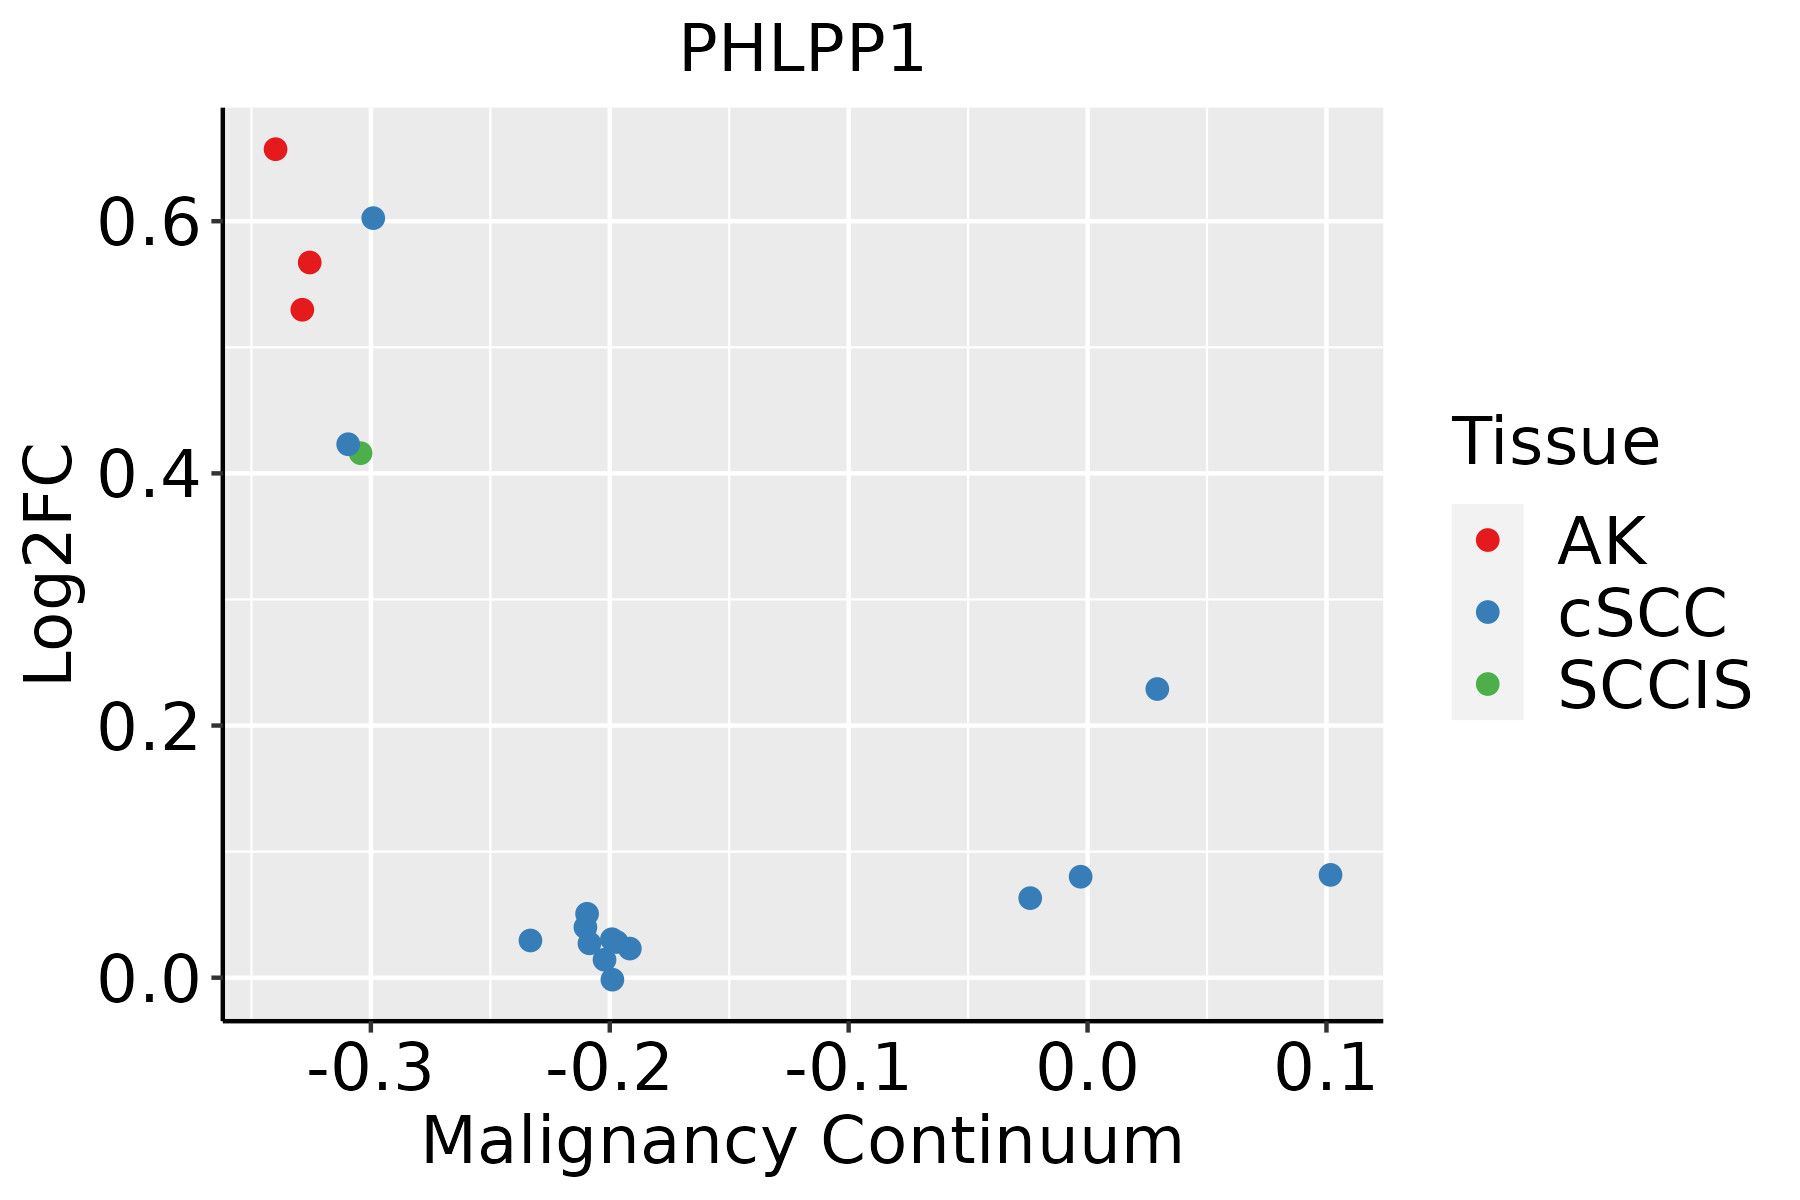 | AK: Actinic keratosis |
| cSCC: Cutaneous squamous cell carcinoma |
| SCCIS:squamous cell carcinoma in situ |
| GO ID | Tissue | Disease Stage | Description | Gene Ratio | Bg Ratio | pvalue | p.adjust | Count |
| GO:00310988 | Cervix | CC | stress-activated protein kinase signaling cascade | 58/2311 | 247/18723 | 8.02e-07 | 2.89e-05 | 58 |
| GO:00485118 | Cervix | CC | rhythmic process | 65/2311 | 298/18723 | 2.79e-06 | 8.04e-05 | 65 |
| GO:00514038 | Cervix | CC | stress-activated MAPK cascade | 55/2311 | 239/18723 | 2.96e-06 | 8.31e-05 | 55 |
| GO:00703027 | Cervix | CC | regulation of stress-activated protein kinase signaling cascade | 46/2311 | 195/18723 | 9.35e-06 | 2.11e-04 | 46 |
| GO:00064708 | Cervix | CC | protein dephosphorylation | 60/2311 | 281/18723 | 1.33e-05 | 2.68e-04 | 60 |
| GO:00328727 | Cervix | CC | regulation of stress-activated MAPK cascade | 44/2311 | 192/18723 | 3.09e-05 | 5.10e-04 | 44 |
| GO:00076238 | Cervix | CC | circadian rhythm | 46/2311 | 210/18723 | 6.76e-05 | 9.60e-04 | 46 |
| GO:00380664 | Cervix | CC | p38MAPK cascade | 17/2311 | 55/18723 | 2.25e-04 | 2.54e-03 | 17 |
| GO:00518964 | Cervix | CC | regulation of protein kinase B signaling | 39/2311 | 185/18723 | 5.25e-04 | 5.10e-03 | 39 |
| GO:00434913 | Cervix | CC | protein kinase B signaling | 43/2311 | 211/18723 | 5.95e-04 | 5.60e-03 | 43 |
| GO:00072545 | Cervix | CC | JNK cascade | 35/2311 | 167/18723 | 1.10e-03 | 9.09e-03 | 35 |
| GO:19007442 | Cervix | CC | regulation of p38MAPK cascade | 14/2311 | 47/18723 | 1.18e-03 | 9.56e-03 | 14 |
| GO:00163117 | Cervix | CC | dephosphorylation | 73/2311 | 417/18723 | 1.23e-03 | 9.87e-03 | 73 |
| GO:00463285 | Cervix | CC | regulation of JNK cascade | 28/2311 | 133/18723 | 3.06e-03 | 2.01e-02 | 28 |
| GO:0002507 | Cervix | CC | tolerance induction | 9/2311 | 28/18723 | 5.02e-03 | 2.98e-02 | 9 |
| GO:0007623 | Colorectum | AD | circadian rhythm | 72/3918 | 210/18723 | 4.50e-06 | 1.21e-04 | 72 |
| GO:0048511 | Colorectum | AD | rhythmic process | 94/3918 | 298/18723 | 1.00e-05 | 2.34e-04 | 94 |
| GO:0016311 | Colorectum | AD | dephosphorylation | 123/3918 | 417/18723 | 1.84e-05 | 3.82e-04 | 123 |
| GO:0006470 | Colorectum | AD | protein dephosphorylation | 88/3918 | 281/18723 | 2.56e-05 | 4.89e-04 | 88 |
| GO:0051403 | Colorectum | AD | stress-activated MAPK cascade | 72/3918 | 239/18723 | 4.77e-04 | 5.25e-03 | 72 |
| Pathway ID | Tissue | Disease Stage | Description | Gene Ratio | Bg Ratio | pvalue | p.adjust | qvalue | Count |
| hsa04151 | Colorectum | FAP | PI3K-Akt signaling pathway | 75/1404 | 354/8465 | 1.23e-02 | 4.19e-02 | 2.55e-02 | 75 |
| hsa041511 | Colorectum | FAP | PI3K-Akt signaling pathway | 75/1404 | 354/8465 | 1.23e-02 | 4.19e-02 | 2.55e-02 | 75 |
| hsa041512 | Colorectum | CRC | PI3K-Akt signaling pathway | 64/1091 | 354/8465 | 2.70e-03 | 1.77e-02 | 1.20e-02 | 64 |
| hsa041513 | Colorectum | CRC | PI3K-Akt signaling pathway | 64/1091 | 354/8465 | 2.70e-03 | 1.77e-02 | 1.20e-02 | 64 |
| hsa041514 | Lung | IAC | PI3K-Akt signaling pathway | 60/1053 | 354/8465 | 7.03e-03 | 2.86e-02 | 1.90e-02 | 60 |
| hsa0415111 | Lung | IAC | PI3K-Akt signaling pathway | 60/1053 | 354/8465 | 7.03e-03 | 2.86e-02 | 1.90e-02 | 60 |
| hsa0415121 | Lung | AIS | PI3K-Akt signaling pathway | 57/961 | 354/8465 | 3.72e-03 | 2.00e-02 | 1.28e-02 | 57 |
| hsa0415131 | Lung | AIS | PI3K-Akt signaling pathway | 57/961 | 354/8465 | 3.72e-03 | 2.00e-02 | 1.28e-02 | 57 |
| hsa041515 | Prostate | BPH | PI3K-Akt signaling pathway | 104/1718 | 354/8465 | 2.07e-05 | 1.55e-04 | 9.61e-05 | 104 |
| hsa0415112 | Prostate | BPH | PI3K-Akt signaling pathway | 104/1718 | 354/8465 | 2.07e-05 | 1.55e-04 | 9.61e-05 | 104 |
| hsa0415122 | Prostate | Tumor | PI3K-Akt signaling pathway | 105/1791 | 354/8465 | 7.42e-05 | 5.30e-04 | 3.28e-04 | 105 |
| hsa0415132 | Prostate | Tumor | PI3K-Akt signaling pathway | 105/1791 | 354/8465 | 7.42e-05 | 5.30e-04 | 3.28e-04 | 105 |
| Hugo Symbol | Variant Class | Variant Classification | dbSNP RS | HGVSc | HGVSp | HGVSp Short | SWISSPROT | BIOTYPE | SIFT | PolyPhen | Tumor Sample Barcode | Tissue | Histology | Sex | Age | Stage | Therapy Types | Drugs | Outcome |
| PHLPP1 | SNV | Missense_Mutation | rs775009348 | c.3298N>A | p.Glu1100Lys | p.E1100K | O60346 | protein_coding | deleterious(0.03) | probably_damaging(0.986) | TCGA-AN-A046-01 | Breast | breast invasive carcinoma | Female | >=65 | I/II | Unknown | Unknown | SD |
| PHLPP1 | SNV | Missense_Mutation | | c.3817N>A | p.Asp1273Asn | p.D1273N | O60346 | protein_coding | deleterious(0.01) | probably_damaging(0.999) | TCGA-BH-A0EE-01 | Breast | breast invasive carcinoma | Female | >=65 | I/II | Chemotherapy | docetaxel | SD |
| PHLPP1 | SNV | Missense_Mutation | | c.3976N>G | p.Ile1326Val | p.I1326V | O60346 | protein_coding | tolerated(0.17) | benign(0.114) | TCGA-D8-A147-01 | Breast | breast invasive carcinoma | Female | <65 | I/II | Chemotherapy | doxorubicine | SD |
| PHLPP1 | SNV | Missense_Mutation | | c.4765N>A | p.Glu1589Lys | p.E1589K | O60346 | protein_coding | tolerated(0.2) | benign(0.366) | TCGA-D8-A1JJ-01 | Breast | breast invasive carcinoma | Female | <65 | I/II | Chemotherapy | doxorubicine | SD |
| PHLPP1 | SNV | Missense_Mutation | | c.1569C>G | p.Phe523Leu | p.F523L | O60346 | protein_coding | deleterious(0.02) | benign(0.01) | TCGA-D8-A27G-01 | Breast | breast invasive carcinoma | Female | >=65 | I/II | Unknown | Unknown | SD |
| PHLPP1 | SNV | Missense_Mutation | | c.2242T>G | p.Phe748Val | p.F748V | O60346 | protein_coding | tolerated(0.28) | benign(0.119) | TCGA-E9-A1R7-01 | Breast | breast invasive carcinoma | Female | <65 | I/II | Hormone Therapy | fareston | SD |
| PHLPP1 | deletion | Frame_Shift_Del | novel | c.2924delN | p.Glu976SerfsTer7 | p.E976Sfs*7 | O60346 | protein_coding | | | TCGA-D8-A27V-01 | Breast | breast invasive carcinoma | Female | <65 | I/II | Hormone Therapy | tamoxiphen | SD |
| PHLPP1 | deletion | Frame_Shift_Del | novel | c.3562delN | p.Leu1188CysfsTer8 | p.L1188Cfs*8 | O60346 | protein_coding | | | TCGA-D8-A27V-01 | Breast | breast invasive carcinoma | Female | <65 | I/II | Hormone Therapy | tamoxiphen | SD |
| PHLPP1 | deletion | Frame_Shift_Del | novel | c.1455delN | p.Glu486ArgfsTer69 | p.E486Rfs*69 | O60346 | protein_coding | | | TCGA-EW-A2FV-01 | Breast | breast invasive carcinoma | Female | <65 | III/IV | Chemotherapy | docetaxel | SD |
| PHLPP1 | SNV | Missense_Mutation | | c.3902N>T | p.Pro1301Leu | p.P1301L | O60346 | protein_coding | deleterious(0.01) | probably_damaging(0.931) | TCGA-2W-A8YY-01 | Cervix | cervical & endocervical cancer | Female | <65 | I/II | Chemotherapy | cisplatin | CR |


