
|
|||||
|
 | |
| |
| |
| |
| |
| |
|
Gene: PHLDB1 |
Gene summary for PHLDB1 |
| Gene information | Species | Human | Gene symbol | PHLDB1 | Gene ID | 23187 |
| Gene name | pleckstrin homology like domain family B member 1 | |
| Gene Alias | LL5A | |
| Cytomap | 11q23.3 | |
| Gene Type | protein-coding | GO ID | GO:0000226 | UniProtAcc | A0A024R3H6 |
Top |
Malignant transformation analysis |
| Identification of the aberrant gene expression in precancerous and cancerous lesions by comparing the gene expression of stem-like cells in diseased tissues with normal stem cells |
| Entrez ID | Symbol | Replicates | Species | Organ | Tissue | Adj P-value | Log2FC | Malignancy |
| 23187 | PHLDB1 | LZE22T | Human | Esophagus | ESCC | 7.58e-04 | 6.65e-01 | 0.068 |
| 23187 | PHLDB1 | LZE24T | Human | Esophagus | ESCC | 3.13e-04 | 1.06e-01 | 0.0596 |
| 23187 | PHLDB1 | LZE22D3 | Human | Esophagus | HGIN | 1.80e-02 | 4.63e-01 | 0.0653 |
| 23187 | PHLDB1 | P2T-E | Human | Esophagus | ESCC | 1.80e-19 | 2.72e-01 | 0.1177 |
| 23187 | PHLDB1 | P4T-E | Human | Esophagus | ESCC | 1.40e-17 | 2.65e-01 | 0.1323 |
| 23187 | PHLDB1 | P5T-E | Human | Esophagus | ESCC | 1.05e-02 | 5.58e-02 | 0.1327 |
| 23187 | PHLDB1 | P8T-E | Human | Esophagus | ESCC | 4.55e-10 | 2.24e-01 | 0.0889 |
| 23187 | PHLDB1 | P9T-E | Human | Esophagus | ESCC | 1.55e-07 | 2.39e-01 | 0.1131 |
| 23187 | PHLDB1 | P10T-E | Human | Esophagus | ESCC | 4.45e-05 | 1.26e-01 | 0.116 |
| 23187 | PHLDB1 | P11T-E | Human | Esophagus | ESCC | 2.51e-24 | 9.32e-01 | 0.1426 |
| 23187 | PHLDB1 | P12T-E | Human | Esophagus | ESCC | 3.65e-11 | 2.46e-01 | 0.1122 |
| 23187 | PHLDB1 | P15T-E | Human | Esophagus | ESCC | 1.52e-08 | 9.51e-02 | 0.1149 |
| 23187 | PHLDB1 | P16T-E | Human | Esophagus | ESCC | 2.09e-14 | 3.02e-01 | 0.1153 |
| 23187 | PHLDB1 | P17T-E | Human | Esophagus | ESCC | 3.33e-03 | 1.55e-01 | 0.1278 |
| 23187 | PHLDB1 | P19T-E | Human | Esophagus | ESCC | 7.62e-07 | 3.24e-01 | 0.1662 |
| 23187 | PHLDB1 | P21T-E | Human | Esophagus | ESCC | 5.93e-16 | 2.81e-01 | 0.1617 |
| 23187 | PHLDB1 | P22T-E | Human | Esophagus | ESCC | 7.01e-06 | 8.93e-02 | 0.1236 |
| 23187 | PHLDB1 | P23T-E | Human | Esophagus | ESCC | 1.70e-05 | 2.05e-01 | 0.108 |
| 23187 | PHLDB1 | P24T-E | Human | Esophagus | ESCC | 3.01e-09 | 1.72e-01 | 0.1287 |
| 23187 | PHLDB1 | P26T-E | Human | Esophagus | ESCC | 3.24e-11 | 1.46e-01 | 0.1276 |
| Page: 1 2 3 4 |
| Tissue | Expression Dynamics | Abbreviation |
| Esophagus |  | ESCC: Esophageal squamous cell carcinoma |
| HGIN: High-grade intraepithelial neoplasias | ||
| LGIN: Low-grade intraepithelial neoplasias | ||
| Thyroid | 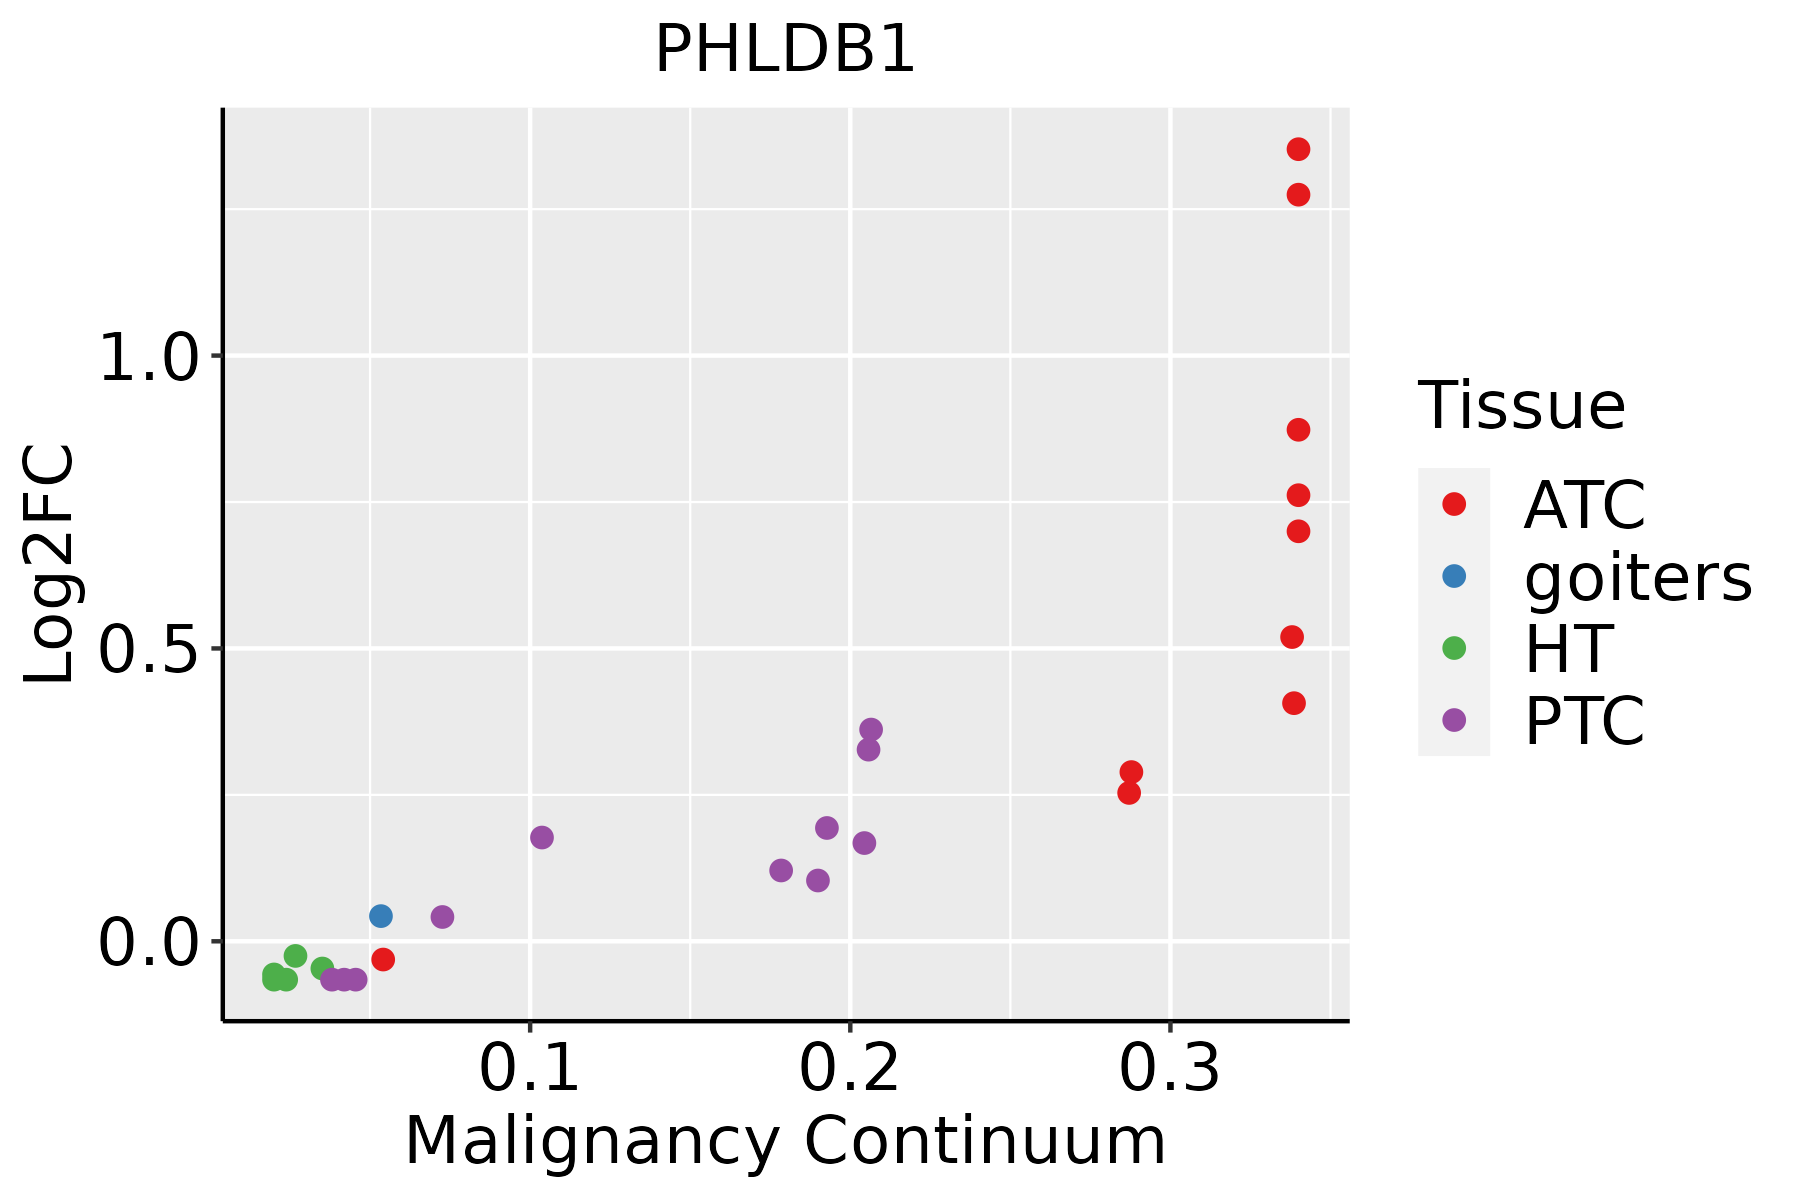 | ATC: Anaplastic thyroid cancer |
| HT: Hashimoto's thyroiditis | ||
| PTC: Papillary thyroid cancer |
| ∗log2FC in expression of this searched gene in stem-like cells from each diseased tissue sample relative to stem-like cells in normal samples in each tissue plotted against the malignancy continuum. Samples are colored based on if they are from different disease stage. |
Top |
Malignant transformation related pathway analysis |
| Find out the enriched GO biological processes and KEGG pathways involved in transition from healthy to precancer to cancer |
| Tissue | Disease Stage | Enriched GO biological Processes |
| Colorectum | AD |  |
| Colorectum | SER |  |
| Colorectum | MSS |  |
| Colorectum | MSI-H |  |
| Colorectum | FAP |  |
| ∗Top 15 enriched GO BP terms are showed in the bar plot of each disease state in each tissue. Each row represents a significant GO biological process which is colored according to the -log10(p.adjust). |
| Page: 1 2 3 4 5 6 7 8 9 |
| GO ID | Tissue | Disease Stage | Description | Gene Ratio | Bg Ratio | pvalue | p.adjust | Count |
| GO:00705078 | Esophagus | ESCC | regulation of microtubule cytoskeleton organization | 99/8552 | 148/18723 | 1.43e-07 | 2.29e-06 | 99 |
| GO:00073698 | Esophagus | ESCC | gastrulation | 115/8552 | 185/18723 | 4.35e-06 | 4.64e-05 | 115 |
| GO:00301984 | Esophagus | ESCC | extracellular matrix organization | 171/8552 | 301/18723 | 6.08e-05 | 4.67e-04 | 171 |
| GO:00430624 | Esophagus | ESCC | extracellular structure organization | 171/8552 | 302/18723 | 7.73e-05 | 5.76e-04 | 171 |
| GO:00452294 | Esophagus | ESCC | external encapsulating structure organization | 172/8552 | 304/18723 | 7.80e-05 | 5.80e-04 | 172 |
| GO:00018378 | Esophagus | ESCC | epithelial to mesenchymal transition | 95/8552 | 157/18723 | 1.25e-04 | 8.56e-04 | 95 |
| GO:19030553 | Esophagus | ESCC | positive regulation of extracellular matrix organization | 20/8552 | 25/18723 | 4.81e-04 | 2.69e-03 | 20 |
| GO:00487628 | Esophagus | ESCC | mesenchymal cell differentiation | 133/8552 | 236/18723 | 5.94e-04 | 3.22e-03 | 133 |
| GO:00328864 | Esophagus | ESCC | regulation of microtubule-based process | 134/8552 | 240/18723 | 9.44e-04 | 4.80e-03 | 134 |
| GO:00107174 | Esophagus | ESCC | regulation of epithelial to mesenchymal transition | 61/8552 | 99/18723 | 1.01e-03 | 5.09e-03 | 61 |
| GO:00101711 | Esophagus | ESCC | body morphogenesis | 30/8552 | 43/18723 | 1.21e-03 | 5.88e-03 | 30 |
| GO:00604856 | Esophagus | ESCC | mesenchyme development | 156/8552 | 291/18723 | 3.76e-03 | 1.53e-02 | 156 |
| GO:00717115 | Esophagus | ESCC | basement membrane organization | 22/8552 | 31/18723 | 3.90e-03 | 1.58e-02 | 22 |
| GO:19012033 | Esophagus | ESCC | positive regulation of extracellular matrix assembly | 9/8552 | 10/18723 | 5.09e-03 | 1.92e-02 | 9 |
| GO:00850292 | Esophagus | ESCC | extracellular matrix assembly | 29/8552 | 45/18723 | 8.63e-03 | 3.04e-02 | 29 |
| GO:19030532 | Esophagus | ESCC | regulation of extracellular matrix organization | 30/8552 | 48/18723 | 1.40e-02 | 4.57e-02 | 30 |
| GO:007050717 | Thyroid | PTC | regulation of microtubule cytoskeleton organization | 80/5968 | 148/18723 | 1.79e-08 | 4.19e-07 | 80 |
| GO:000183715 | Thyroid | PTC | epithelial to mesenchymal transition | 76/5968 | 157/18723 | 1.10e-05 | 1.21e-04 | 76 |
| GO:00328866 | Thyroid | PTC | regulation of microtubule-based process | 105/5968 | 240/18723 | 6.91e-05 | 6.03e-04 | 105 |
| GO:000736910 | Thyroid | PTC | gastrulation | 84/5968 | 185/18723 | 7.58e-05 | 6.52e-04 | 84 |
| Page: 1 2 3 |
| Pathway ID | Tissue | Disease Stage | Description | Gene Ratio | Bg Ratio | pvalue | p.adjust | qvalue | Count |
| Page: 1 |
Top |
Cell-cell communication analysis |
| Identification of potential cell-cell interactions between two cell types and their ligand-receptor pairs for different disease states |
| Ligand | Receptor | LRpair | Pathway | Tissue | Disease Stage |
| Page: 1 |
Top |
Single-cell gene regulatory network inference analysis |
| Find out the significant the regulons (TFs) and the target genes of each regulon across cell types for different disease states |
| TF | Cell Type | Tissue | Disease Stage | Target Gene | RSS | Regulon Activity |
| ∗The dot plots of a searched regulon are shown for all cell subpopulations in each disease state of each tissue based on the regulon specific score inferred using pySCENIC and by calculating the average expression. |
| Page: 1 |
Top |
Somatic mutation of malignant transformation related genes |
| Annotation of somatic variants for genes involved in malignant transformation |
| Hugo Symbol | Variant Class | Variant Classification | dbSNP RS | HGVSc | HGVSp | HGVSp Short | SWISSPROT | BIOTYPE | SIFT | PolyPhen | Tumor Sample Barcode | Tissue | Histology | Sex | Age | Stage | Therapy Types | Drugs | Outcome |
| PHLDB1 | SNV | Missense_Mutation | c.1135N>T | p.Pro379Ser | p.P379S | Q86UU1 | protein_coding | deleterious(0.04) | benign(0.003) | TCGA-A7-A0CE-01 | Breast | breast invasive carcinoma | Female | <65 | I/II | Chemotherapy | adriamycin | SD | |
| PHLDB1 | SNV | Missense_Mutation | novel | c.2554G>C | p.Asp852His | p.D852H | Q86UU1 | protein_coding | deleterious(0.01) | benign(0.347) | TCGA-A7-A4SF-01 | Breast | breast invasive carcinoma | Female | <65 | I/II | Chemotherapy | carboplatin | CR |
| PHLDB1 | SNV | Missense_Mutation | c.2678G>C | p.Arg893Thr | p.R893T | Q86UU1 | protein_coding | deleterious(0) | benign(0.366) | TCGA-A7-A4SF-01 | Breast | breast invasive carcinoma | Female | <65 | I/II | Chemotherapy | carboplatin | CR | |
| PHLDB1 | SNV | Missense_Mutation | rs781810580 | c.1400N>A | p.Arg467Gln | p.R467Q | Q86UU1 | protein_coding | deleterious(0.01) | probably_damaging(0.968) | TCGA-AN-A046-01 | Breast | breast invasive carcinoma | Female | >=65 | I/II | Unknown | Unknown | SD |
| PHLDB1 | SNV | Missense_Mutation | rs782206998 | c.236N>A | p.Gly79Asp | p.G79D | Q86UU1 | protein_coding | deleterious(0) | probably_damaging(0.998) | TCGA-AN-A0XS-01 | Breast | breast invasive carcinoma | Female | <65 | III/IV | Unknown | Unknown | SD |
| PHLDB1 | SNV | Missense_Mutation | c.743A>G | p.Tyr248Cys | p.Y248C | Q86UU1 | protein_coding | deleterious(0) | probably_damaging(0.995) | TCGA-B6-A0WX-01 | Breast | breast invasive carcinoma | Female | <65 | III/IV | Unknown | Unknown | PD | |
| PHLDB1 | SNV | Missense_Mutation | rs782211405 | c.346N>A | p.Leu116Ile | p.L116I | Q86UU1 | protein_coding | deleterious(0) | probably_damaging(0.987) | TCGA-BH-A0BF-01 | Breast | breast invasive carcinoma | Female | <65 | I/II | Unknown | Unknown | SD |
| PHLDB1 | SNV | Missense_Mutation | c.997N>A | p.Asp333Asn | p.D333N | Q86UU1 | protein_coding | tolerated(0.11) | benign(0.379) | TCGA-BH-A0HF-01 | Breast | breast invasive carcinoma | Female | >=65 | I/II | Hormone Therapy | arimidex | SD | |
| PHLDB1 | SNV | Missense_Mutation | c.1304N>T | p.Thr435Ile | p.T435I | Q86UU1 | protein_coding | deleterious(0.02) | benign(0.021) | TCGA-BH-A0HF-01 | Breast | breast invasive carcinoma | Female | >=65 | I/II | Hormone Therapy | arimidex | SD | |
| PHLDB1 | SNV | Missense_Mutation | c.1044N>T | p.Glu348Asp | p.E348D | Q86UU1 | protein_coding | tolerated(0.14) | benign(0.253) | TCGA-C8-A134-01 | Breast | breast invasive carcinoma | Female | <65 | I/II | Chemotherapy | 5-fluorouracil | CR |
| Page: 1 2 3 4 5 6 7 8 9 10 11 12 13 14 15 |
Top |
Related drugs of malignant transformation related genes |
| Identification of chemicals and drugs interact with genes involved in malignant transfromation |
| (DGIdb 4.0) |
| Entrez ID | Symbol | Category | Interaction Types | Drug Claim Name | Drug Name | PMIDs |
| Page: 1 |

Copyright 2023-Present -The University of Texas Health Science Center at Houston |