
|
|||||
|
 | |
| |
| |
| |
| |
| |
|
Gene: PHLDA1 |
Gene summary for PHLDA1 |
| Gene information | Species | Human | Gene symbol | PHLDA1 | Gene ID | 22822 |
| Gene name | pleckstrin homology like domain family A member 1 | |
| Gene Alias | DT1P1B11 | |
| Cytomap | 12q21.2 | |
| Gene Type | protein-coding | GO ID | GO:0006807 | UniProtAcc | Q8WV24 |
Top |
Malignant transformation analysis |
| Identification of the aberrant gene expression in precancerous and cancerous lesions by comparing the gene expression of stem-like cells in diseased tissues with normal stem cells |
| Entrez ID | Symbol | Replicates | Species | Organ | Tissue | Adj P-value | Log2FC | Malignancy |
| 22822 | PHLDA1 | GSM4909281 | Human | Breast | IDC | 3.80e-10 | -5.43e-01 | 0.21 |
| 22822 | PHLDA1 | GSM4909282 | Human | Breast | IDC | 4.36e-14 | -5.80e-01 | -0.0288 |
| 22822 | PHLDA1 | GSM4909285 | Human | Breast | IDC | 2.40e-11 | -5.09e-01 | 0.21 |
| 22822 | PHLDA1 | GSM4909286 | Human | Breast | IDC | 8.28e-28 | -6.96e-01 | 0.1081 |
| 22822 | PHLDA1 | GSM4909287 | Human | Breast | IDC | 2.49e-10 | -4.84e-01 | 0.2057 |
| 22822 | PHLDA1 | GSM4909291 | Human | Breast | IDC | 9.31e-15 | -6.52e-01 | 0.1753 |
| 22822 | PHLDA1 | GSM4909292 | Human | Breast | IDC | 2.15e-04 | -7.09e-01 | 0.1236 |
| 22822 | PHLDA1 | GSM4909293 | Human | Breast | IDC | 6.93e-27 | -6.87e-01 | 0.1581 |
| 22822 | PHLDA1 | GSM4909294 | Human | Breast | IDC | 4.09e-28 | -6.51e-01 | 0.2022 |
| 22822 | PHLDA1 | GSM4909296 | Human | Breast | IDC | 1.13e-19 | -6.13e-01 | 0.1524 |
| 22822 | PHLDA1 | GSM4909297 | Human | Breast | IDC | 5.53e-10 | -4.08e-01 | 0.1517 |
| 22822 | PHLDA1 | GSM4909298 | Human | Breast | IDC | 1.49e-04 | -3.63e-01 | 0.1551 |
| 22822 | PHLDA1 | GSM4909301 | Human | Breast | IDC | 3.96e-29 | -6.98e-01 | 0.1577 |
| 22822 | PHLDA1 | GSM4909302 | Human | Breast | IDC | 1.62e-18 | -5.90e-01 | 0.1545 |
| 22822 | PHLDA1 | GSM4909303 | Human | Breast | IDC | 2.08e-02 | -5.00e-01 | 0.0438 |
| 22822 | PHLDA1 | GSM4909304 | Human | Breast | IDC | 5.02e-25 | -6.84e-01 | 0.1636 |
| 22822 | PHLDA1 | GSM4909306 | Human | Breast | IDC | 7.53e-09 | -5.44e-01 | 0.1564 |
| 22822 | PHLDA1 | GSM4909307 | Human | Breast | IDC | 2.67e-09 | -5.27e-01 | 0.1569 |
| 22822 | PHLDA1 | GSM4909308 | Human | Breast | IDC | 2.45e-11 | -5.22e-01 | 0.158 |
| 22822 | PHLDA1 | GSM4909309 | Human | Breast | IDC | 4.06e-09 | -4.89e-01 | 0.0483 |
| Page: 1 2 3 4 5 6 7 8 9 10 11 |
| Tissue | Expression Dynamics | Abbreviation |
| Breast | 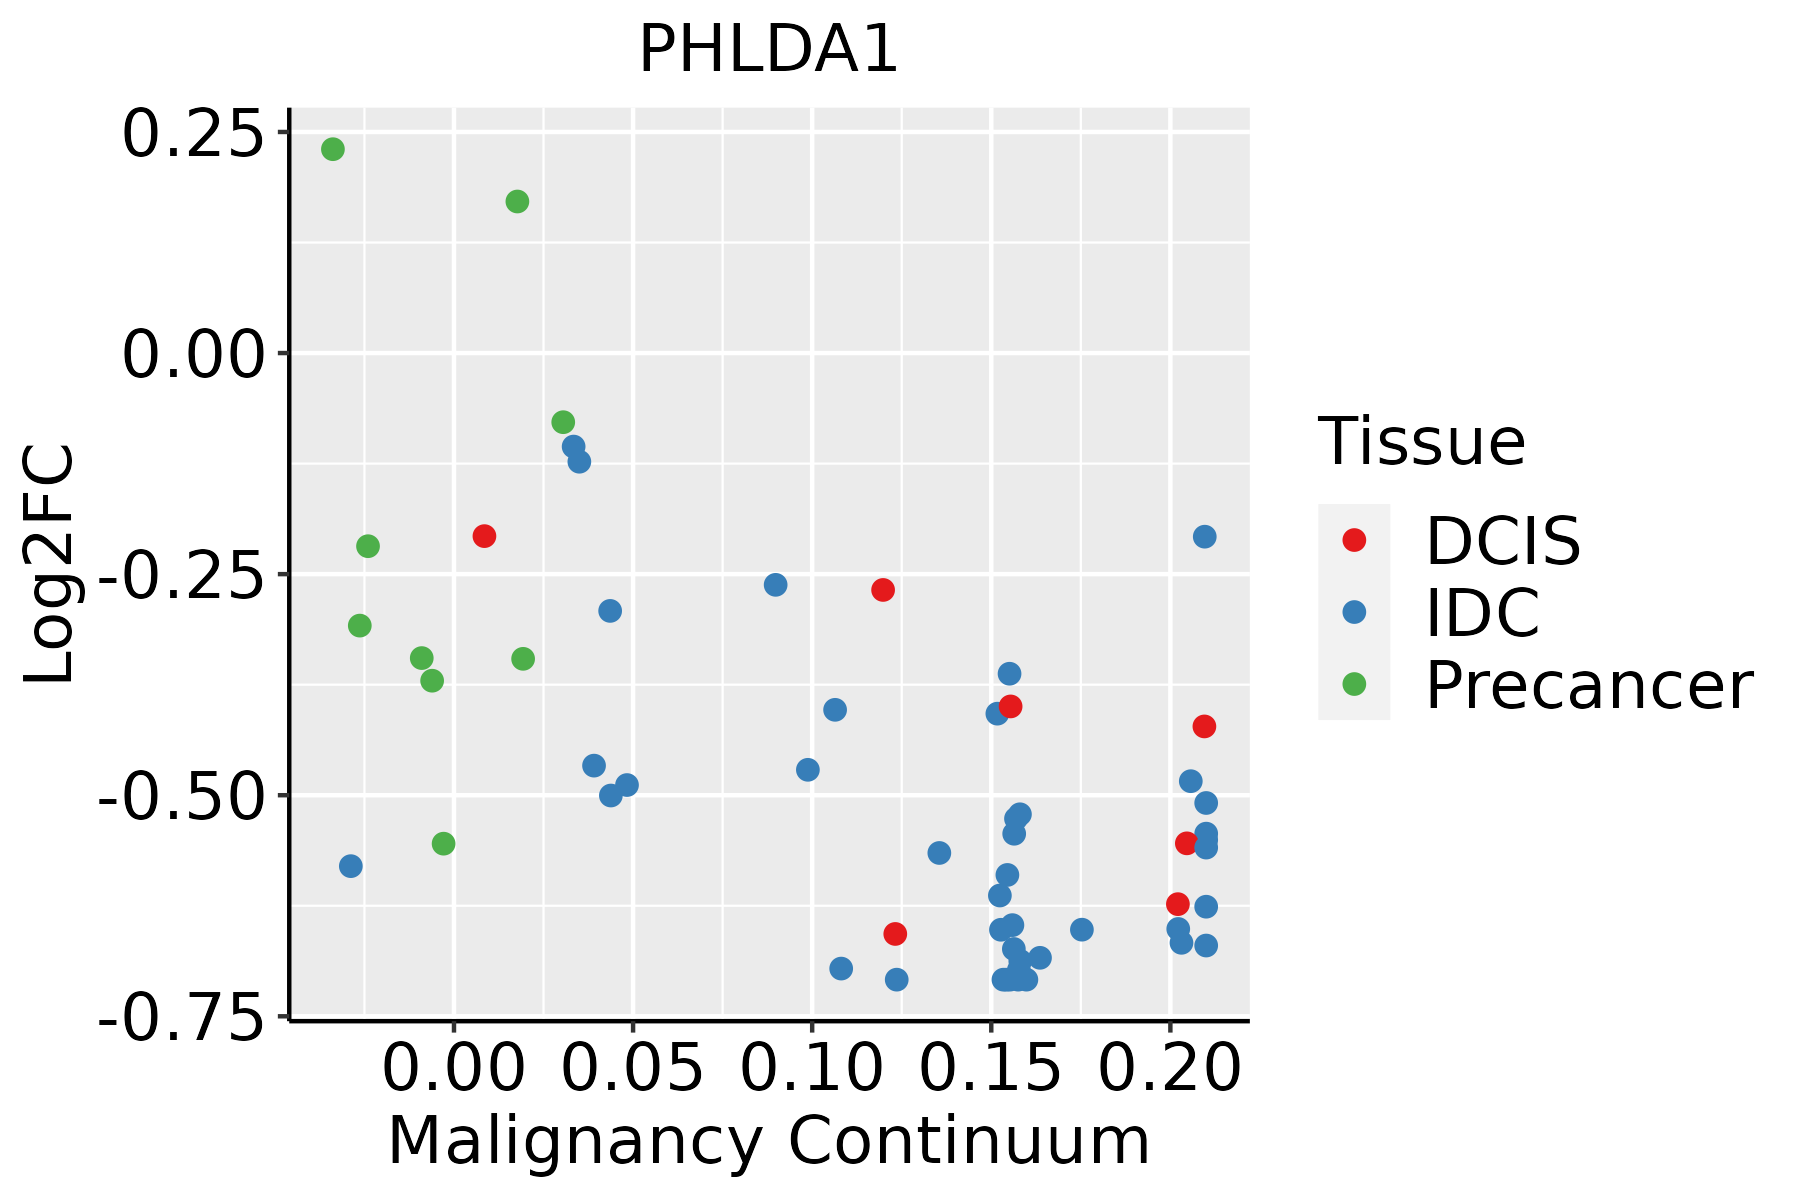 | IDC: Invasive ductal carcinoma |
| DCIS: Ductal carcinoma in situ | ||
| Precancer(BRCA1-mut): Precancerous lesion from BRCA1 mutation carriers | ||
| Cervix | 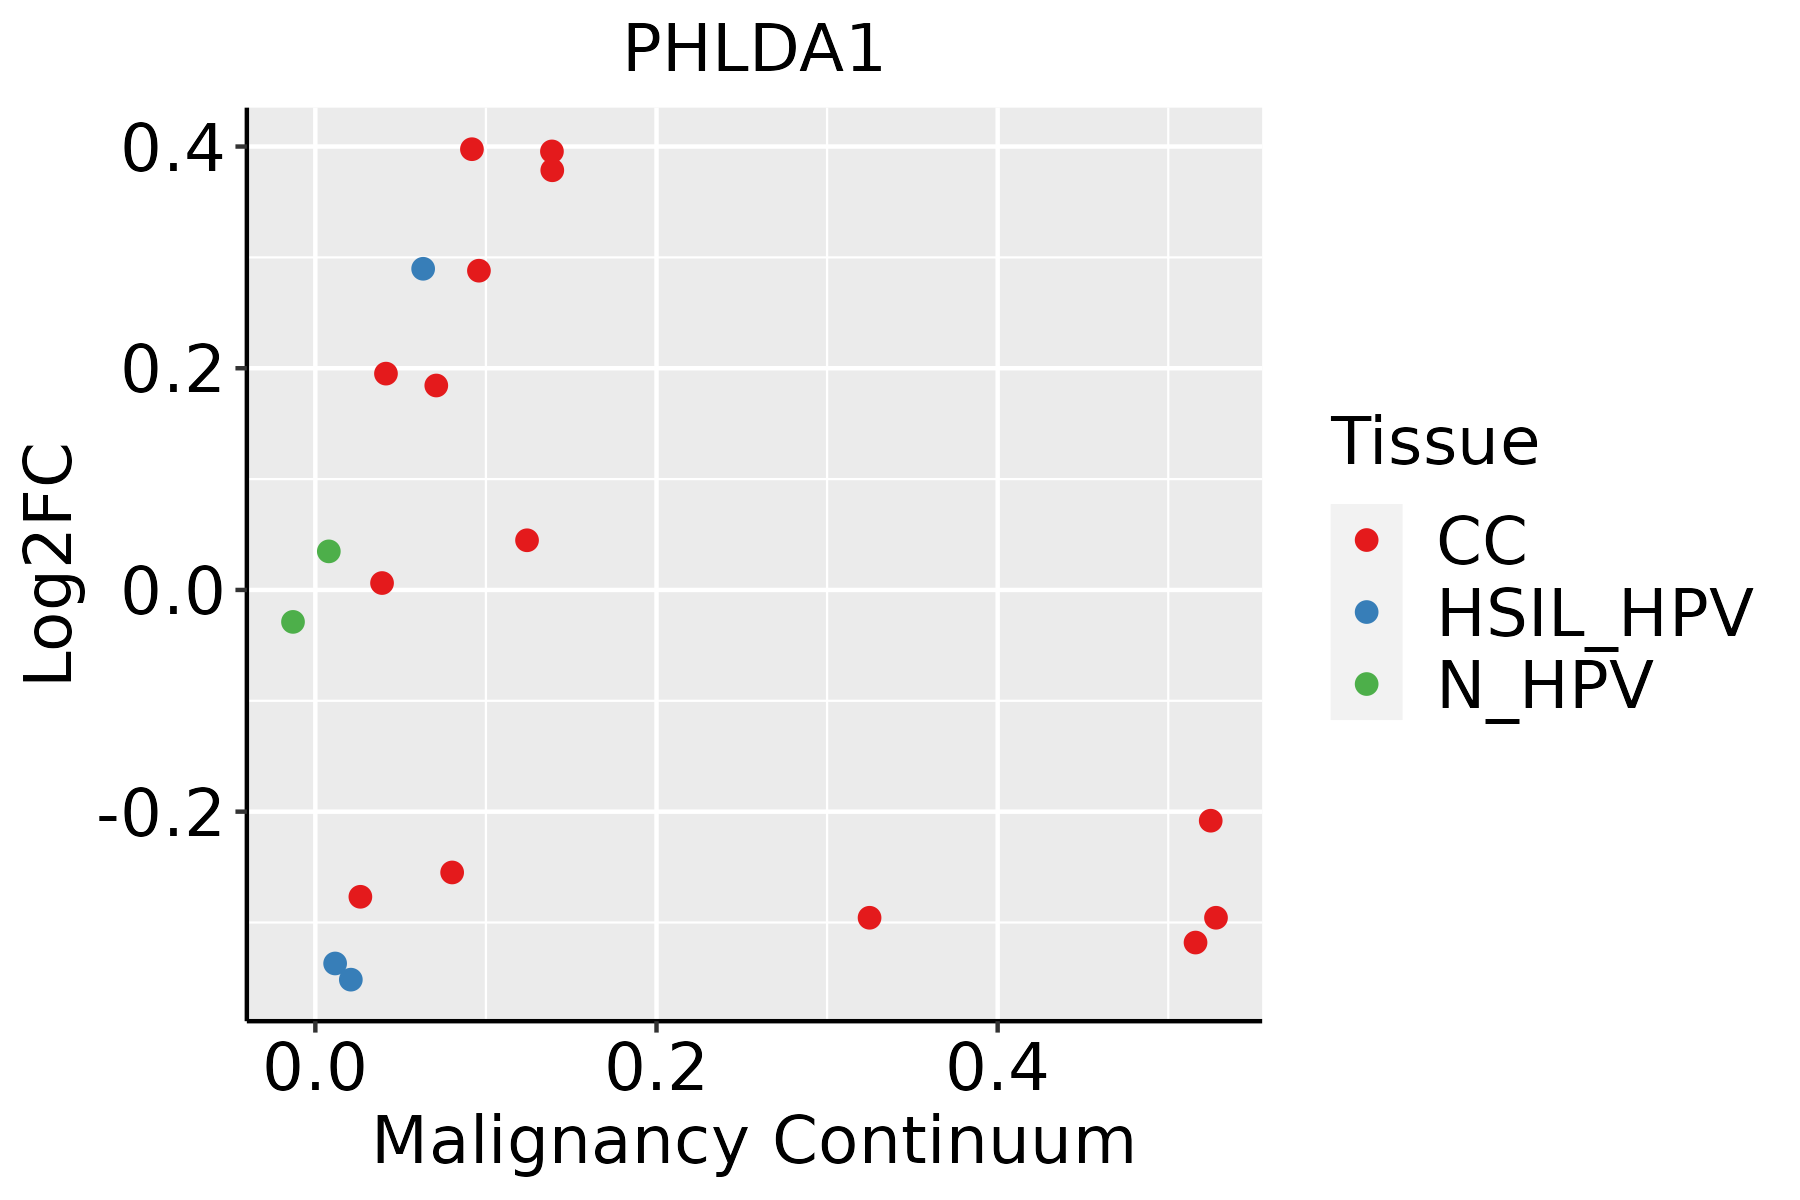 | CC: Cervix cancer |
| HSIL_HPV: HPV-infected high-grade squamous intraepithelial lesions | ||
| N_HPV: HPV-infected normal cervix | ||
| Colorectum (GSE201348) |  | FAP: Familial adenomatous polyposis |
| CRC: Colorectal cancer | ||
| Colorectum (HTA11) |  | AD: Adenomas |
| SER: Sessile serrated lesions | ||
| MSI-H: Microsatellite-high colorectal cancer | ||
| MSS: Microsatellite stable colorectal cancer | ||
| Esophagus |  | ESCC: Esophageal squamous cell carcinoma |
| HGIN: High-grade intraepithelial neoplasias | ||
| LGIN: Low-grade intraepithelial neoplasias | ||
| GC | 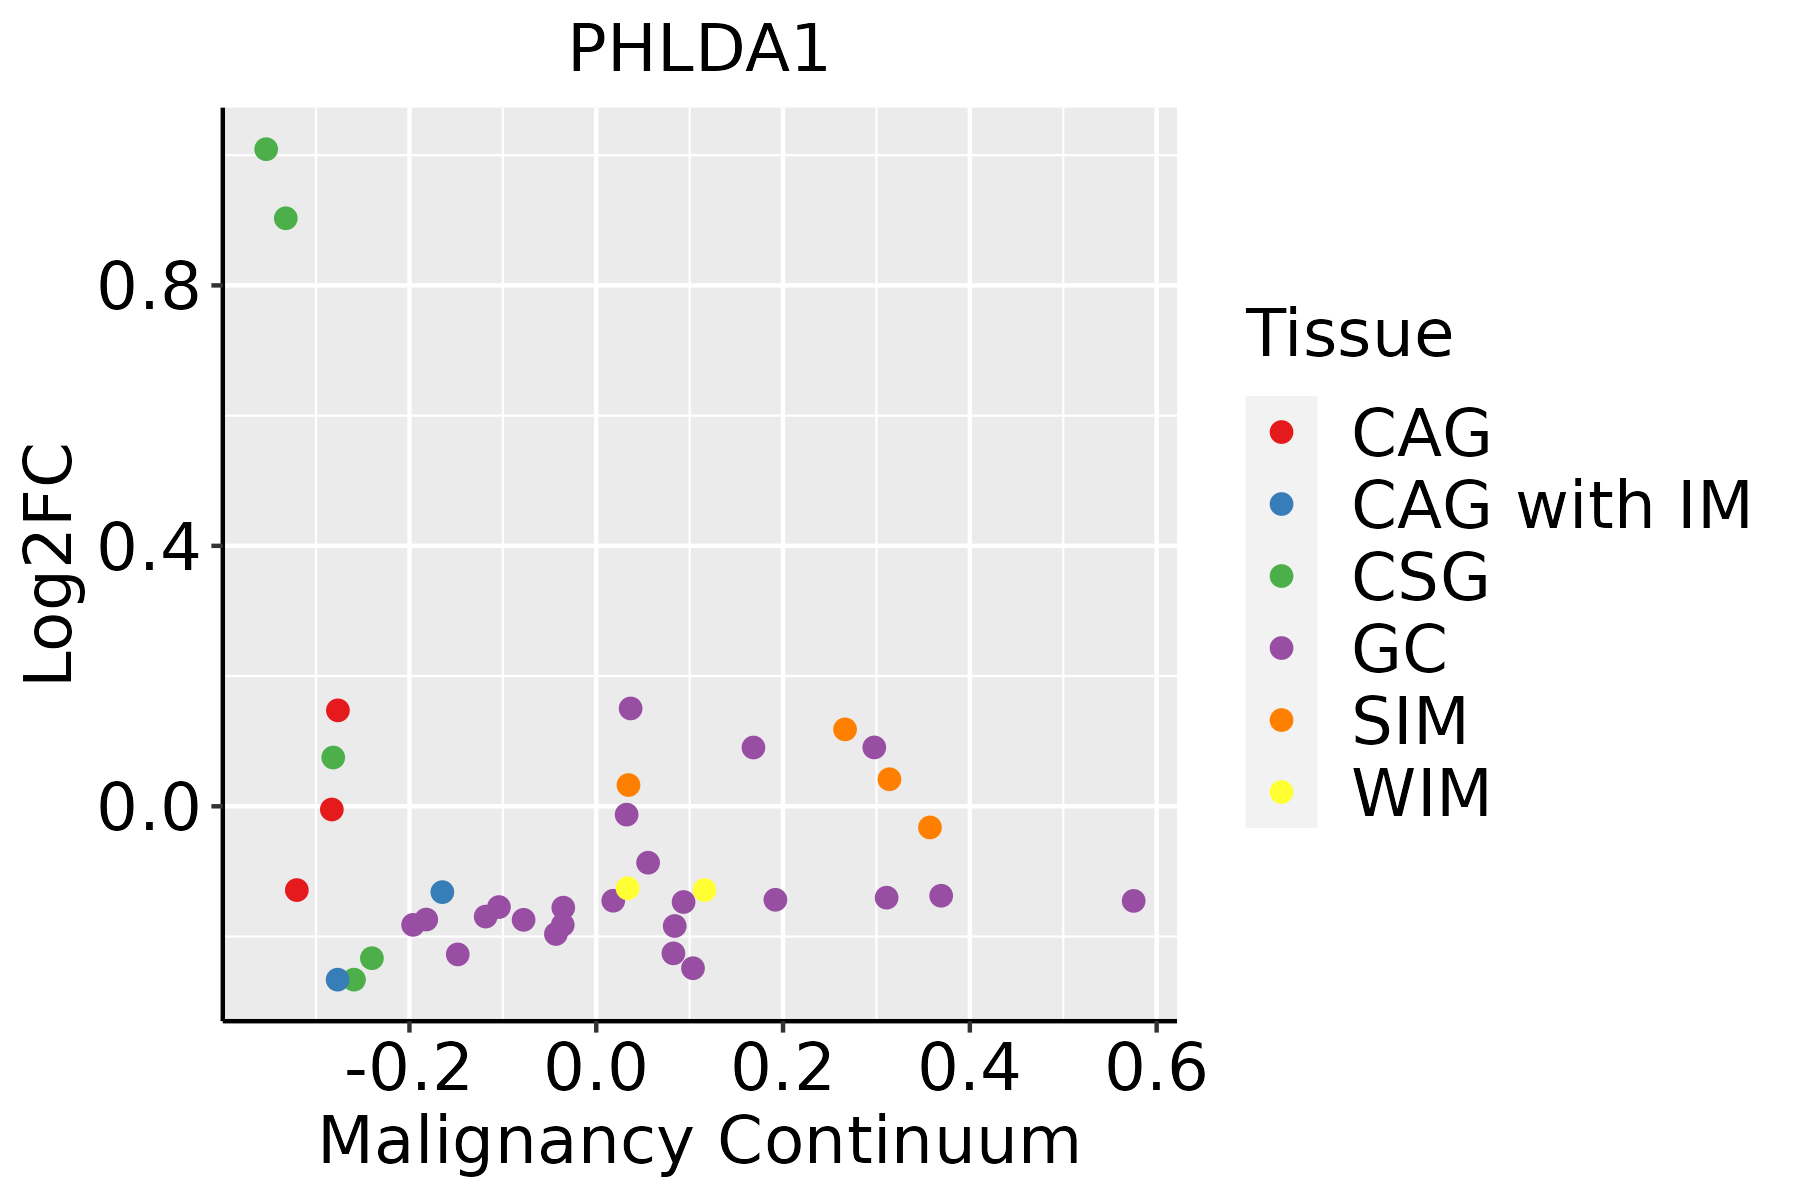 | CAG: Chronic atrophic gastritis |
| CAG with IM: Chronic atrophic gastritis with intestinal metaplasia | ||
| CSG: Chronic superficial gastritis | ||
| GC: Gastric cancer | ||
| SIM: Severe intestinal metaplasia | ||
| WIM: Wild intestinal metaplasia | ||
| Liver |  | HCC: Hepatocellular carcinoma |
| NAFLD: Non-alcoholic fatty liver disease | ||
| Oral Cavity | 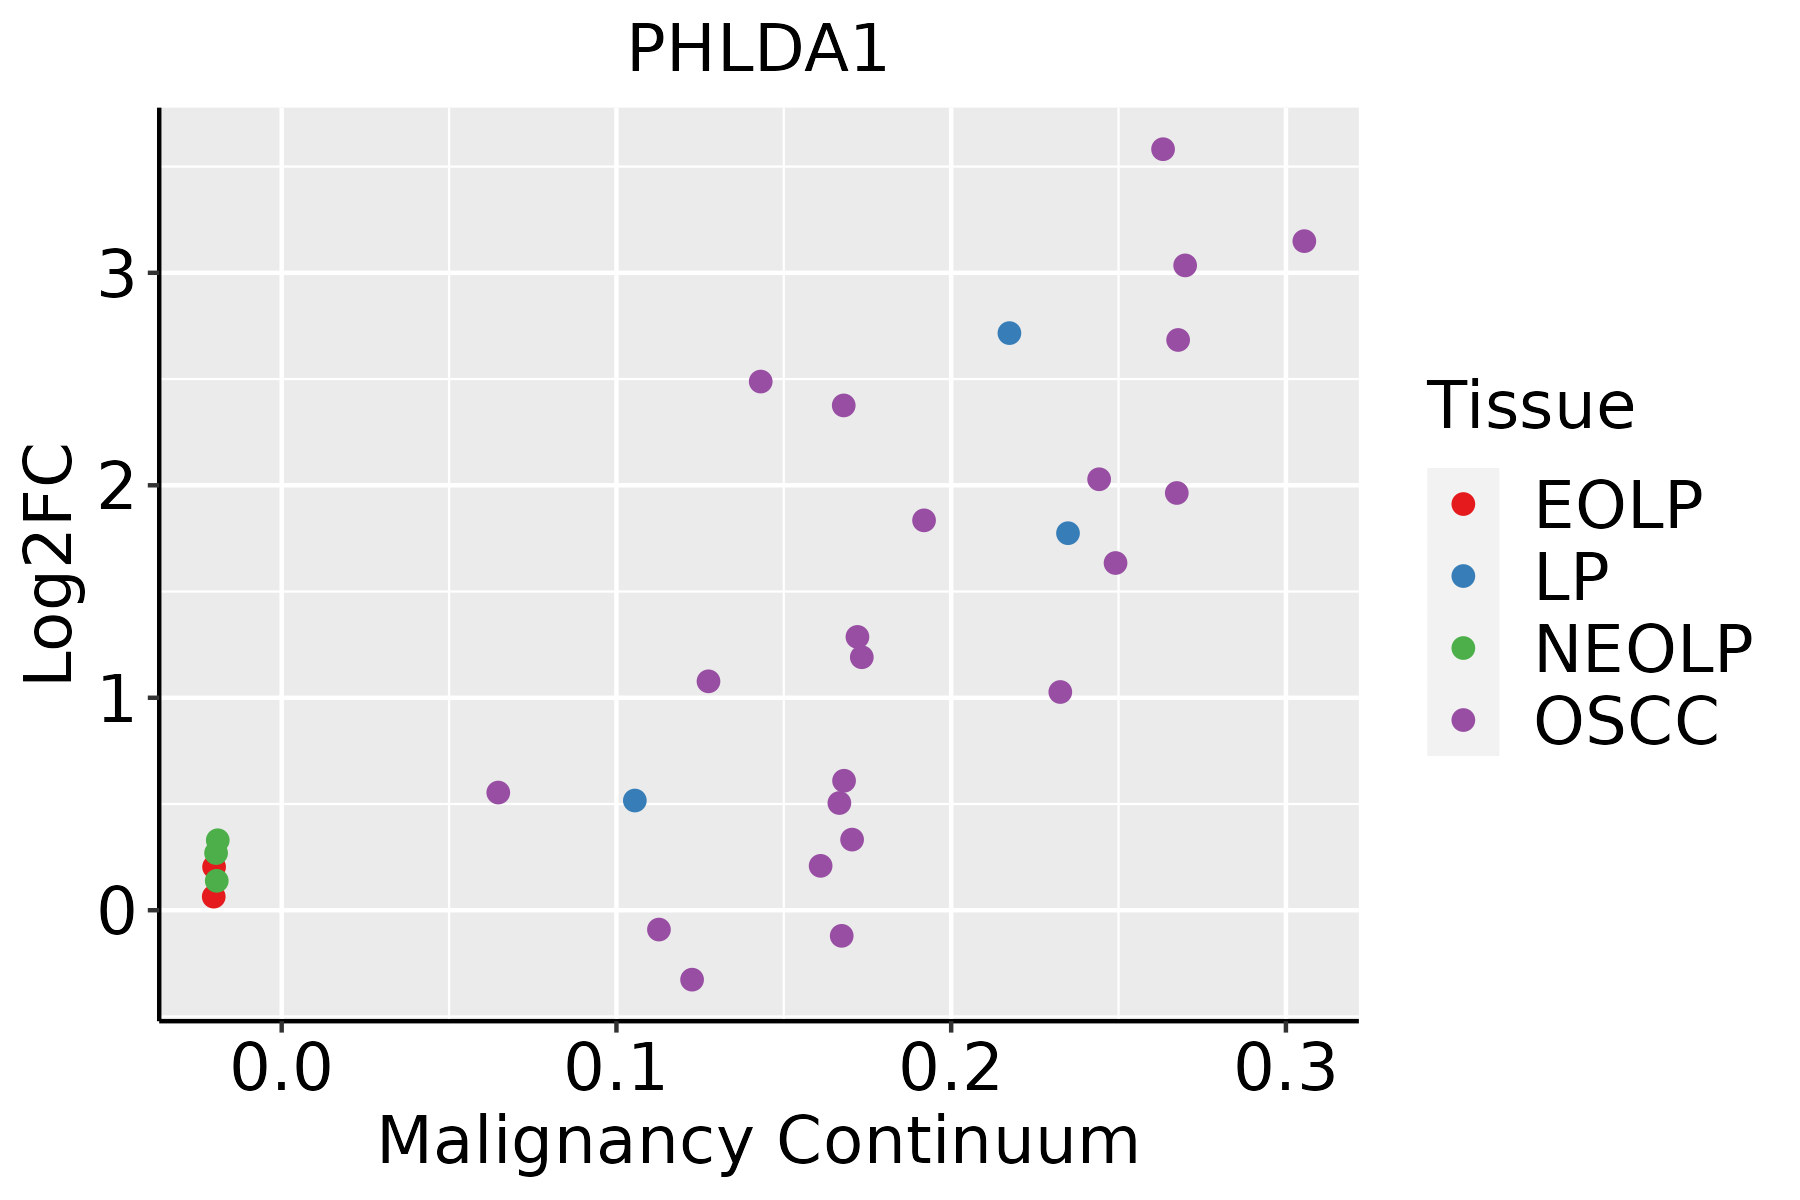 | EOLP: Erosive Oral lichen planus |
| LP: leukoplakia | ||
| NEOLP: Non-erosive oral lichen planus | ||
| OSCC: Oral squamous cell carcinoma | ||
| Prostate |  | BPH: Benign Prostatic Hyperplasia |
| Skin | 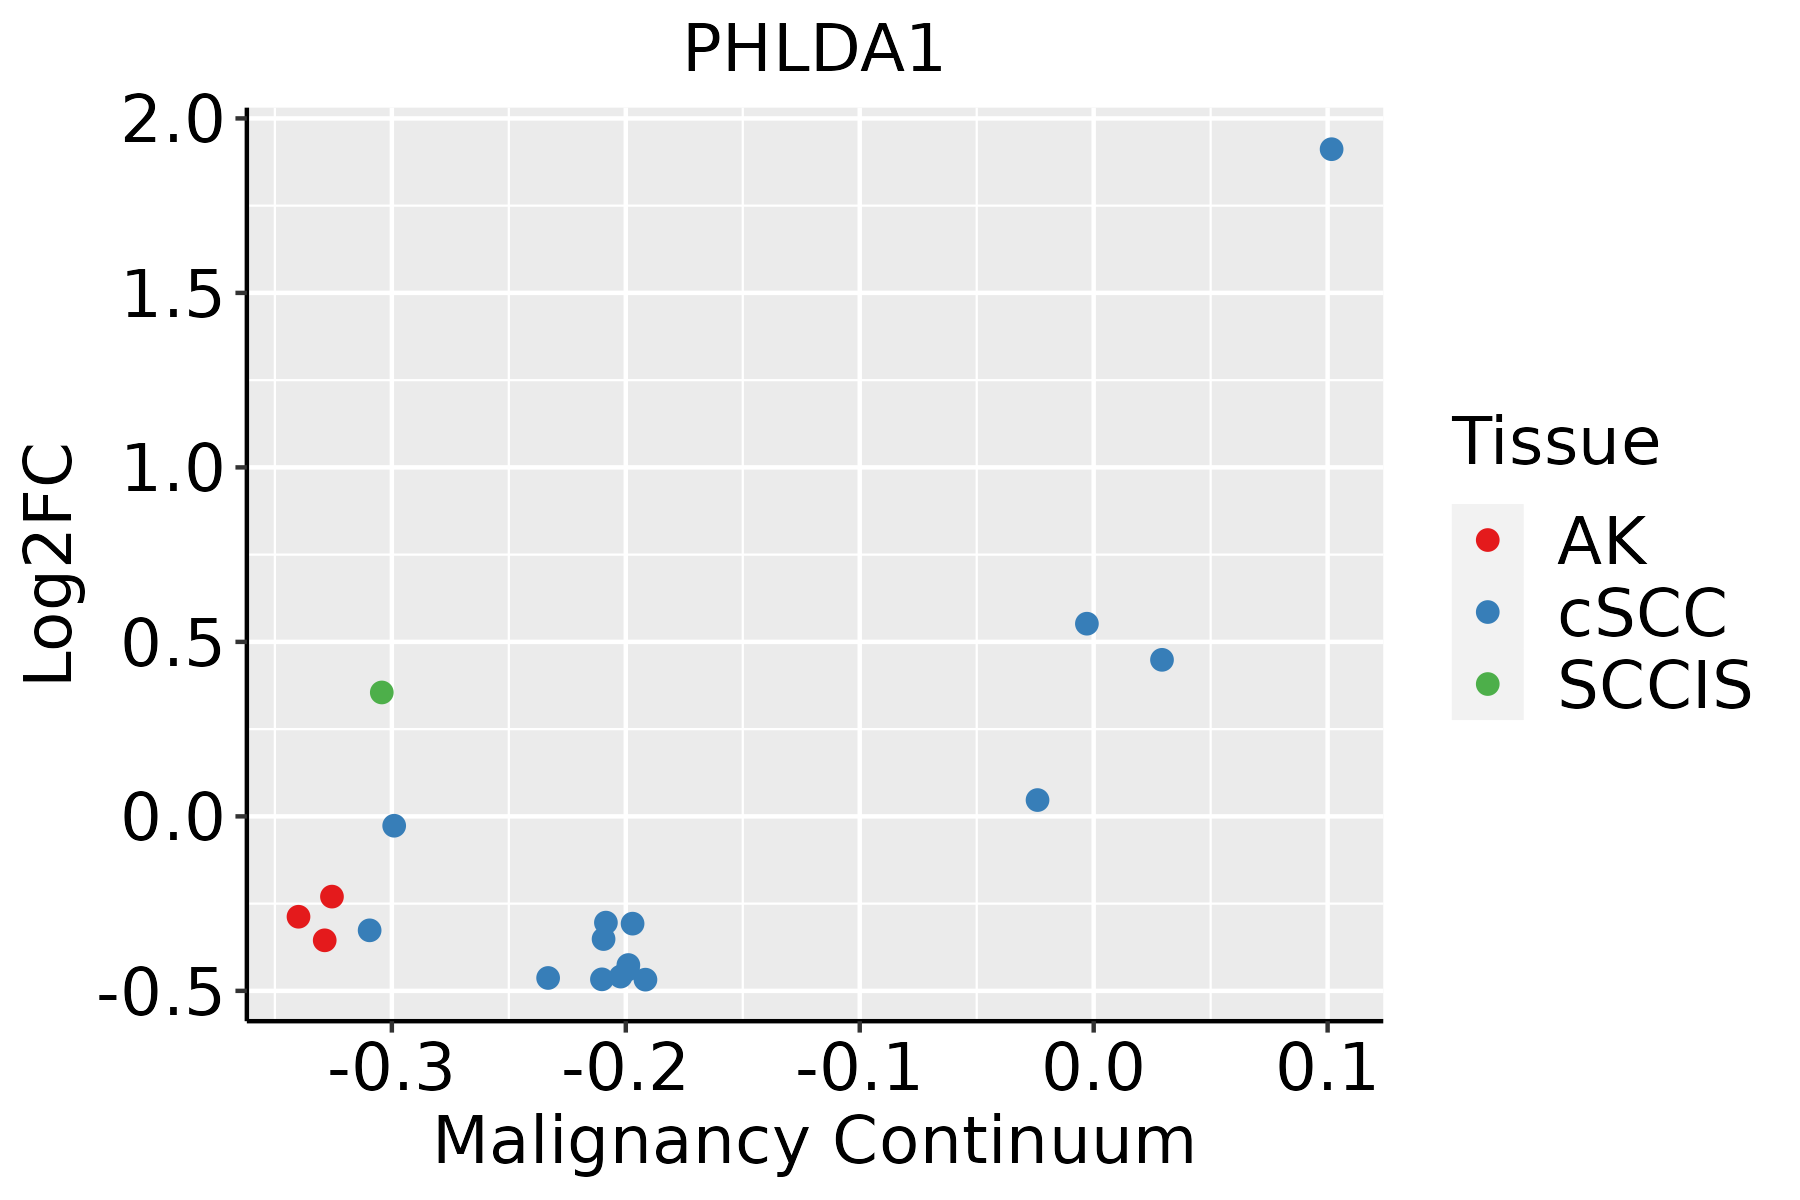 | AK: Actinic keratosis |
| cSCC: Cutaneous squamous cell carcinoma | ||
| SCCIS:squamous cell carcinoma in situ | ||
| Thyroid | 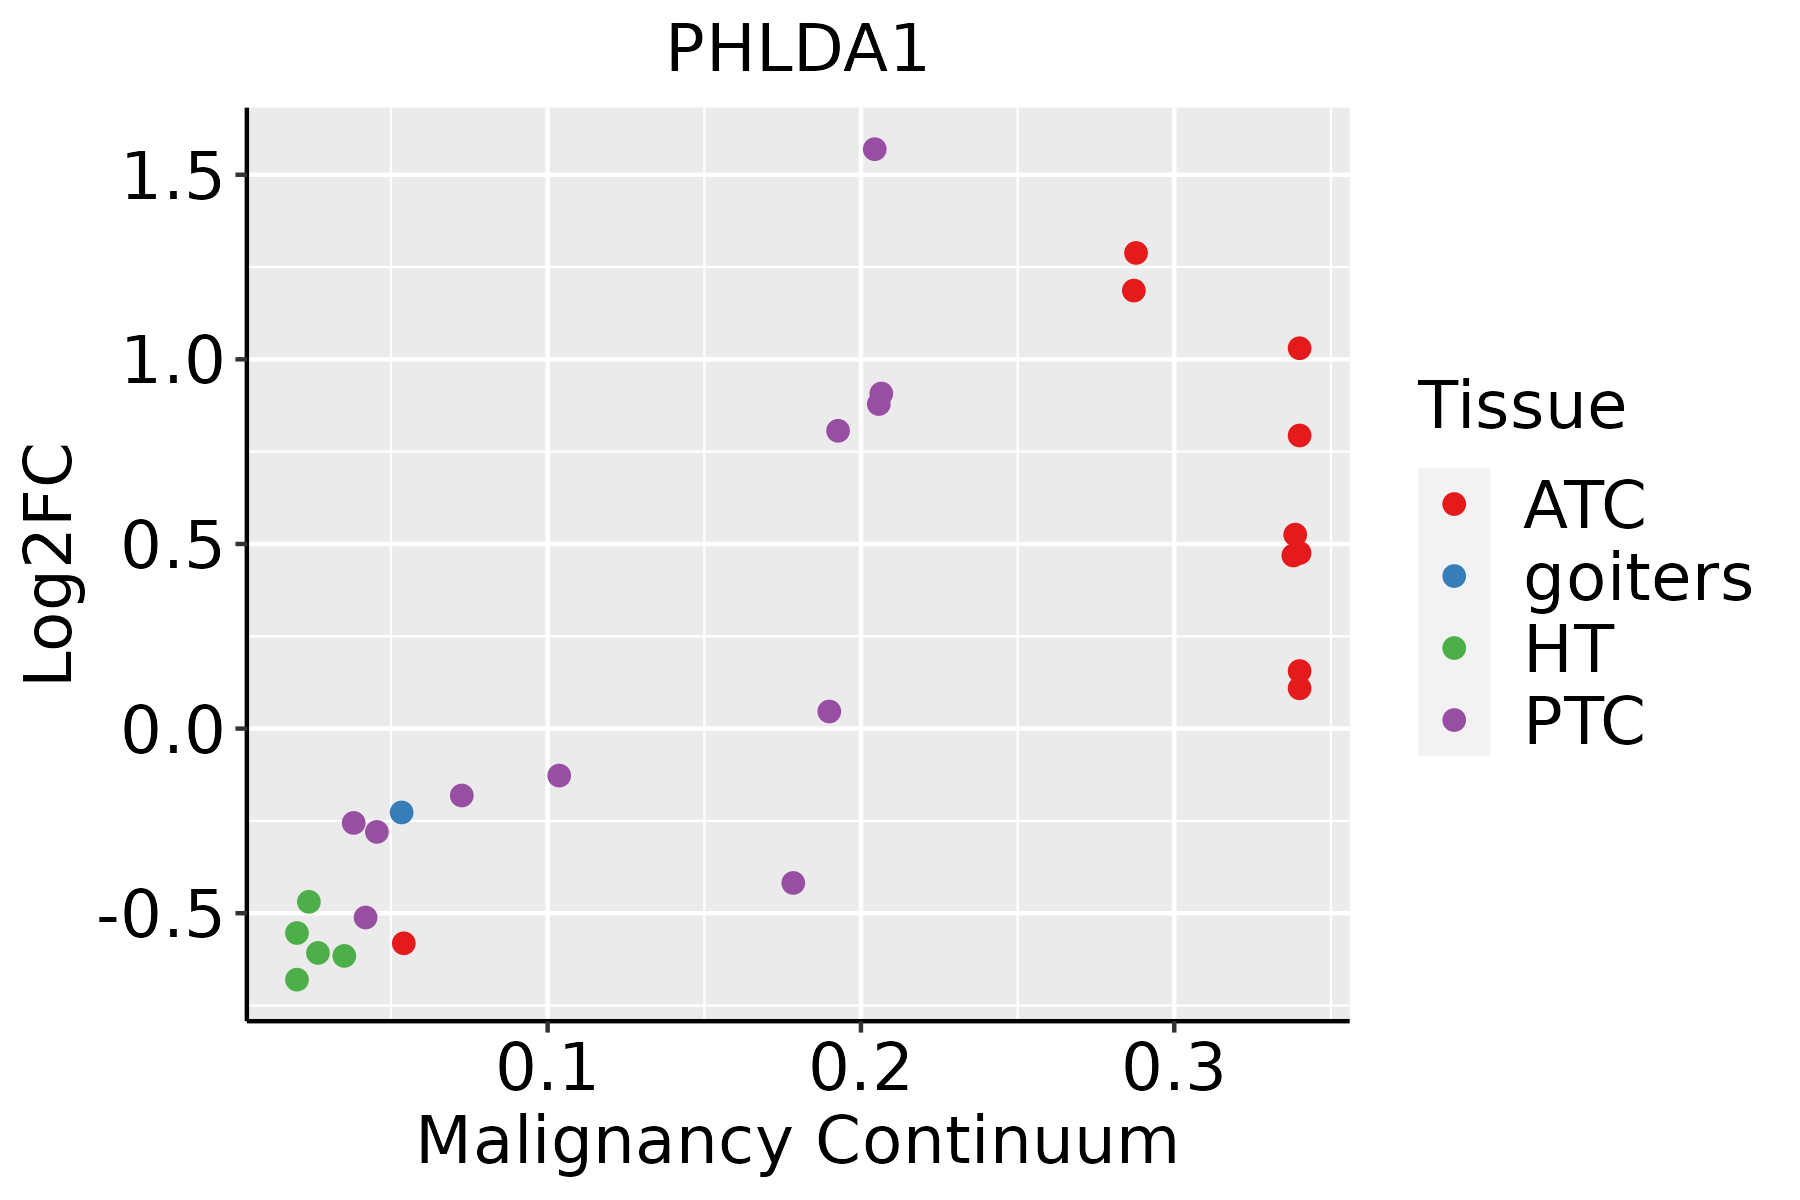 | ATC: Anaplastic thyroid cancer |
| HT: Hashimoto's thyroiditis | ||
| PTC: Papillary thyroid cancer |
| ∗log2FC in expression of this searched gene in stem-like cells from each diseased tissue sample relative to stem-like cells in normal samples in each tissue plotted against the malignancy continuum. Samples are colored based on if they are from different disease stage. |
Top |
Malignant transformation related pathway analysis |
| Find out the enriched GO biological processes and KEGG pathways involved in transition from healthy to precancer to cancer |
| Tissue | Disease Stage | Enriched GO biological Processes |
| Colorectum | AD |  |
| Colorectum | SER |  |
| Colorectum | MSS |  |
| Colorectum | MSI-H |  |
| Colorectum | FAP |  |
| ∗Top 15 enriched GO BP terms are showed in the bar plot of each disease state in each tissue. Each row represents a significant GO biological process which is colored according to the -log10(p.adjust). |
| Page: 1 2 3 4 5 6 7 8 9 |
| GO ID | Tissue | Disease Stage | Description | Gene Ratio | Bg Ratio | pvalue | p.adjust | Count |
| GO:00091002 | Esophagus | ESCC | glycoprotein metabolic process | 226/8552 | 387/18723 | 2.64e-07 | 3.94e-06 | 226 |
| GO:00091012 | Esophagus | ESCC | glycoprotein biosynthetic process | 181/8552 | 317/18723 | 2.54e-05 | 2.15e-04 | 181 |
| GO:0009100 | Liver | HCC | glycoprotein metabolic process | 193/7958 | 387/18723 | 1.89e-03 | 9.62e-03 | 193 |
| GO:00091001 | Oral cavity | OSCC | glycoprotein metabolic process | 185/7305 | 387/18723 | 2.37e-04 | 1.54e-03 | 185 |
| GO:00091011 | Oral cavity | OSCC | glycoprotein biosynthetic process | 151/7305 | 317/18723 | 1.01e-03 | 5.26e-03 | 151 |
| GO:00091013 | Thyroid | PTC | glycoprotein biosynthetic process | 123/5968 | 317/18723 | 5.05e-03 | 2.33e-02 | 123 |
| GO:00091003 | Thyroid | PTC | glycoprotein metabolic process | 147/5968 | 387/18723 | 5.87e-03 | 2.64e-02 | 147 |
| GO:000910011 | Thyroid | ATC | glycoprotein metabolic process | 153/6293 | 387/18723 | 7.90e-03 | 3.06e-02 | 153 |
| Page: 1 |
| Pathway ID | Tissue | Disease Stage | Description | Gene Ratio | Bg Ratio | pvalue | p.adjust | qvalue | Count |
| Page: 1 |
Top |
Cell-cell communication analysis |
| Identification of potential cell-cell interactions between two cell types and their ligand-receptor pairs for different disease states |
| Ligand | Receptor | LRpair | Pathway | Tissue | Disease Stage |
| Page: 1 |
Top |
Single-cell gene regulatory network inference analysis |
| Find out the significant the regulons (TFs) and the target genes of each regulon across cell types for different disease states |
| TF | Cell Type | Tissue | Disease Stage | Target Gene | RSS | Regulon Activity |
| ∗The dot plots of a searched regulon are shown for all cell subpopulations in each disease state of each tissue based on the regulon specific score inferred using pySCENIC and by calculating the average expression. |
| Page: 1 |
Top |
Somatic mutation of malignant transformation related genes |
| Annotation of somatic variants for genes involved in malignant transformation |
| Hugo Symbol | Variant Class | Variant Classification | dbSNP RS | HGVSc | HGVSp | HGVSp Short | SWISSPROT | BIOTYPE | SIFT | PolyPhen | Tumor Sample Barcode | Tissue | Histology | Sex | Age | Stage | Therapy Types | Drugs | Outcome |
| PHLDA1 | SNV | Missense_Mutation | c.460N>T | p.Gly154Cys | p.G154C | Q8WV24 | protein_coding | deleterious_low_confidence(0) | probably_damaging(0.964) | TCGA-A8-A08R-01 | Breast | breast invasive carcinoma | Female | <65 | I/II | Unknown | Unknown | SD | |
| PHLDA1 | SNV | Missense_Mutation | c.1168N>C | p.Gly390Arg | p.G390R | Q8WV24 | protein_coding | deleterious_low_confidence(0) | probably_damaging(1) | TCGA-AN-A0FT-01 | Breast | breast invasive carcinoma | Female | <65 | I/II | Unknown | Unknown | SD | |
| PHLDA1 | SNV | Missense_Mutation | c.702C>A | p.Phe234Leu | p.F234L | Q8WV24 | protein_coding | deleterious_low_confidence(0.04) | possibly_damaging(0.519) | TCGA-AN-A0G0-01 | Breast | breast invasive carcinoma | Female | <65 | I/II | Unknown | Unknown | SD | |
| PHLDA1 | SNV | Missense_Mutation | novel | c.412T>G | p.Tyr138Asp | p.Y138D | Q8WV24 | protein_coding | deleterious_low_confidence(0) | possibly_damaging(0.759) | TCGA-BH-A0GY-01 | Breast | breast invasive carcinoma | Female | >=65 | I/II | Chemotherapy | cyotxan | SD |
| PHLDA1 | SNV | Missense_Mutation | novel | c.523N>G | p.Thr175Ala | p.T175A | Q8WV24 | protein_coding | deleterious_low_confidence(0.01) | probably_damaging(0.996) | TCGA-EK-A2IP-01 | Cervix | cervical & endocervical cancer | Female | <65 | I/II | Unknown | Unknown | SD |
| PHLDA1 | SNV | Missense_Mutation | novel | c.691N>A | p.Glu231Lys | p.E231K | Q8WV24 | protein_coding | deleterious_low_confidence(0.01) | possibly_damaging(0.509) | TCGA-UC-A7PG-06 | Cervix | cervical & endocervical cancer | Female | <65 | III/IV | Chemotherapy | cisplatin | PD |
| PHLDA1 | SNV | Missense_Mutation | c.1057N>T | p.His353Tyr | p.H353Y | Q8WV24 | protein_coding | deleterious_low_confidence(0.01) | benign(0.265) | TCGA-A6-5661-01 | Colorectum | colon adenocarcinoma | Female | >=65 | I/II | Unknown | Unknown | SD | |
| PHLDA1 | SNV | Missense_Mutation | c.447N>C | p.Lys149Asn | p.K149N | Q8WV24 | protein_coding | deleterious_low_confidence(0.01) | probably_damaging(0.994) | TCGA-D5-6531-01 | Colorectum | colon adenocarcinoma | Male | >=65 | I/II | Unknown | Unknown | SD | |
| PHLDA1 | SNV | Missense_Mutation | novel | c.788N>G | p.Asp263Gly | p.D263G | Q8WV24 | protein_coding | deleterious_low_confidence(0) | probably_damaging(0.999) | TCGA-AG-A002-01 | Colorectum | rectum adenocarcinoma | Male | <65 | I/II | Unknown | Unknown | SD |
| PHLDA1 | SNV | Missense_Mutation | c.89N>A | p.Val30Asp | p.V30D | Q8WV24 | protein_coding | deleterious_low_confidence(0) | probably_damaging(0.997) | TCGA-F5-6465-01 | Colorectum | rectum adenocarcinoma | Female | <65 | I/II | Unknown | Unknown | SD |
| Page: 1 2 3 4 |
Top |
Related drugs of malignant transformation related genes |
| Identification of chemicals and drugs interact with genes involved in malignant transfromation |
| (DGIdb 4.0) |
| Entrez ID | Symbol | Category | Interaction Types | Drug Claim Name | Drug Name | PMIDs |
| Page: 1 |

Copyright 2023-Present -The University of Texas Health Science Center at Houston |