
|
|||||
|
 | |
| |
| |
| |
| |
| |
|
Gene: PHKG1 |
Gene summary for PHKG1 |
| Gene information | Species | Human | Gene symbol | PHKG1 | Gene ID | 5260 |
| Gene name | phosphorylase kinase catalytic subunit gamma 1 | |
| Gene Alias | PHKG | |
| Cytomap | 7p11.2 | |
| Gene Type | protein-coding | GO ID | GO:0000271 | UniProtAcc | Q16816 |
Top |
Malignant transformation analysis |
| Identification of the aberrant gene expression in precancerous and cancerous lesions by comparing the gene expression of stem-like cells in diseased tissues with normal stem cells |
| Entrez ID | Symbol | Replicates | Species | Organ | Tissue | Adj P-value | Log2FC | Malignancy |
| 5260 | PHKG1 | S43 | Human | Liver | Cirrhotic | 2.49e-02 | -1.80e-01 | -0.0187 |
| 5260 | PHKG1 | HCC1_Meng | Human | Liver | HCC | 1.98e-37 | -1.30e-01 | 0.0246 |
| 5260 | PHKG1 | HCC2_Meng | Human | Liver | HCC | 1.87e-15 | 6.67e-02 | 0.0107 |
| 5260 | PHKG1 | cirrhotic3 | Human | Liver | Cirrhotic | 8.76e-07 | 1.27e-01 | 0.0215 |
| 5260 | PHKG1 | HCC2 | Human | Liver | HCC | 3.39e-04 | 8.64e-01 | 0.5341 |
| 5260 | PHKG1 | HCC5 | Human | Liver | HCC | 2.47e-07 | 8.97e-01 | 0.4932 |
| 5260 | PHKG1 | Pt13.a | Human | Liver | HCC | 5.85e-03 | -2.29e-01 | 0.021 |
| 5260 | PHKG1 | Pt13.b | Human | Liver | HCC | 3.02e-03 | -2.21e-01 | 0.0251 |
| 5260 | PHKG1 | Pt13.c | Human | Liver | HCC | 1.61e-02 | -2.32e-01 | 0.0076 |
| 5260 | PHKG1 | Pt14.d | Human | Liver | HCC | 1.02e-04 | -2.32e-01 | 0.0143 |
| 5260 | PHKG1 | S014 | Human | Liver | HCC | 1.34e-03 | -2.32e-01 | 0.2254 |
| 5260 | PHKG1 | S016 | Human | Liver | HCC | 4.11e-03 | -2.20e-01 | 0.2243 |
| 5260 | PHKG1 | C30 | Human | Oral cavity | OSCC | 8.85e-07 | 7.31e-01 | 0.3055 |
| 5260 | PHKG1 | C43 | Human | Oral cavity | OSCC | 2.78e-02 | 3.07e-02 | 0.1704 |
| 5260 | PHKG1 | LP15 | Human | Oral cavity | LP | 9.69e-05 | 8.79e-01 | 0.2174 |
| 5260 | PHKG1 | Pat02-B | Human | Stomach | GC | 1.91e-10 | 2.15e-01 | 0.0368 |
| 5260 | PHKG1 | Pat03-B | Human | Stomach | GC | 1.35e-14 | 3.00e-01 | 0.3693 |
| 5260 | PHKG1 | Pat06-B | Human | Stomach | GC | 1.44e-03 | 1.27e-01 | -0.1961 |
| 5260 | PHKG1 | Pat07-B | Human | Stomach | GC | 4.18e-11 | 6.46e-01 | 0.0935 |
| 5260 | PHKG1 | Pat08-B | Human | Stomach | GC | 5.02e-11 | 5.37e-01 | 0.0182 |
| Page: 1 2 |
| Tissue | Expression Dynamics | Abbreviation |
| GC |  | CAG: Chronic atrophic gastritis |
| CAG with IM: Chronic atrophic gastritis with intestinal metaplasia | ||
| CSG: Chronic superficial gastritis | ||
| GC: Gastric cancer | ||
| SIM: Severe intestinal metaplasia | ||
| WIM: Wild intestinal metaplasia | ||
| Liver | 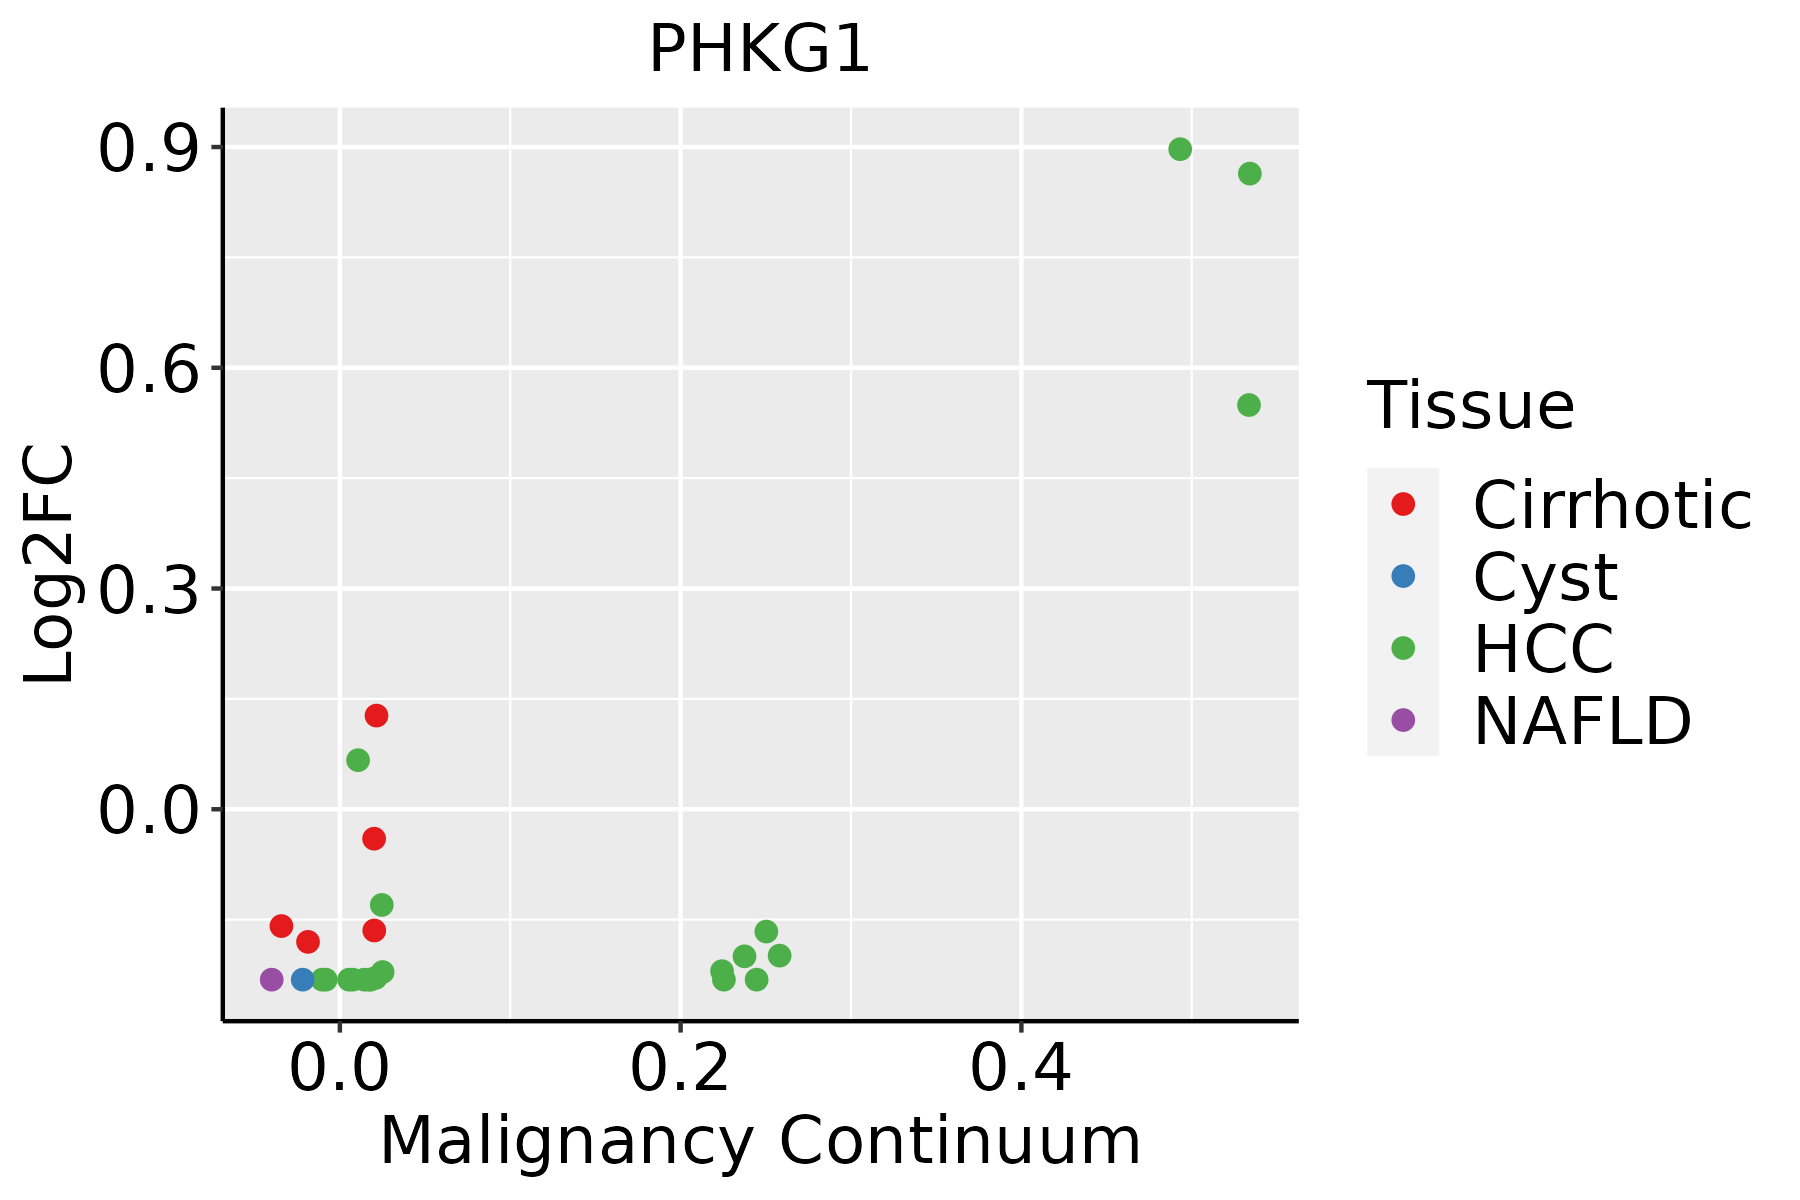 | HCC: Hepatocellular carcinoma |
| NAFLD: Non-alcoholic fatty liver disease | ||
| Oral Cavity |  | EOLP: Erosive Oral lichen planus |
| LP: leukoplakia | ||
| NEOLP: Non-erosive oral lichen planus | ||
| OSCC: Oral squamous cell carcinoma |
| ∗log2FC in expression of this searched gene in stem-like cells from each diseased tissue sample relative to stem-like cells in normal samples in each tissue plotted against the malignancy continuum. Samples are colored based on if they are from different disease stage. |
Top |
Malignant transformation related pathway analysis |
| Find out the enriched GO biological processes and KEGG pathways involved in transition from healthy to precancer to cancer |
| Tissue | Disease Stage | Enriched GO biological Processes |
| Colorectum | AD |  |
| Colorectum | SER |  |
| Colorectum | MSS |  |
| Colorectum | MSI-H |  |
| Colorectum | FAP |  |
| ∗Top 15 enriched GO BP terms are showed in the bar plot of each disease state in each tissue. Each row represents a significant GO biological process which is colored according to the -log10(p.adjust). |
| Page: 1 2 3 4 5 6 7 8 9 |
| GO ID | Tissue | Disease Stage | Description | Gene Ratio | Bg Ratio | pvalue | p.adjust | Count |
| GO:000609112 | Liver | Cirrhotic | generation of precursor metabolites and energy | 238/4634 | 490/18723 | 6.85e-31 | 1.07e-27 | 238 |
| GO:001598012 | Liver | Cirrhotic | energy derivation by oxidation of organic compounds | 154/4634 | 318/18723 | 3.11e-20 | 8.87e-18 | 154 |
| GO:004426211 | Liver | Cirrhotic | cellular carbohydrate metabolic process | 97/4634 | 283/18723 | 1.89e-04 | 1.76e-03 | 97 |
| GO:00160511 | Liver | Cirrhotic | carbohydrate biosynthetic process | 73/4634 | 202/18723 | 1.91e-04 | 1.77e-03 | 73 |
| GO:00059771 | Liver | Cirrhotic | glycogen metabolic process | 30/4634 | 72/18723 | 1.18e-03 | 7.98e-03 | 30 |
| GO:00060731 | Liver | Cirrhotic | cellular glucan metabolic process | 30/4634 | 73/18723 | 1.53e-03 | 9.99e-03 | 30 |
| GO:00440421 | Liver | Cirrhotic | glucan metabolic process | 30/4634 | 73/18723 | 1.53e-03 | 9.99e-03 | 30 |
| GO:00061121 | Liver | Cirrhotic | energy reserve metabolic process | 31/4634 | 84/18723 | 8.75e-03 | 4.04e-02 | 31 |
| GO:000609122 | Liver | HCC | generation of precursor metabolites and energy | 340/7958 | 490/18723 | 4.04e-34 | 2.85e-31 | 340 |
| GO:001598022 | Liver | HCC | energy derivation by oxidation of organic compounds | 221/7958 | 318/18723 | 1.02e-22 | 1.86e-20 | 221 |
| GO:004426221 | Liver | HCC | cellular carbohydrate metabolic process | 153/7958 | 283/18723 | 5.27e-05 | 5.00e-04 | 153 |
| GO:00160512 | Liver | HCC | carbohydrate biosynthetic process | 113/7958 | 202/18723 | 7.64e-05 | 6.83e-04 | 113 |
| GO:00059772 | Liver | HCC | glycogen metabolic process | 46/7958 | 72/18723 | 2.02e-04 | 1.56e-03 | 46 |
| GO:00060732 | Liver | HCC | cellular glucan metabolic process | 46/7958 | 73/18723 | 3.23e-04 | 2.28e-03 | 46 |
| GO:00440422 | Liver | HCC | glucan metabolic process | 46/7958 | 73/18723 | 3.23e-04 | 2.28e-03 | 46 |
| GO:00059781 | Liver | HCC | glycogen biosynthetic process | 29/7958 | 44/18723 | 1.46e-03 | 7.75e-03 | 29 |
| GO:00092501 | Liver | HCC | glucan biosynthetic process | 29/7958 | 44/18723 | 1.46e-03 | 7.75e-03 | 29 |
| GO:00061122 | Liver | HCC | energy reserve metabolic process | 49/7958 | 84/18723 | 2.46e-03 | 1.19e-02 | 49 |
| GO:00346371 | Liver | HCC | cellular carbohydrate biosynthetic process | 44/7958 | 78/18723 | 9.13e-03 | 3.51e-02 | 44 |
| GO:00442641 | Liver | HCC | cellular polysaccharide metabolic process | 52/7958 | 96/18723 | 1.38e-02 | 4.91e-02 | 52 |
| Page: 1 2 |
| Pathway ID | Tissue | Disease Stage | Description | Gene Ratio | Bg Ratio | pvalue | p.adjust | qvalue | Count |
| hsa0491021 | Liver | Cirrhotic | Insulin signaling pathway | 56/2530 | 137/8465 | 3.74e-03 | 1.50e-02 | 9.26e-03 | 56 |
| hsa0492221 | Liver | Cirrhotic | Glucagon signaling pathway | 43/2530 | 107/8465 | 1.42e-02 | 4.35e-02 | 2.68e-02 | 43 |
| hsa0491031 | Liver | Cirrhotic | Insulin signaling pathway | 56/2530 | 137/8465 | 3.74e-03 | 1.50e-02 | 9.26e-03 | 56 |
| hsa0492231 | Liver | Cirrhotic | Glucagon signaling pathway | 43/2530 | 107/8465 | 1.42e-02 | 4.35e-02 | 2.68e-02 | 43 |
| hsa0491041 | Liver | HCC | Insulin signaling pathway | 95/4020 | 137/8465 | 1.53e-07 | 1.97e-06 | 1.10e-06 | 95 |
| hsa0492241 | Liver | HCC | Glucagon signaling pathway | 64/4020 | 107/8465 | 6.70e-03 | 1.87e-02 | 1.04e-02 | 64 |
| hsa0491051 | Liver | HCC | Insulin signaling pathway | 95/4020 | 137/8465 | 1.53e-07 | 1.97e-06 | 1.10e-06 | 95 |
| hsa0492251 | Liver | HCC | Glucagon signaling pathway | 64/4020 | 107/8465 | 6.70e-03 | 1.87e-02 | 1.04e-02 | 64 |
| hsa049108 | Oral cavity | OSCC | Insulin signaling pathway | 83/3704 | 137/8465 | 4.83e-05 | 2.00e-04 | 1.02e-04 | 83 |
| hsa0491013 | Oral cavity | OSCC | Insulin signaling pathway | 83/3704 | 137/8465 | 4.83e-05 | 2.00e-04 | 1.02e-04 | 83 |
| Page: 1 |
Top |
Cell-cell communication analysis |
| Identification of potential cell-cell interactions between two cell types and their ligand-receptor pairs for different disease states |
| Ligand | Receptor | LRpair | Pathway | Tissue | Disease Stage |
| Page: 1 |
Top |
Single-cell gene regulatory network inference analysis |
| Find out the significant the regulons (TFs) and the target genes of each regulon across cell types for different disease states |
| TF | Cell Type | Tissue | Disease Stage | Target Gene | RSS | Regulon Activity |
| ∗The dot plots of a searched regulon are shown for all cell subpopulations in each disease state of each tissue based on the regulon specific score inferred using pySCENIC and by calculating the average expression. |
| Page: 1 |
Top |
Somatic mutation of malignant transformation related genes |
| Annotation of somatic variants for genes involved in malignant transformation |
| Hugo Symbol | Variant Class | Variant Classification | dbSNP RS | HGVSc | HGVSp | HGVSp Short | SWISSPROT | BIOTYPE | SIFT | PolyPhen | Tumor Sample Barcode | Tissue | Histology | Sex | Age | Stage | Therapy Types | Drugs | Outcome |
| PHKG1 | SNV | Missense_Mutation | novel | c.315N>A | p.Asp105Glu | p.D105E | Q16816 | protein_coding | tolerated(1) | benign(0.007) | TCGA-A8-A09A-01 | Breast | breast invasive carcinoma | Female | <65 | I/II | Hormone Therapy | tamoxiphen | SD |
| PHKG1 | SNV | Missense_Mutation | novel | c.611N>T | p.Ser204Phe | p.S204F | Q16816 | protein_coding | deleterious(0) | probably_damaging(0.926) | TCGA-VS-A953-01 | Cervix | cervical & endocervical cancer | Female | <65 | I/II | Unknown | Unknown | PD |
| PHKG1 | SNV | Missense_Mutation | rs375841179 | c.1228G>A | p.Val410Met | p.V410M | Q16816 | protein_coding | tolerated(0.12) | benign(0.024) | TCGA-A6-6653-01 | Colorectum | colon adenocarcinoma | Male | >=65 | I/II | Unknown | Unknown | SD |
| PHKG1 | SNV | Missense_Mutation | c.1226N>T | p.Ala409Val | p.A409V | Q16816 | protein_coding | tolerated(0.2) | benign(0.013) | TCGA-AD-5900-01 | Colorectum | colon adenocarcinoma | Male | >=65 | I/II | Unknown | Unknown | SD | |
| PHKG1 | SNV | Missense_Mutation | c.848N>T | p.Ser283Leu | p.S283L | Q16816 | protein_coding | deleterious(0) | probably_damaging(0.994) | TCGA-CK-5913-01 | Colorectum | colon adenocarcinoma | Female | <65 | I/II | Unknown | Unknown | SD | |
| PHKG1 | SNV | Missense_Mutation | rs751207978 | c.236G>A | p.Arg79His | p.R79H | Q16816 | protein_coding | tolerated(0.07) | benign(0.029) | TCGA-F4-6570-01 | Colorectum | colon adenocarcinoma | Female | >=65 | I/II | Unknown | Unknown | SD |
| PHKG1 | SNV | Missense_Mutation | rs765359269 | c.1126C>T | p.Arg376Cys | p.R376C | Q16816 | protein_coding | deleterious(0.01) | possibly_damaging(0.853) | TCGA-NH-A5IV-01 | Colorectum | colon adenocarcinoma | Female | >=65 | I/II | Unknown | Unknown | SD |
| PHKG1 | SNV | Missense_Mutation | rs763494578 | c.1118G>A | p.Arg373Gln | p.R373Q | Q16816 | protein_coding | deleterious(0.01) | possibly_damaging(0.69) | TCGA-WS-AB45-01 | Colorectum | colon adenocarcinoma | Female | <65 | I/II | Unknown | Unknown | SD |
| PHKG1 | SNV | Missense_Mutation | novel | c.519G>T | p.Leu173Phe | p.L173F | Q16816 | protein_coding | deleterious(0.02) | possibly_damaging(0.835) | TCGA-A5-A0G2-01 | Endometrium | uterine corpus endometrioid carcinoma | Female | <65 | III/IV | Unknown | Unknown | SD |
| PHKG1 | SNV | Missense_Mutation | novel | c.991N>G | p.Phe331Val | p.F331V | Q16816 | protein_coding | deleterious(0.01) | benign(0.367) | TCGA-AJ-A3EL-01 | Endometrium | uterine corpus endometrioid carcinoma | Female | <65 | I/II | Unknown | Unknown | SD |
| Page: 1 2 3 4 5 |
Top |
Related drugs of malignant transformation related genes |
| Identification of chemicals and drugs interact with genes involved in malignant transfromation |
| (DGIdb 4.0) |
| Entrez ID | Symbol | Category | Interaction Types | Drug Claim Name | Drug Name | PMIDs |
| 5260 | PHKG1 | DRUGGABLE GENOME, KINASE, SERINE THREONINE KINASE, ENZYME | inhibitor | 249565884 | A-443654 |
| Page: 1 |

Copyright 2023-Present -The University of Texas Health Science Center at Houston |