
|
|||||
|
 | |
| |
| |
| |
| |
| |
|
Gene: PHF8 |
Gene summary for PHF8 |
| Gene information | Species | Human | Gene symbol | PHF8 | Gene ID | 23133 |
| Gene name | PHD finger protein 8 | |
| Gene Alias | JHDM1F | |
| Cytomap | Xp11.22 | |
| Gene Type | protein-coding | GO ID | GO:0000082 | UniProtAcc | Q9UPP1 |
Top |
Malignant transformation analysis |
| Identification of the aberrant gene expression in precancerous and cancerous lesions by comparing the gene expression of stem-like cells in diseased tissues with normal stem cells |
| Entrez ID | Symbol | Replicates | Species | Organ | Tissue | Adj P-value | Log2FC | Malignancy |
| 23133 | PHF8 | LZE4T | Human | Esophagus | ESCC | 2.63e-02 | 4.92e-02 | 0.0811 |
| 23133 | PHF8 | LZE7T | Human | Esophagus | ESCC | 3.34e-03 | 3.43e-01 | 0.0667 |
| 23133 | PHF8 | LZE8T | Human | Esophagus | ESCC | 7.46e-03 | 9.55e-02 | 0.067 |
| 23133 | PHF8 | LZE24T | Human | Esophagus | ESCC | 5.69e-16 | 4.52e-01 | 0.0596 |
| 23133 | PHF8 | LZE21T | Human | Esophagus | ESCC | 2.71e-02 | 2.94e-01 | 0.0655 |
| 23133 | PHF8 | P1T-E | Human | Esophagus | ESCC | 1.60e-03 | 1.32e-01 | 0.0875 |
| 23133 | PHF8 | P2T-E | Human | Esophagus | ESCC | 3.34e-12 | 2.06e-01 | 0.1177 |
| 23133 | PHF8 | P4T-E | Human | Esophagus | ESCC | 3.63e-11 | 2.14e-01 | 0.1323 |
| 23133 | PHF8 | P5T-E | Human | Esophagus | ESCC | 9.70e-07 | 2.87e-02 | 0.1327 |
| 23133 | PHF8 | P8T-E | Human | Esophagus | ESCC | 9.76e-23 | 3.26e-01 | 0.0889 |
| 23133 | PHF8 | P9T-E | Human | Esophagus | ESCC | 5.30e-06 | 9.75e-02 | 0.1131 |
| 23133 | PHF8 | P10T-E | Human | Esophagus | ESCC | 3.41e-03 | 3.11e-02 | 0.116 |
| 23133 | PHF8 | P11T-E | Human | Esophagus | ESCC | 3.57e-05 | 1.65e-01 | 0.1426 |
| 23133 | PHF8 | P12T-E | Human | Esophagus | ESCC | 8.49e-13 | 3.32e-01 | 0.1122 |
| 23133 | PHF8 | P15T-E | Human | Esophagus | ESCC | 6.64e-09 | 2.07e-01 | 0.1149 |
| 23133 | PHF8 | P16T-E | Human | Esophagus | ESCC | 8.53e-18 | 2.04e-01 | 0.1153 |
| 23133 | PHF8 | P20T-E | Human | Esophagus | ESCC | 2.67e-07 | 1.84e-01 | 0.1124 |
| 23133 | PHF8 | P21T-E | Human | Esophagus | ESCC | 2.50e-07 | 4.45e-02 | 0.1617 |
| 23133 | PHF8 | P22T-E | Human | Esophagus | ESCC | 4.70e-13 | 1.66e-01 | 0.1236 |
| 23133 | PHF8 | P23T-E | Human | Esophagus | ESCC | 1.36e-11 | 3.04e-01 | 0.108 |
| Page: 1 2 3 |
| Tissue | Expression Dynamics | Abbreviation |
| Esophagus | 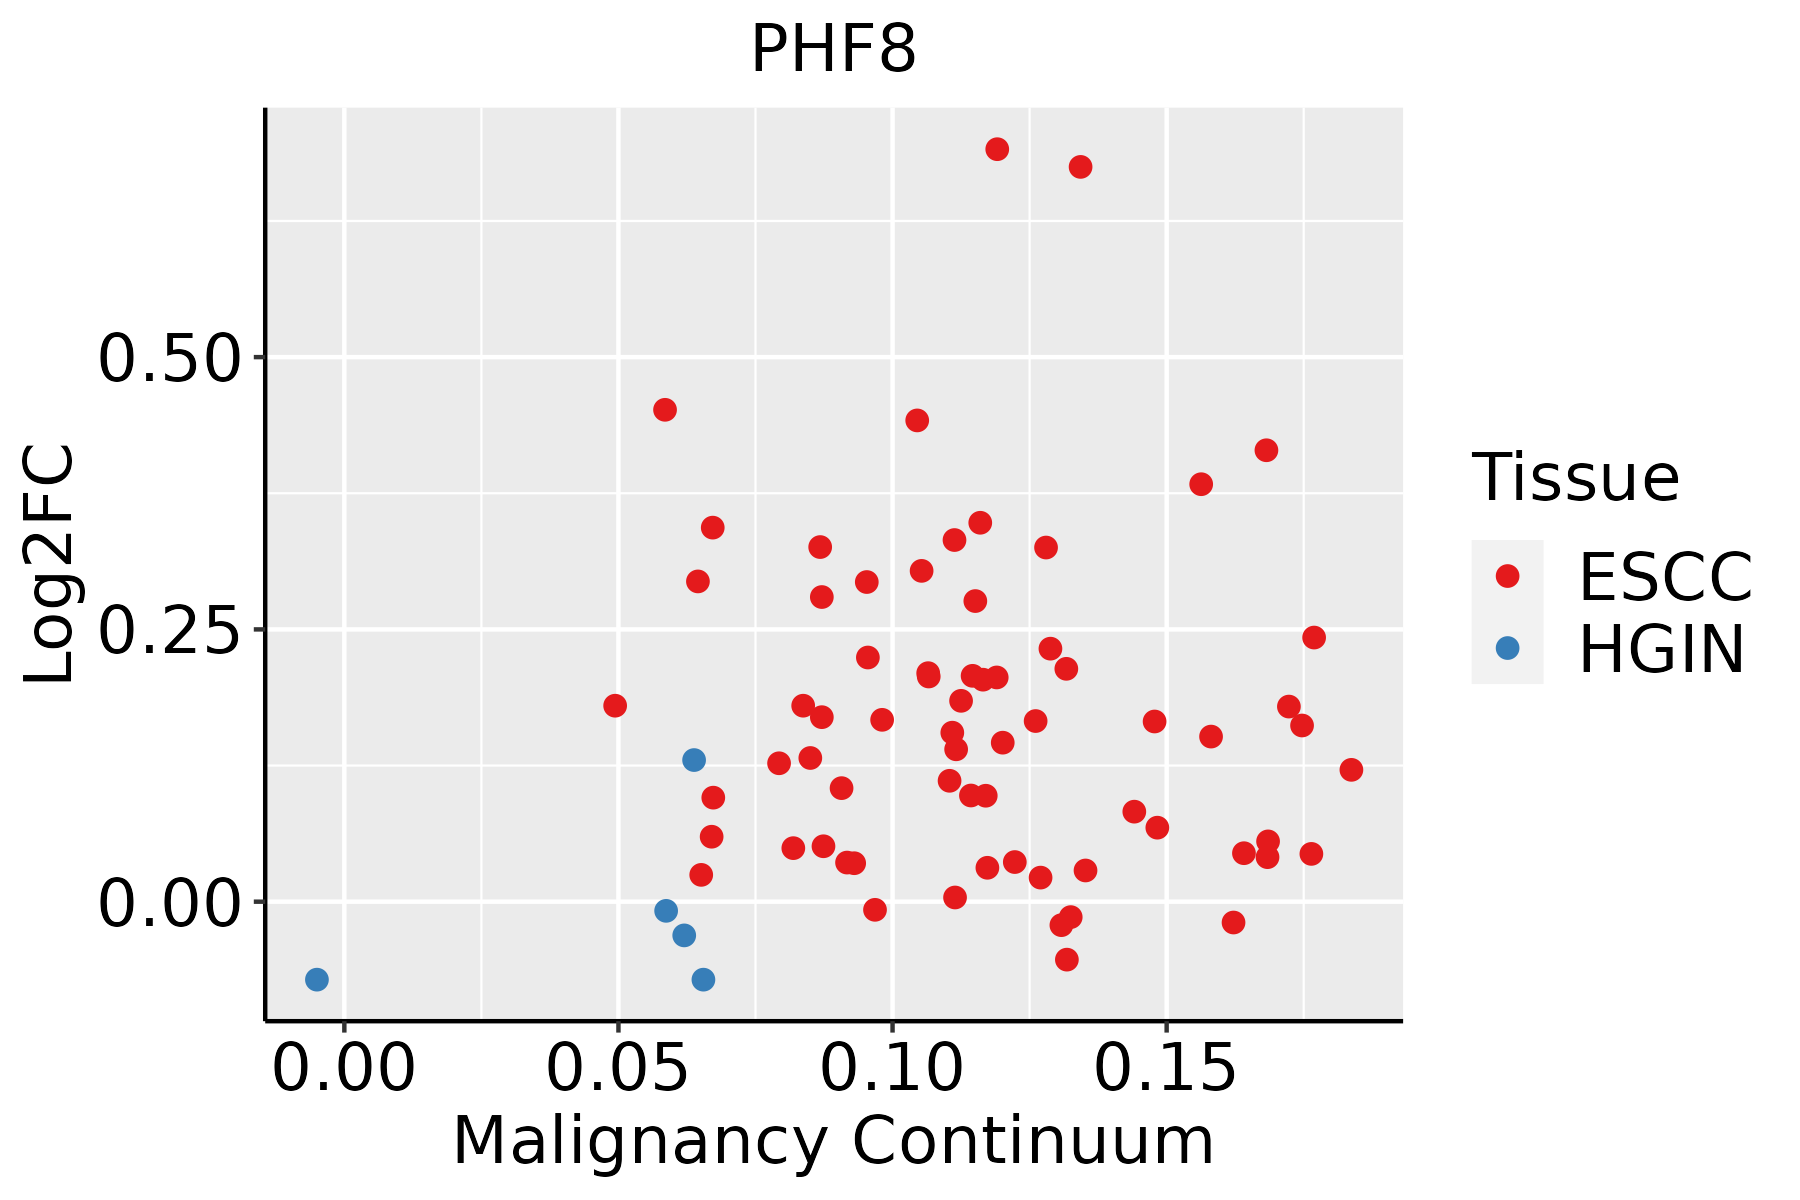 | ESCC: Esophageal squamous cell carcinoma |
| HGIN: High-grade intraepithelial neoplasias | ||
| LGIN: Low-grade intraepithelial neoplasias | ||
| Prostate |  | BPH: Benign Prostatic Hyperplasia |
| ∗log2FC in expression of this searched gene in stem-like cells from each diseased tissue sample relative to stem-like cells in normal samples in each tissue plotted against the malignancy continuum. Samples are colored based on if they are from different disease stage. |
Top |
Malignant transformation related pathway analysis |
| Find out the enriched GO biological processes and KEGG pathways involved in transition from healthy to precancer to cancer |
| Tissue | Disease Stage | Enriched GO biological Processes |
| Colorectum | AD |  |
| Colorectum | SER |  |
| Colorectum | MSS |  |
| Colorectum | MSI-H |  |
| Colorectum | FAP |  |
| ∗Top 15 enriched GO BP terms are showed in the bar plot of each disease state in each tissue. Each row represents a significant GO biological process which is colored according to the -log10(p.adjust). |
| Page: 1 2 3 4 5 6 7 8 9 |
| GO ID | Tissue | Disease Stage | Description | Gene Ratio | Bg Ratio | pvalue | p.adjust | Count |
| GO:001657015 | Esophagus | ESCC | histone modification | 323/8552 | 463/18723 | 2.61e-26 | 7.88e-24 | 323 |
| GO:004477216 | Esophagus | ESCC | mitotic cell cycle phase transition | 281/8552 | 424/18723 | 4.63e-18 | 4.45e-16 | 281 |
| GO:000699713 | Esophagus | ESCC | nucleus organization | 96/8552 | 133/18723 | 4.66e-10 | 1.21e-08 | 96 |
| GO:000632517 | Esophagus | ESCC | chromatin organization | 240/8552 | 409/18723 | 6.52e-08 | 1.14e-06 | 240 |
| GO:00400295 | Esophagus | ESCC | regulation of gene expression, epigenetic | 74/8552 | 105/18723 | 2.24e-07 | 3.42e-06 | 74 |
| GO:000008214 | Esophagus | ESCC | G1/S transition of mitotic cell cycle | 134/8552 | 214/18723 | 4.04e-07 | 5.55e-06 | 134 |
| GO:004484314 | Esophagus | ESCC | cell cycle G1/S phase transition | 148/8552 | 241/18723 | 5.68e-07 | 7.48e-06 | 148 |
| GO:00063602 | Esophagus | ESCC | transcription by RNA polymerase I | 42/8552 | 55/18723 | 3.41e-06 | 3.78e-05 | 42 |
| GO:00063564 | Esophagus | ESCC | regulation of transcription by RNA polymerase I | 27/8552 | 34/18723 | 6.01e-05 | 4.62e-04 | 27 |
| GO:00459432 | Esophagus | ESCC | positive regulation of transcription by RNA polymerase I | 19/8552 | 23/18723 | 3.12e-04 | 1.85e-03 | 19 |
| GO:00064824 | Esophagus | ESCC | protein demethylation | 24/8552 | 33/18723 | 1.50e-03 | 7.06e-03 | 24 |
| GO:00082144 | Esophagus | ESCC | protein dealkylation | 24/8552 | 33/18723 | 1.50e-03 | 7.06e-03 | 24 |
| GO:00708281 | Esophagus | ESCC | heterochromatin organization | 31/8552 | 46/18723 | 2.42e-03 | 1.06e-02 | 31 |
| GO:00165773 | Esophagus | ESCC | histone demethylation | 22/8552 | 31/18723 | 3.90e-03 | 1.58e-02 | 22 |
| GO:00700763 | Esophagus | ESCC | histone lysine demethylation | 20/8552 | 28/18723 | 5.23e-03 | 1.97e-02 | 20 |
| GO:0045814 | Esophagus | ESCC | negative regulation of gene expression, epigenetic | 32/8552 | 50/18723 | 6.90e-03 | 2.52e-02 | 32 |
| GO:00609686 | Esophagus | ESCC | regulation of gene silencing | 48/8552 | 81/18723 | 9.54e-03 | 3.30e-02 | 48 |
| GO:19022751 | Esophagus | ESCC | regulation of chromatin organization | 22/8552 | 33/18723 | 1.22e-02 | 4.08e-02 | 22 |
| GO:00447727 | Prostate | BPH | mitotic cell cycle phase transition | 112/3107 | 424/18723 | 1.57e-07 | 3.58e-06 | 112 |
| GO:00165706 | Prostate | BPH | histone modification | 120/3107 | 463/18723 | 1.73e-07 | 3.89e-06 | 120 |
| Page: 1 2 3 |
| Pathway ID | Tissue | Disease Stage | Description | Gene Ratio | Bg Ratio | pvalue | p.adjust | qvalue | Count |
| Page: 1 |
Top |
Cell-cell communication analysis |
| Identification of potential cell-cell interactions between two cell types and their ligand-receptor pairs for different disease states |
| Ligand | Receptor | LRpair | Pathway | Tissue | Disease Stage |
| Page: 1 |
Top |
Single-cell gene regulatory network inference analysis |
| Find out the significant the regulons (TFs) and the target genes of each regulon across cell types for different disease states |
| TF | Cell Type | Tissue | Disease Stage | Target Gene | RSS | Regulon Activity |
| PHF8 | PERI | Colorectum | CRC | L2HGDH,GRID1,SCRN3, etc. | 1.51e-01 |  |
| PHF8 | VFIB | Colorectum | Healthy | L2HGDH,GRID1,SCRN3, etc. | 1.10e-01 |  |
| PHF8 | MYOFIB | Colorectum | MSS | L2HGDH,GRID1,SCRN3, etc. | 1.68e-01 |  |
| PHF8 | CD8TRM | Esophagus | ESCC | IFI27L1,EAF2,SHISA2, etc. | 5.12e-01 |  |
| PHF8 | NK | Lung | ADJ | KRT86,HIBCH,ABHD3, etc. | 2.29e-01 |  |
| PHF8 | CD4TN | Lung | ADJ | KRT86,HIBCH,ABHD3, etc. | 1.55e-01 | |
| PHF8 | GDT | Lung | ADJ | KRT86,HIBCH,ABHD3, etc. | 1.14e-01 | |
| PHF8 | MAIT | Lung | ADJ | KRT86,HIBCH,ABHD3, etc. | 2.47e-02 | |
| PHF8 | TH17 | Oral cavity | NEOLP | DNAJA4,CSF1,DNAJB1, etc. | 4.29e-02 |  |
| ∗The dot plots of a searched regulon are shown for all cell subpopulations in each disease state of each tissue based on the regulon specific score inferred using pySCENIC and by calculating the average expression. |
| Page: 1 |
Top |
Somatic mutation of malignant transformation related genes |
| Annotation of somatic variants for genes involved in malignant transformation |
| Hugo Symbol | Variant Class | Variant Classification | dbSNP RS | HGVSc | HGVSp | HGVSp Short | SWISSPROT | BIOTYPE | SIFT | PolyPhen | Tumor Sample Barcode | Tissue | Histology | Sex | Age | Stage | Therapy Types | Drugs | Outcome |
| PHF8 | SNV | Missense_Mutation | novel | c.901N>T | p.Ile301Phe | p.I301F | Q9UPP1 | protein_coding | deleterious(0) | probably_damaging(0.926) | TCGA-AC-A23G-01 | Breast | breast invasive carcinoma | Female | >=65 | I/II | Chemotherapy | cytoxan | CR |
| PHF8 | SNV | Missense_Mutation | c.574N>C | p.Glu192Gln | p.E192Q | Q9UPP1 | protein_coding | tolerated(0.51) | benign(0.051) | TCGA-AC-A23H-01 | Breast | breast invasive carcinoma | Female | >=65 | I/II | Unknown | Unknown | PD | |
| PHF8 | SNV | Missense_Mutation | novel | c.2836G>A | p.Asp946Asn | p.D946N | Q9UPP1 | protein_coding | tolerated(0.29) | benign(0.048) | TCGA-AN-A046-01 | Breast | breast invasive carcinoma | Female | >=65 | I/II | Unknown | Unknown | SD |
| PHF8 | SNV | Missense_Mutation | novel | c.2182C>A | p.Leu728Ile | p.L728I | Q9UPP1 | protein_coding | deleterious(0.05) | probably_damaging(0.987) | TCGA-AN-A046-01 | Breast | breast invasive carcinoma | Female | >=65 | I/II | Unknown | Unknown | SD |
| PHF8 | SNV | Missense_Mutation | c.536C>A | p.Thr179Asn | p.T179N | Q9UPP1 | protein_coding | tolerated(0.13) | benign(0.106) | TCGA-AN-A046-01 | Breast | breast invasive carcinoma | Female | >=65 | I/II | Unknown | Unknown | SD | |
| PHF8 | SNV | Missense_Mutation | rs782411309 | c.1942N>C | p.Asp648His | p.D648H | Q9UPP1 | protein_coding | deleterious(0.01) | possibly_damaging(0.831) | TCGA-AN-A0FJ-01 | Breast | breast invasive carcinoma | Female | <65 | III/IV | Unknown | Unknown | SD |
| PHF8 | SNV | Missense_Mutation | c.1645N>A | p.Ala549Thr | p.A549T | Q9UPP1 | protein_coding | tolerated(0.41) | benign(0) | TCGA-AR-A24Q-01 | Breast | breast invasive carcinoma | Female | <65 | I/II | Chemotherapy | doxorubicin | SD | |
| PHF8 | SNV | Missense_Mutation | novel | c.2881A>C | p.Thr961Pro | p.T961P | Q9UPP1 | protein_coding | tolerated(0.4) | benign(0) | TCGA-B6-A0I9-01 | Breast | breast invasive carcinoma | Female | <65 | III/IV | Unknown | Unknown | PD |
| PHF8 | SNV | Missense_Mutation | c.3010N>T | p.Arg1004Cys | p.R1004C | Q9UPP1 | protein_coding | deleterious(0.01) | probably_damaging(0.991) | TCGA-BH-A1EV-01 | Breast | breast invasive carcinoma | Female | <65 | III/IV | Unknown | Unknown | PD | |
| PHF8 | SNV | Missense_Mutation | c.1256G>A | p.Arg419Gln | p.R419Q | Q9UPP1 | protein_coding | deleterious(0.01) | benign(0.065) | TCGA-C8-A1HK-01 | Breast | breast invasive carcinoma | Female | <65 | I/II | Unknown | Unknown | SD |
| Page: 1 2 3 4 5 6 7 8 9 10 11 12 13 14 |
Top |
Related drugs of malignant transformation related genes |
| Identification of chemicals and drugs interact with genes involved in malignant transfromation |
| (DGIdb 4.0) |
| Entrez ID | Symbol | Category | Interaction Types | Drug Claim Name | Drug Name | PMIDs |
| 23133 | PHF8 | ENZYME, DRUGGABLE GENOME | inhibitor | 178103604 |
| Page: 1 |

Copyright 2023-Present -The University of Texas Health Science Center at Houston |