
|
|||||
|
 | |
| |
| |
| |
| |
| |
|
Gene: PHF6 |
Gene summary for PHF6 |
| Gene information | Species | Human | Gene symbol | PHF6 | Gene ID | 84295 |
| Gene name | PHD finger protein 6 | |
| Gene Alias | BFLS | |
| Cytomap | Xq26.2 | |
| Gene Type | protein-coding | GO ID | GO:0000122 | UniProtAcc | Q8IWS0 |
Top |
Malignant transformation analysis |
| Identification of the aberrant gene expression in precancerous and cancerous lesions by comparing the gene expression of stem-like cells in diseased tissues with normal stem cells |
| Entrez ID | Symbol | Replicates | Species | Organ | Tissue | Adj P-value | Log2FC | Malignancy |
| 84295 | PHF6 | LZE2T | Human | Esophagus | ESCC | 1.59e-04 | 6.21e-01 | 0.082 |
| 84295 | PHF6 | LZE4T | Human | Esophagus | ESCC | 3.46e-14 | 2.30e-01 | 0.0811 |
| 84295 | PHF6 | LZE7T | Human | Esophagus | ESCC | 5.49e-11 | 6.42e-01 | 0.0667 |
| 84295 | PHF6 | LZE20T | Human | Esophagus | ESCC | 2.53e-02 | 1.11e-01 | 0.0662 |
| 84295 | PHF6 | LZE22D1 | Human | Esophagus | HGIN | 4.45e-03 | 1.89e-01 | 0.0595 |
| 84295 | PHF6 | LZE24T | Human | Esophagus | ESCC | 3.74e-16 | 4.59e-01 | 0.0596 |
| 84295 | PHF6 | LZE6T | Human | Esophagus | ESCC | 8.16e-09 | 2.65e-01 | 0.0845 |
| 84295 | PHF6 | P1T-E | Human | Esophagus | ESCC | 6.53e-10 | 4.64e-01 | 0.0875 |
| 84295 | PHF6 | P2T-E | Human | Esophagus | ESCC | 4.70e-36 | 7.14e-01 | 0.1177 |
| 84295 | PHF6 | P4T-E | Human | Esophagus | ESCC | 3.98e-24 | 5.64e-01 | 0.1323 |
| 84295 | PHF6 | P5T-E | Human | Esophagus | ESCC | 1.88e-13 | 2.80e-01 | 0.1327 |
| 84295 | PHF6 | P8T-E | Human | Esophagus | ESCC | 7.25e-18 | 3.44e-01 | 0.0889 |
| 84295 | PHF6 | P9T-E | Human | Esophagus | ESCC | 1.29e-15 | 2.65e-01 | 0.1131 |
| 84295 | PHF6 | P10T-E | Human | Esophagus | ESCC | 1.43e-28 | 5.77e-01 | 0.116 |
| 84295 | PHF6 | P11T-E | Human | Esophagus | ESCC | 1.80e-12 | 3.32e-01 | 0.1426 |
| 84295 | PHF6 | P12T-E | Human | Esophagus | ESCC | 2.48e-28 | 4.79e-01 | 0.1122 |
| 84295 | PHF6 | P15T-E | Human | Esophagus | ESCC | 2.42e-10 | 2.64e-01 | 0.1149 |
| 84295 | PHF6 | P16T-E | Human | Esophagus | ESCC | 2.94e-13 | 2.50e-01 | 0.1153 |
| 84295 | PHF6 | P17T-E | Human | Esophagus | ESCC | 4.70e-04 | 3.13e-01 | 0.1278 |
| 84295 | PHF6 | P20T-E | Human | Esophagus | ESCC | 5.35e-14 | 3.60e-01 | 0.1124 |
| Page: 1 2 3 4 5 6 |
| Tissue | Expression Dynamics | Abbreviation |
| Esophagus | 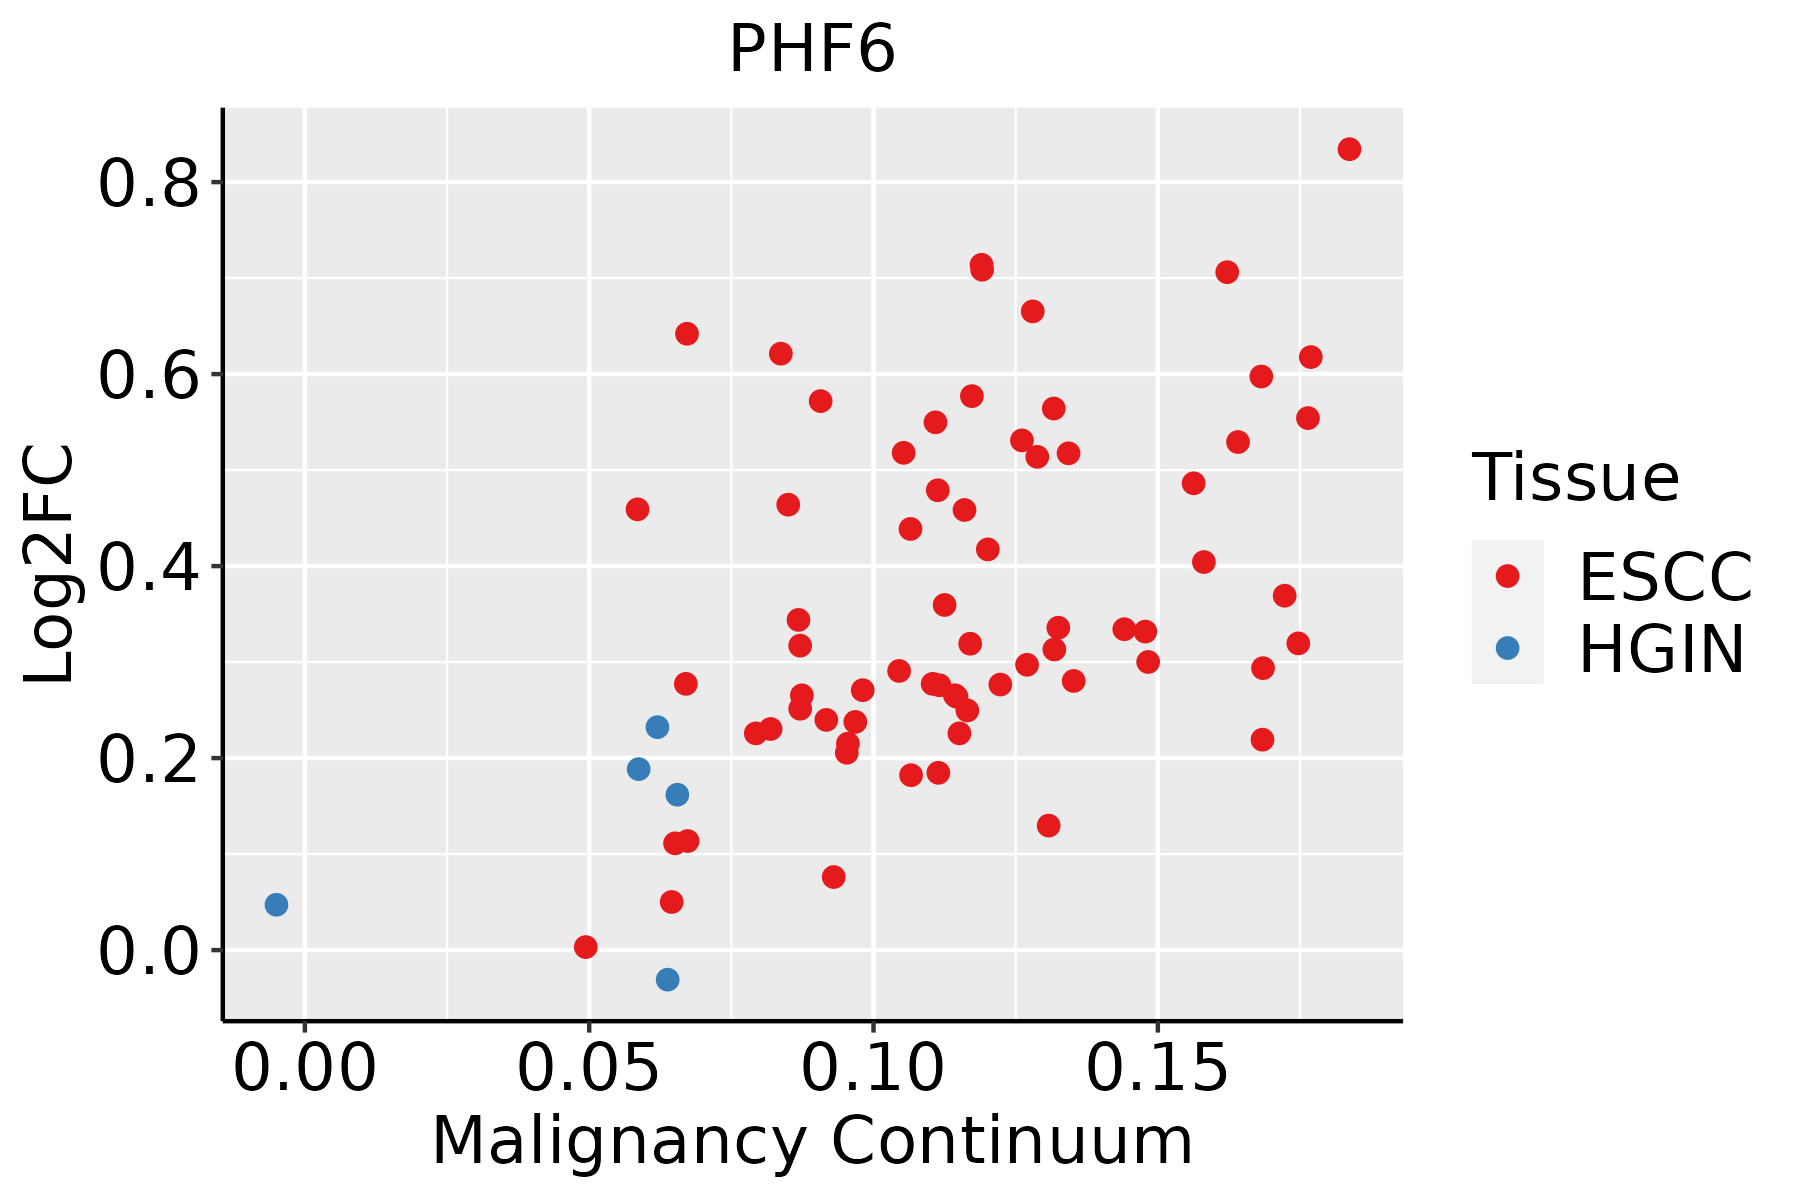 | ESCC: Esophageal squamous cell carcinoma |
| HGIN: High-grade intraepithelial neoplasias | ||
| LGIN: Low-grade intraepithelial neoplasias | ||
| Liver | 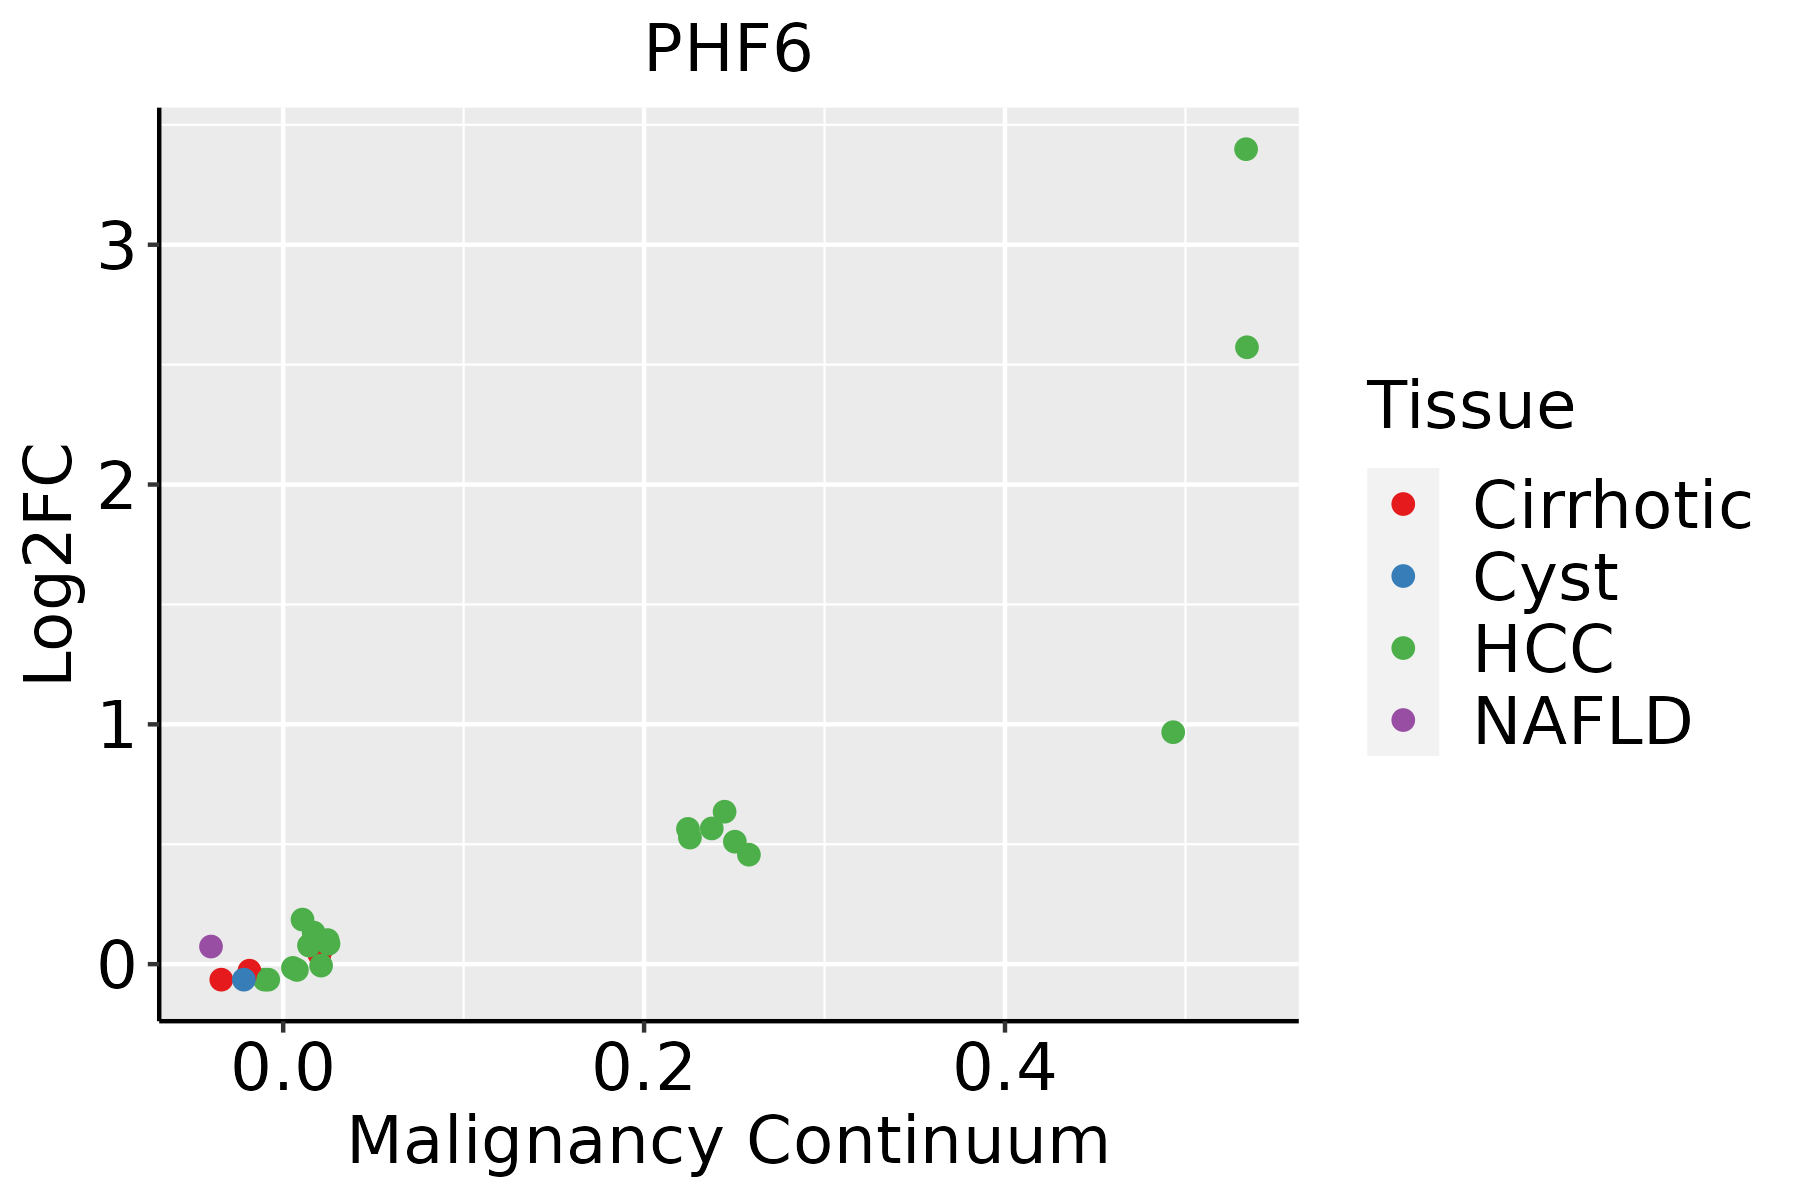 | HCC: Hepatocellular carcinoma |
| NAFLD: Non-alcoholic fatty liver disease | ||
| Oral Cavity |  | EOLP: Erosive Oral lichen planus |
| LP: leukoplakia | ||
| NEOLP: Non-erosive oral lichen planus | ||
| OSCC: Oral squamous cell carcinoma | ||
| Skin | 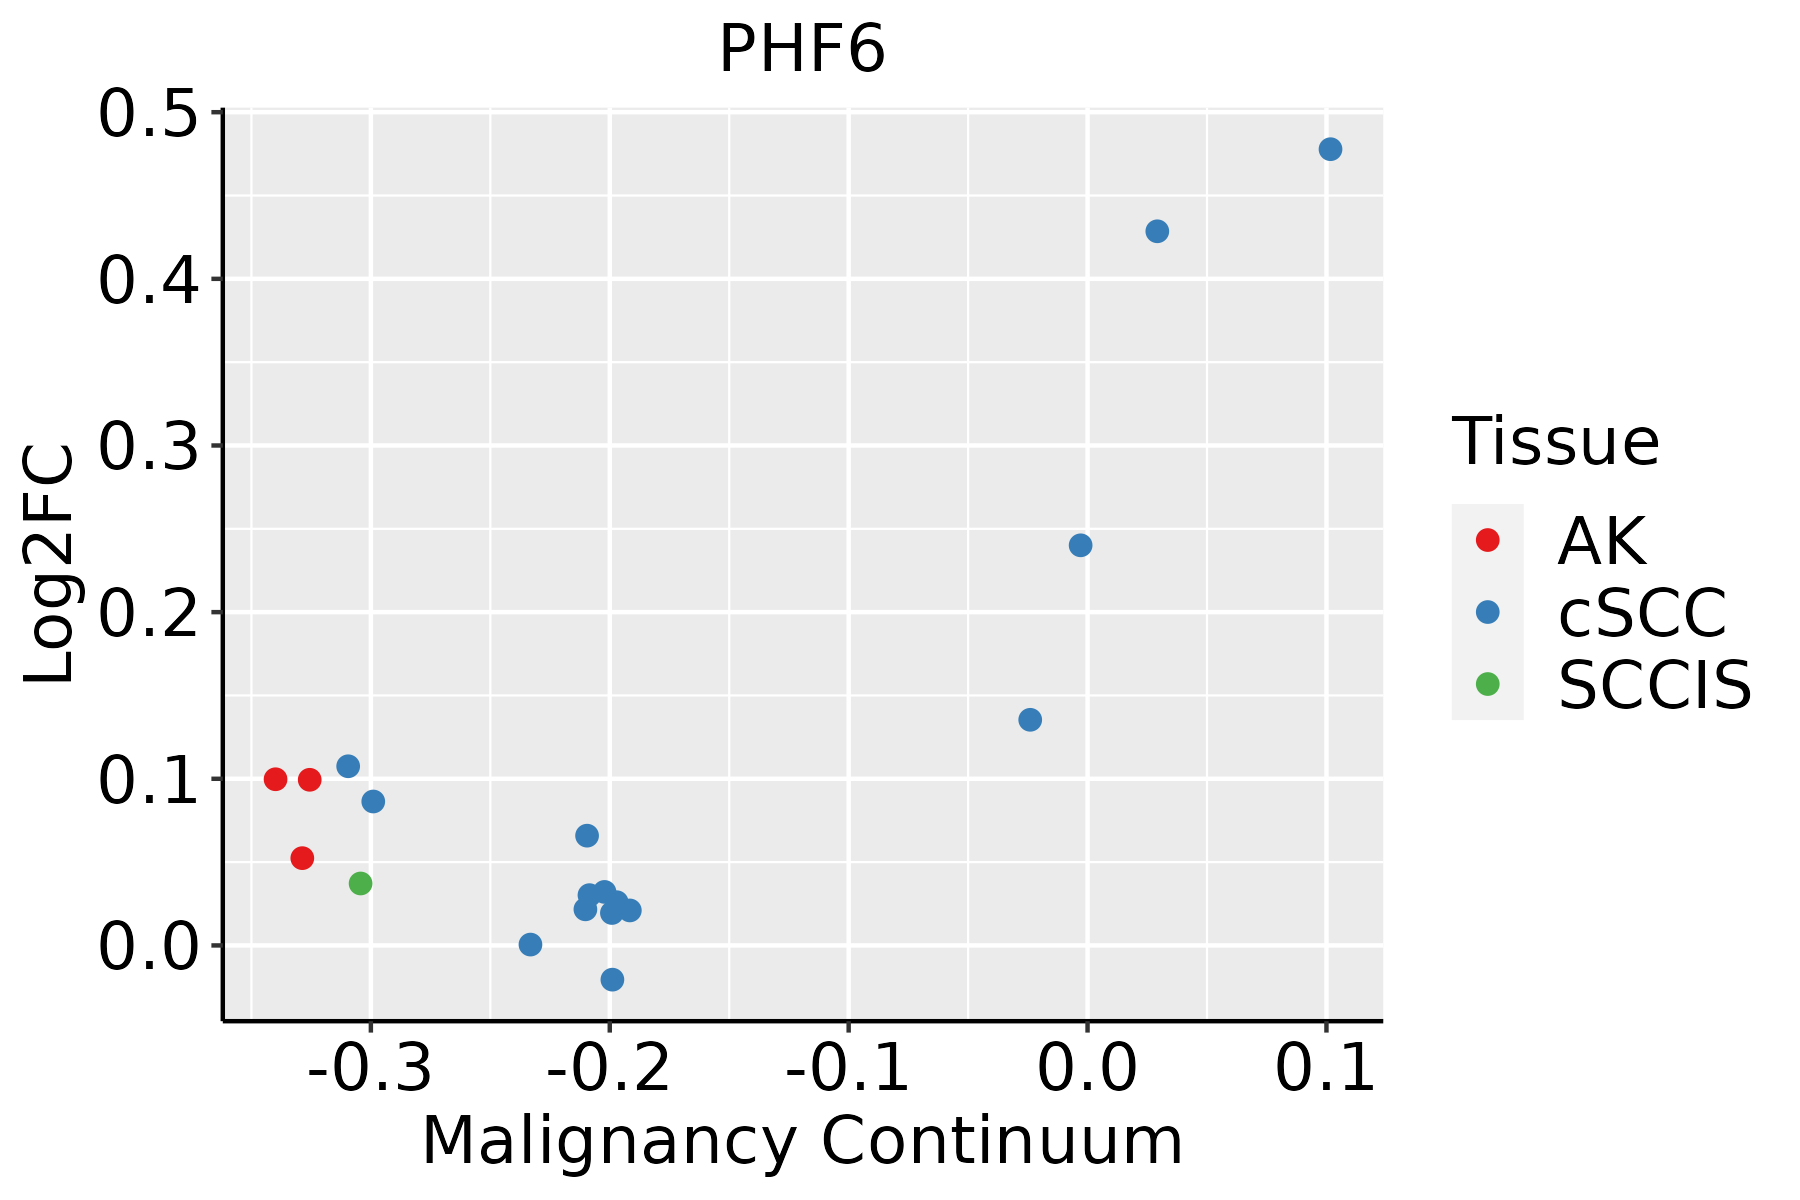 | AK: Actinic keratosis |
| cSCC: Cutaneous squamous cell carcinoma | ||
| SCCIS:squamous cell carcinoma in situ | ||
| Thyroid | 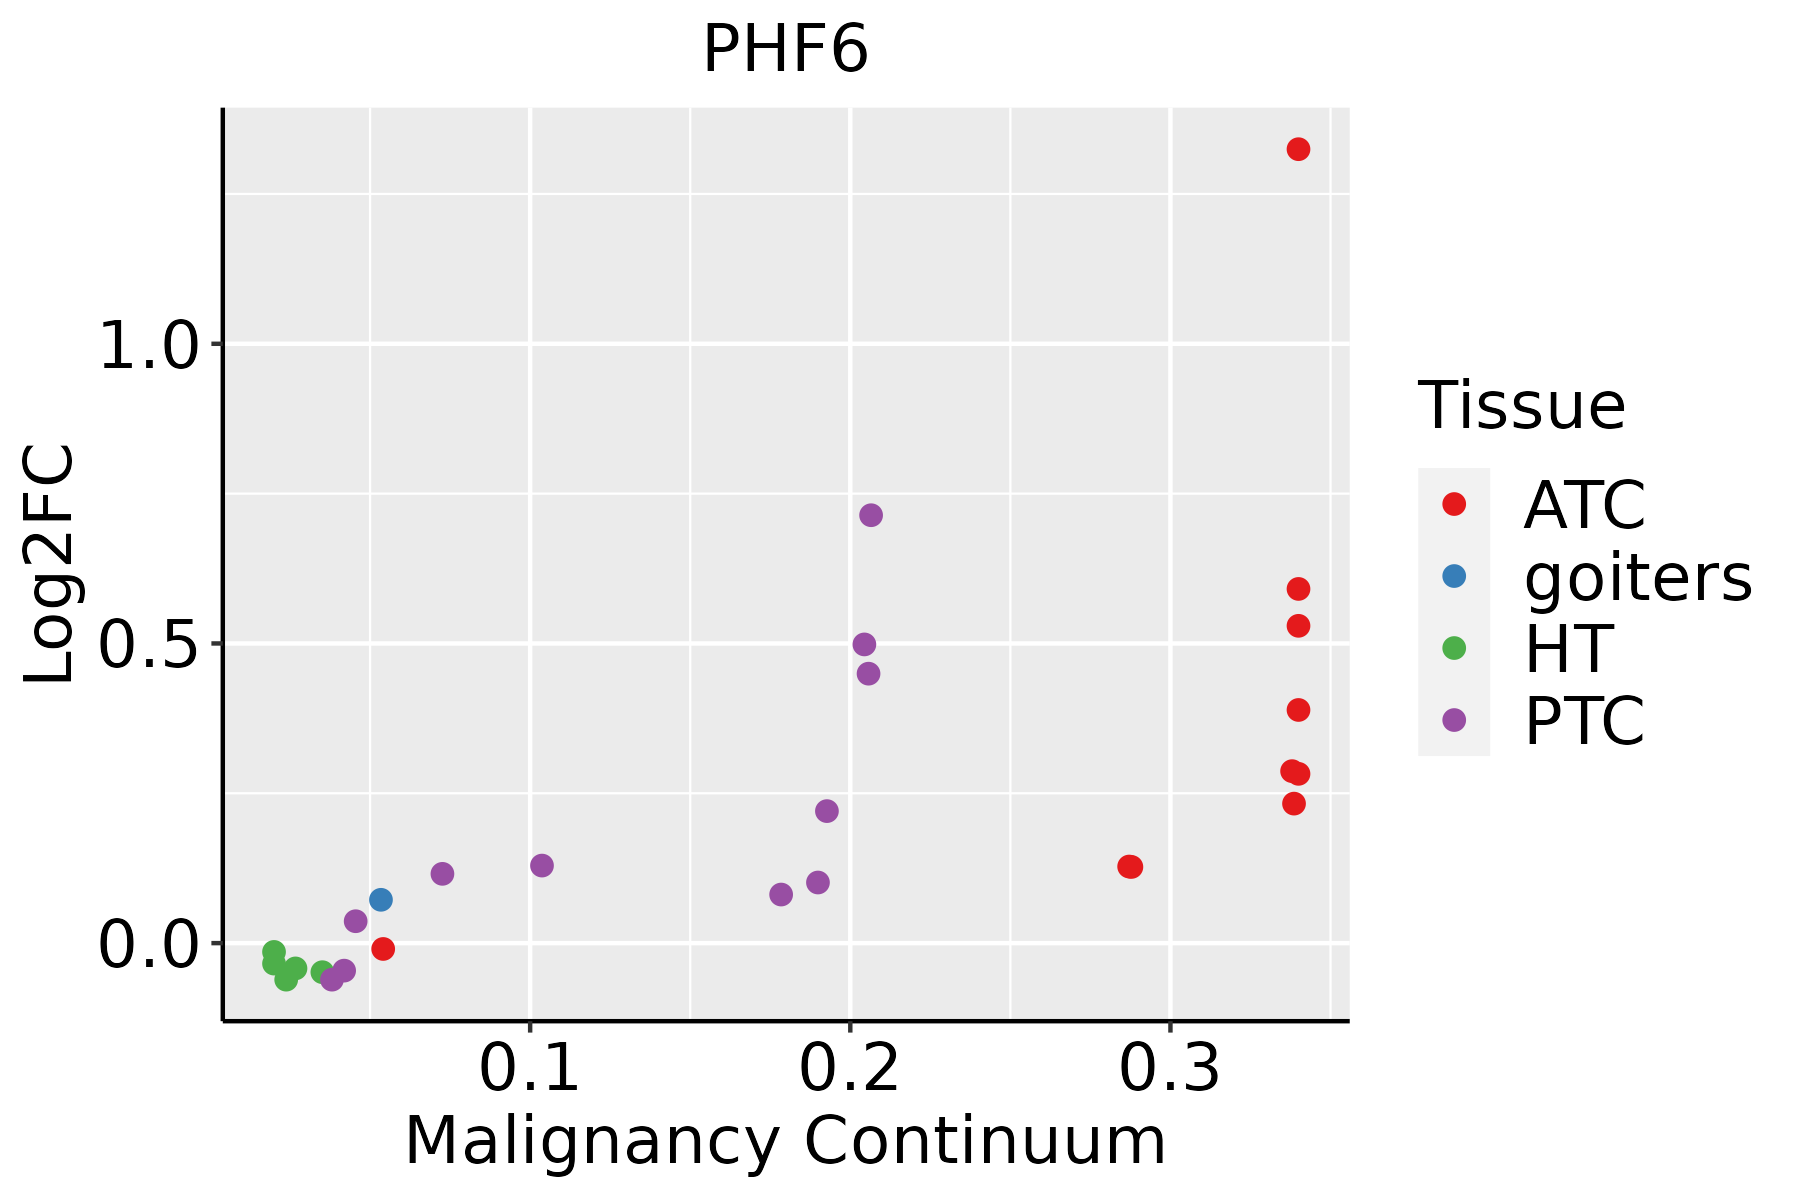 | ATC: Anaplastic thyroid cancer |
| HT: Hashimoto's thyroiditis | ||
| PTC: Papillary thyroid cancer |
| ∗log2FC in expression of this searched gene in stem-like cells from each diseased tissue sample relative to stem-like cells in normal samples in each tissue plotted against the malignancy continuum. Samples are colored based on if they are from different disease stage. |
Top |
Malignant transformation related pathway analysis |
| Find out the enriched GO biological processes and KEGG pathways involved in transition from healthy to precancer to cancer |
| Tissue | Disease Stage | Enriched GO biological Processes |
| Colorectum | AD |  |
| Colorectum | SER |  |
| Colorectum | MSS |  |
| Colorectum | MSI-H |  |
| Colorectum | FAP |  |
| ∗Top 15 enriched GO BP terms are showed in the bar plot of each disease state in each tissue. Each row represents a significant GO biological process which is colored according to the -log10(p.adjust). |
| Page: 1 2 3 4 5 6 7 8 9 |
| GO ID | Tissue | Disease Stage | Description | Gene Ratio | Bg Ratio | pvalue | p.adjust | Count |
| GO:000170118 | Esophagus | HGIN | in utero embryonic development | 77/2587 | 367/18723 | 9.56e-05 | 2.05e-03 | 77 |
| GO:00018244 | Esophagus | HGIN | blastocyst development | 28/2587 | 106/18723 | 4.30e-04 | 6.47e-03 | 28 |
| GO:000170119 | Esophagus | ESCC | in utero embryonic development | 243/8552 | 367/18723 | 1.00e-15 | 6.86e-14 | 243 |
| GO:000182412 | Esophagus | ESCC | blastocyst development | 73/8552 | 106/18723 | 1.13e-06 | 1.40e-05 | 73 |
| GO:000170111 | Liver | HCC | in utero embryonic development | 204/7958 | 367/18723 | 2.44e-07 | 4.30e-06 | 204 |
| GO:000170116 | Oral cavity | OSCC | in utero embryonic development | 207/7305 | 367/18723 | 7.92e-12 | 2.95e-10 | 207 |
| GO:00018243 | Oral cavity | OSCC | blastocyst development | 66/7305 | 106/18723 | 1.04e-06 | 1.40e-05 | 66 |
| GO:000170117 | Oral cavity | LP | in utero embryonic development | 142/4623 | 367/18723 | 1.48e-09 | 6.75e-08 | 142 |
| GO:000182411 | Oral cavity | LP | blastocyst development | 46/4623 | 106/18723 | 1.86e-05 | 3.15e-04 | 46 |
| GO:000170124 | Skin | cSCC | in utero embryonic development | 150/4864 | 367/18723 | 2.47e-10 | 1.04e-08 | 150 |
| GO:000182413 | Skin | cSCC | blastocyst development | 53/4864 | 106/18723 | 9.74e-08 | 2.32e-06 | 53 |
| GO:0001701111 | Thyroid | PTC | in utero embryonic development | 175/5968 | 367/18723 | 1.40e-10 | 4.73e-09 | 175 |
| GO:00018246 | Thyroid | PTC | blastocyst development | 49/5968 | 106/18723 | 1.37e-03 | 7.72e-03 | 49 |
| GO:000170126 | Thyroid | ATC | in utero embryonic development | 183/6293 | 367/18723 | 6.62e-11 | 2.11e-09 | 183 |
| GO:000182414 | Thyroid | ATC | blastocyst development | 53/6293 | 106/18723 | 3.48e-04 | 2.16e-03 | 53 |
| Page: 1 |
| Pathway ID | Tissue | Disease Stage | Description | Gene Ratio | Bg Ratio | pvalue | p.adjust | qvalue | Count |
| Page: 1 |
Top |
Cell-cell communication analysis |
| Identification of potential cell-cell interactions between two cell types and their ligand-receptor pairs for different disease states |
| Ligand | Receptor | LRpair | Pathway | Tissue | Disease Stage |
| Page: 1 |
Top |
Single-cell gene regulatory network inference analysis |
| Find out the significant the regulons (TFs) and the target genes of each regulon across cell types for different disease states |
| TF | Cell Type | Tissue | Disease Stage | Target Gene | RSS | Regulon Activity |
| ∗The dot plots of a searched regulon are shown for all cell subpopulations in each disease state of each tissue based on the regulon specific score inferred using pySCENIC and by calculating the average expression. |
| Page: 1 |
Top |
Somatic mutation of malignant transformation related genes |
| Annotation of somatic variants for genes involved in malignant transformation |
| Hugo Symbol | Variant Class | Variant Classification | dbSNP RS | HGVSc | HGVSp | HGVSp Short | SWISSPROT | BIOTYPE | SIFT | PolyPhen | Tumor Sample Barcode | Tissue | Histology | Sex | Age | Stage | Therapy Types | Drugs | Outcome |
| PHF6 | SNV | Missense_Mutation | c.982N>T | p.Asn328Tyr | p.N328Y | Q8IWS0 | protein_coding | deleterious(0.02) | probably_damaging(0.998) | TCGA-AR-A1AW-01 | Breast | breast invasive carcinoma | Female | >=65 | I/II | Chemotherapy | docetaxel | SD | |
| PHF6 | SNV | Missense_Mutation | c.421G>A | p.Asp141Asn | p.D141N | Q8IWS0 | protein_coding | deleterious(0.02) | benign(0.05) | TCGA-E2-A1IN-01 | Breast | breast invasive carcinoma | Female | <65 | I/II | Hormone Therapy | arimidex | SD | |
| PHF6 | insertion | Nonsense_Mutation | novel | c.309_310insTTCTTTGCCTTGTCTGTGCATTTGTAGCAGTTTT | p.His104PhefsTer9 | p.H104Ffs*9 | Q8IWS0 | protein_coding | TCGA-BH-A0BV-01 | Breast | breast invasive carcinoma | Female | >=65 | I/II | Chemotherapy | doxorubicin | SD | ||
| PHF6 | SNV | Missense_Mutation | c.956N>A | p.Arg319Gln | p.R319Q | Q8IWS0 | protein_coding | tolerated(0.11) | possibly_damaging(0.577) | TCGA-2W-A8YY-01 | Cervix | cervical & endocervical cancer | Female | <65 | I/II | Chemotherapy | cisplatin | CR | |
| PHF6 | SNV | Missense_Mutation | novel | c.119C>T | p.Ala40Val | p.A40V | Q8IWS0 | protein_coding | deleterious(0.05) | probably_damaging(0.95) | TCGA-AA-3845-01 | Colorectum | colon adenocarcinoma | Female | >=65 | I/II | Unknown | Unknown | PD |
| PHF6 | SNV | Missense_Mutation | c.44N>A | p.Arg15His | p.R15H | Q8IWS0 | protein_coding | tolerated(0.1) | benign(0.211) | TCGA-CM-4743-01 | Colorectum | colon adenocarcinoma | Male | >=65 | I/II | Chemotherapy | capecitabine | SD | |
| PHF6 | SNV | Missense_Mutation | novel | c.13G>A | p.Val5Ile | p.V5I | Q8IWS0 | protein_coding | tolerated_low_confidence(0.26) | benign(0) | TCGA-A5-A0G1-01 | Endometrium | uterine corpus endometrioid carcinoma | Female | >=65 | I/II | Unknown | Unknown | SD |
| PHF6 | SNV | Missense_Mutation | novel | c.248N>T | p.Ser83Phe | p.S83F | Q8IWS0 | protein_coding | deleterious(0) | probably_damaging(0.925) | TCGA-AJ-A3EK-01 | Endometrium | uterine corpus endometrioid carcinoma | Female | <65 | I/II | Chemotherapy | carboplatin | CR |
| PHF6 | SNV | Missense_Mutation | c.897N>T | p.Lys299Asn | p.K299N | Q8IWS0 | protein_coding | deleterious(0) | probably_damaging(0.995) | TCGA-AP-A056-01 | Endometrium | uterine corpus endometrioid carcinoma | Female | <65 | I/II | Unknown | Unknown | SD | |
| PHF6 | SNV | Missense_Mutation | novel | c.786N>A | p.Asp262Glu | p.D262E | Q8IWS0 | protein_coding | tolerated(0.18) | benign(0.324) | TCGA-AP-A059-01 | Endometrium | uterine corpus endometrioid carcinoma | Female | >=65 | I/II | Unknown | Unknown | SD |
| Page: 1 2 3 4 |
Top |
Related drugs of malignant transformation related genes |
| Identification of chemicals and drugs interact with genes involved in malignant transfromation |
| (DGIdb 4.0) |
| Entrez ID | Symbol | Category | Interaction Types | Drug Claim Name | Drug Name | PMIDs |
| Page: 1 |

Copyright 2023-Present -The University of Texas Health Science Center at Houston |