
|
|||||
|
 | |
| |
| |
| |
| |
| |
|
Gene: PHF5A |
Gene summary for PHF5A |
| Gene information | Species | Human | Gene symbol | PHF5A | Gene ID | 84844 |
| Gene name | PHD finger protein 5A | |
| Gene Alias | INI | |
| Cytomap | 22q13.2 | |
| Gene Type | protein-coding | GO ID | GO:0000375 | UniProtAcc | A0A024R1U2 |
Top |
Malignant transformation analysis |
| Identification of the aberrant gene expression in precancerous and cancerous lesions by comparing the gene expression of stem-like cells in diseased tissues with normal stem cells |
| Entrez ID | Symbol | Replicates | Species | Organ | Tissue | Adj P-value | Log2FC | Malignancy |
| 84844 | PHF5A | LZE2T | Human | Esophagus | ESCC | 2.01e-03 | 7.15e-01 | 0.082 |
| 84844 | PHF5A | LZE4T | Human | Esophagus | ESCC | 2.84e-13 | 4.01e-01 | 0.0811 |
| 84844 | PHF5A | LZE5T | Human | Esophagus | ESCC | 2.65e-08 | 4.38e-01 | 0.0514 |
| 84844 | PHF5A | LZE7T | Human | Esophagus | ESCC | 1.45e-07 | 7.43e-01 | 0.0667 |
| 84844 | PHF5A | LZE8T | Human | Esophagus | ESCC | 1.43e-03 | 1.72e-01 | 0.067 |
| 84844 | PHF5A | LZE20T | Human | Esophagus | ESCC | 8.72e-09 | 1.85e-01 | 0.0662 |
| 84844 | PHF5A | LZE22T | Human | Esophagus | ESCC | 1.11e-04 | 6.22e-01 | 0.068 |
| 84844 | PHF5A | LZE24T | Human | Esophagus | ESCC | 5.20e-30 | 7.29e-01 | 0.0596 |
| 84844 | PHF5A | LZE21T | Human | Esophagus | ESCC | 1.03e-03 | 5.28e-01 | 0.0655 |
| 84844 | PHF5A | LZE6T | Human | Esophagus | ESCC | 1.10e-05 | 5.04e-01 | 0.0845 |
| 84844 | PHF5A | P1T-E | Human | Esophagus | ESCC | 4.66e-11 | 6.48e-01 | 0.0875 |
| 84844 | PHF5A | P2T-E | Human | Esophagus | ESCC | 2.44e-37 | 8.41e-01 | 0.1177 |
| 84844 | PHF5A | P4T-E | Human | Esophagus | ESCC | 4.30e-50 | 1.26e+00 | 0.1323 |
| 84844 | PHF5A | P5T-E | Human | Esophagus | ESCC | 3.44e-43 | 1.05e+00 | 0.1327 |
| 84844 | PHF5A | P8T-E | Human | Esophagus | ESCC | 3.87e-27 | 6.88e-01 | 0.0889 |
| 84844 | PHF5A | P9T-E | Human | Esophagus | ESCC | 7.93e-36 | 9.35e-01 | 0.1131 |
| 84844 | PHF5A | P10T-E | Human | Esophagus | ESCC | 9.76e-52 | 1.09e+00 | 0.116 |
| 84844 | PHF5A | P11T-E | Human | Esophagus | ESCC | 5.78e-14 | 6.69e-01 | 0.1426 |
| 84844 | PHF5A | P12T-E | Human | Esophagus | ESCC | 1.79e-45 | 1.07e+00 | 0.1122 |
| 84844 | PHF5A | P15T-E | Human | Esophagus | ESCC | 5.31e-44 | 1.19e+00 | 0.1149 |
| Page: 1 2 3 4 5 6 |
| Tissue | Expression Dynamics | Abbreviation |
| Esophagus |  | ESCC: Esophageal squamous cell carcinoma |
| HGIN: High-grade intraepithelial neoplasias | ||
| LGIN: Low-grade intraepithelial neoplasias | ||
| Liver | 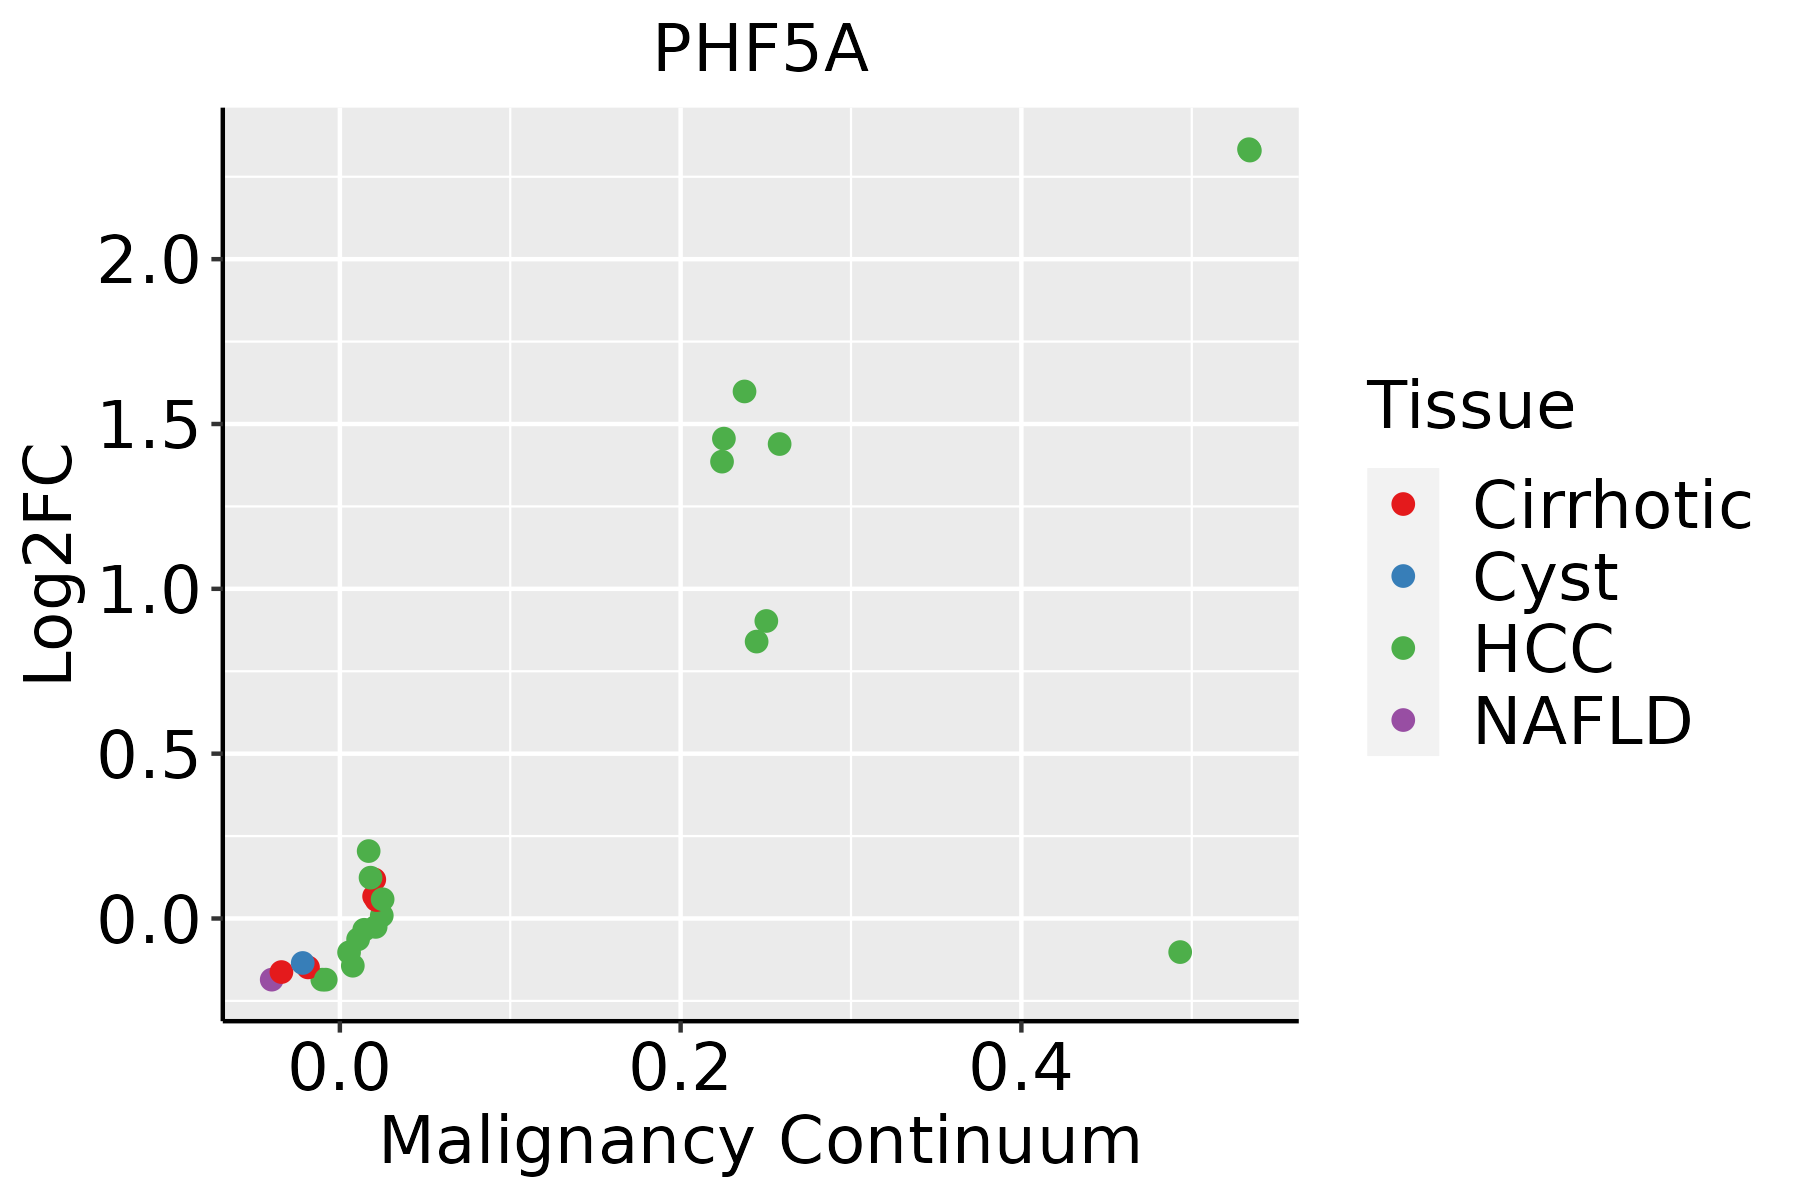 | HCC: Hepatocellular carcinoma |
| NAFLD: Non-alcoholic fatty liver disease | ||
| Oral Cavity |  | EOLP: Erosive Oral lichen planus |
| LP: leukoplakia | ||
| NEOLP: Non-erosive oral lichen planus | ||
| OSCC: Oral squamous cell carcinoma | ||
| Skin | 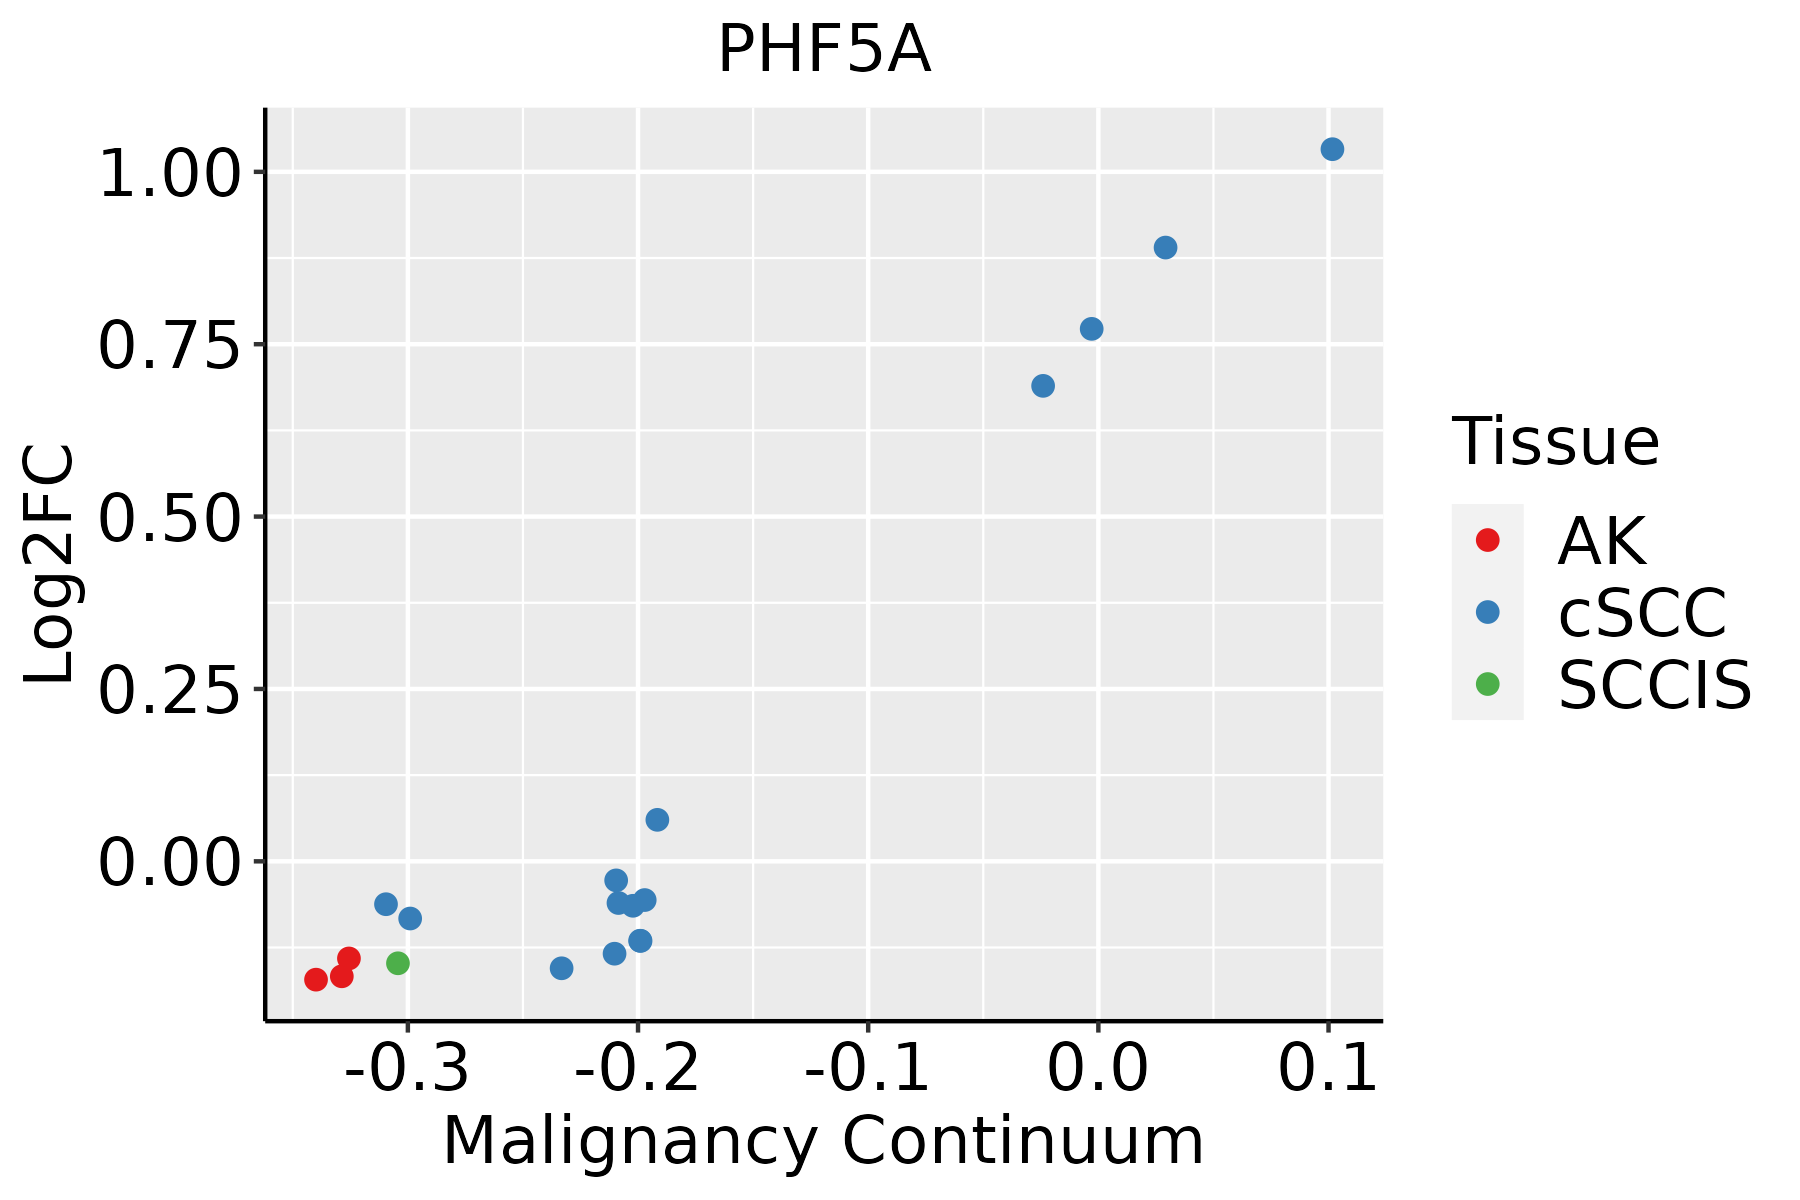 | AK: Actinic keratosis |
| cSCC: Cutaneous squamous cell carcinoma | ||
| SCCIS:squamous cell carcinoma in situ |
| ∗log2FC in expression of this searched gene in stem-like cells from each diseased tissue sample relative to stem-like cells in normal samples in each tissue plotted against the malignancy continuum. Samples are colored based on if they are from different disease stage. |
Top |
Malignant transformation related pathway analysis |
| Find out the enriched GO biological processes and KEGG pathways involved in transition from healthy to precancer to cancer |
| Tissue | Disease Stage | Enriched GO biological Processes |
| Colorectum | AD |  |
| Colorectum | SER |  |
| Colorectum | MSS |  |
| Colorectum | MSI-H |  |
| Colorectum | FAP |  |
| ∗Top 15 enriched GO BP terms are showed in the bar plot of each disease state in each tissue. Each row represents a significant GO biological process which is colored according to the -log10(p.adjust). |
| Page: 1 2 3 4 5 6 7 8 9 |
| GO ID | Tissue | Disease Stage | Description | Gene Ratio | Bg Ratio | pvalue | p.adjust | Count |
| GO:0008380111 | Esophagus | ESCC | RNA splicing | 336/8552 | 434/18723 | 1.74e-42 | 3.67e-39 | 336 |
| GO:0000375111 | Esophagus | ESCC | RNA splicing, via transesterification reactions | 248/8552 | 324/18723 | 3.05e-30 | 1.49e-27 | 248 |
| GO:0000377111 | Esophagus | ESCC | RNA splicing, via transesterification reactions with bulged adenosine as nucleophile | 244/8552 | 320/18723 | 2.52e-29 | 1.07e-26 | 244 |
| GO:0000398111 | Esophagus | ESCC | mRNA splicing, via spliceosome | 244/8552 | 320/18723 | 2.52e-29 | 1.07e-26 | 244 |
| GO:00488638 | Esophagus | ESCC | stem cell differentiation | 122/8552 | 206/18723 | 5.95e-05 | 4.59e-04 | 122 |
| GO:000838012 | Liver | Cirrhotic | RNA splicing | 229/4634 | 434/18723 | 9.13e-37 | 2.86e-33 | 229 |
| GO:000037512 | Liver | Cirrhotic | RNA splicing, via transesterification reactions | 175/4634 | 324/18723 | 5.95e-30 | 7.47e-27 | 175 |
| GO:000037712 | Liver | Cirrhotic | RNA splicing, via transesterification reactions with bulged adenosine as nucleophile | 172/4634 | 320/18723 | 4.02e-29 | 3.60e-26 | 172 |
| GO:000039812 | Liver | Cirrhotic | mRNA splicing, via spliceosome | 172/4634 | 320/18723 | 4.02e-29 | 3.60e-26 | 172 |
| GO:004886311 | Liver | Cirrhotic | stem cell differentiation | 66/4634 | 206/18723 | 1.06e-02 | 4.68e-02 | 66 |
| GO:000838022 | Liver | HCC | RNA splicing | 313/7958 | 434/18723 | 1.36e-36 | 1.73e-33 | 313 |
| GO:000037522 | Liver | HCC | RNA splicing, via transesterification reactions | 228/7958 | 324/18723 | 1.47e-24 | 4.06e-22 | 228 |
| GO:000037722 | Liver | HCC | RNA splicing, via transesterification reactions with bulged adenosine as nucleophile | 224/7958 | 320/18723 | 1.16e-23 | 2.62e-21 | 224 |
| GO:000039822 | Liver | HCC | mRNA splicing, via spliceosome | 224/7958 | 320/18723 | 1.16e-23 | 2.62e-21 | 224 |
| GO:000838020 | Oral cavity | OSCC | RNA splicing | 308/7305 | 434/18723 | 2.43e-42 | 7.70e-39 | 308 |
| GO:000037519 | Oral cavity | OSCC | RNA splicing, via transesterification reactions | 225/7305 | 324/18723 | 5.20e-29 | 2.99e-26 | 225 |
| GO:000037719 | Oral cavity | OSCC | RNA splicing, via transesterification reactions with bulged adenosine as nucleophile | 221/7305 | 320/18723 | 5.50e-28 | 2.18e-25 | 221 |
| GO:000039819 | Oral cavity | OSCC | mRNA splicing, via spliceosome | 221/7305 | 320/18723 | 5.50e-28 | 2.18e-25 | 221 |
| GO:00488637 | Oral cavity | OSCC | stem cell differentiation | 96/7305 | 206/18723 | 1.55e-02 | 4.99e-02 | 96 |
| GO:0008380110 | Oral cavity | LP | RNA splicing | 237/4623 | 434/18723 | 1.82e-41 | 3.79e-38 | 237 |
| Page: 1 2 |
| Pathway ID | Tissue | Disease Stage | Description | Gene Ratio | Bg Ratio | pvalue | p.adjust | qvalue | Count |
| hsa0304027 | Esophagus | ESCC | Spliceosome | 128/4205 | 217/8465 | 3.31e-03 | 8.79e-03 | 4.50e-03 | 128 |
| hsa0304037 | Esophagus | ESCC | Spliceosome | 128/4205 | 217/8465 | 3.31e-03 | 8.79e-03 | 4.50e-03 | 128 |
| hsa030407 | Liver | Cirrhotic | Spliceosome | 102/2530 | 217/8465 | 5.69e-08 | 9.47e-07 | 5.84e-07 | 102 |
| hsa0304012 | Liver | Cirrhotic | Spliceosome | 102/2530 | 217/8465 | 5.69e-08 | 9.47e-07 | 5.84e-07 | 102 |
| hsa0304022 | Liver | HCC | Spliceosome | 122/4020 | 217/8465 | 5.55e-03 | 1.60e-02 | 8.91e-03 | 122 |
| hsa0304032 | Liver | HCC | Spliceosome | 122/4020 | 217/8465 | 5.55e-03 | 1.60e-02 | 8.91e-03 | 122 |
| hsa0304016 | Oral cavity | OSCC | Spliceosome | 123/3704 | 217/8465 | 7.21e-05 | 2.74e-04 | 1.40e-04 | 123 |
| hsa0304017 | Oral cavity | OSCC | Spliceosome | 123/3704 | 217/8465 | 7.21e-05 | 2.74e-04 | 1.40e-04 | 123 |
| hsa0304026 | Oral cavity | LP | Spliceosome | 106/2418 | 217/8465 | 1.30e-10 | 2.40e-09 | 1.55e-09 | 106 |
| hsa0304036 | Oral cavity | LP | Spliceosome | 106/2418 | 217/8465 | 1.30e-10 | 2.40e-09 | 1.55e-09 | 106 |
| Page: 1 |
Top |
Cell-cell communication analysis |
| Identification of potential cell-cell interactions between two cell types and their ligand-receptor pairs for different disease states |
| Ligand | Receptor | LRpair | Pathway | Tissue | Disease Stage |
| Page: 1 |
Top |
Single-cell gene regulatory network inference analysis |
| Find out the significant the regulons (TFs) and the target genes of each regulon across cell types for different disease states |
| TF | Cell Type | Tissue | Disease Stage | Target Gene | RSS | Regulon Activity |
| ∗The dot plots of a searched regulon are shown for all cell subpopulations in each disease state of each tissue based on the regulon specific score inferred using pySCENIC and by calculating the average expression. |
| Page: 1 |
Top |
Somatic mutation of malignant transformation related genes |
| Annotation of somatic variants for genes involved in malignant transformation |
| Hugo Symbol | Variant Class | Variant Classification | dbSNP RS | HGVSc | HGVSp | HGVSp Short | SWISSPROT | BIOTYPE | SIFT | PolyPhen | Tumor Sample Barcode | Tissue | Histology | Sex | Age | Stage | Therapy Types | Drugs | Outcome |
| PHF5A | SNV | Missense_Mutation | c.112N>T | p.Arg38Cys | p.R38C | Q7RTV0 | protein_coding | deleterious(0.05) | probably_damaging(0.967) | TCGA-AX-A0J1-01 | Endometrium | uterine corpus endometrioid carcinoma | Female | >=65 | I/II | Unknown | Unknown | SD | |
| PHF5A | insertion | Frame_Shift_Ins | novel | c.1_2insAATTTGTTCT | p.Met1? | p.M1? | Q7RTV0 | protein_coding | TCGA-D1-A0ZR-01 | Endometrium | uterine corpus endometrioid carcinoma | Female | <65 | I/II | Unknown | Unknown | SD | ||
| PHF5A | SNV | Missense_Mutation | c.17N>T | p.Pro6Leu | p.P6L | Q7RTV0 | protein_coding | tolerated(0.39) | probably_damaging(0.969) | TCGA-51-6867-01 | Lung | lung squamous cell carcinoma | Female | >=65 | I/II | Unknown | Unknown | PD | |
| PHF5A | SNV | Missense_Mutation | c.169C>T | p.Arg57Cys | p.R57C | Q7RTV0 | protein_coding | deleterious(0) | benign(0.125) | TCGA-63-A5MM-01 | Lung | lung squamous cell carcinoma | Female | >=65 | I/II | Chemotherapy | cisplatin | PD | |
| PHF5A | SNV | Missense_Mutation | novel | c.130N>T | p.Arg44Cys | p.R44C | Q7RTV0 | protein_coding | deleterious(0.04) | benign(0.094) | TCGA-BA-5153-01 | Oral cavity | head & neck squamous cell carcinoma | Male | <65 | I/II | Unspecific | Xeloda | PD |
| PHF5A | insertion | Frame_Shift_Ins | novel | c.312_313insA | p.Tyr105IlefsTer64 | p.Y105Ifs*64 | Q7RTV0 | protein_coding | TCGA-F7-A624-01 | Oral cavity | head & neck squamous cell carcinoma | Male | >=65 | I/II | Unknown | Unknown | SD | ||
| PHF5A | SNV | Missense_Mutation | c.113G>A | p.Arg38His | p.R38H | Q7RTV0 | protein_coding | tolerated(0.06) | benign(0.051) | TCGA-KK-A59V-01 | Prostate | prostate adenocarcinoma | Male | <65 | 9 | Unknown | Unknown | SD | |
| PHF5A | SNV | Missense_Mutation | novel | c.165N>T | p.Gln55His | p.Q55H | Q7RTV0 | protein_coding | deleterious(0.04) | benign(0.049) | TCGA-VQ-AA6D-01 | Stomach | stomach adenocarcinoma | Female | <65 | III/IV | Chemotherapy | fluorouracil | CR |
| Page: 1 |
Top |
Related drugs of malignant transformation related genes |
| Identification of chemicals and drugs interact with genes involved in malignant transfromation |
| (DGIdb 4.0) |
| Entrez ID | Symbol | Category | Interaction Types | Drug Claim Name | Drug Name | PMIDs |
| Page: 1 |

Copyright 2023-Present -The University of Texas Health Science Center at Houston |