
|
|||||
|
 | |
| |
| |
| |
| |
| |
|
Gene: PHF21A |
Gene summary for PHF21A |
| Gene information | Species | Human | Gene symbol | PHF21A | Gene ID | 51317 |
| Gene name | PHD finger protein 21A | |
| Gene Alias | BHC80 | |
| Cytomap | 11p11.2 | |
| Gene Type | protein-coding | GO ID | GO:0000122 | UniProtAcc | Q96BD5 |
Top |
Malignant transformation analysis |
| Identification of the aberrant gene expression in precancerous and cancerous lesions by comparing the gene expression of stem-like cells in diseased tissues with normal stem cells |
| Entrez ID | Symbol | Replicates | Species | Organ | Tissue | Adj P-value | Log2FC | Malignancy |
| 51317 | PHF21A | CCI_1 | Human | Cervix | CC | 8.07e-07 | 5.98e-01 | 0.528 |
| 51317 | PHF21A | CCI_2 | Human | Cervix | CC | 2.13e-03 | 6.55e-01 | 0.5249 |
| 51317 | PHF21A | CCI_3 | Human | Cervix | CC | 9.78e-14 | 7.80e-01 | 0.516 |
| 51317 | PHF21A | LZE4T | Human | Esophagus | ESCC | 1.32e-13 | 3.17e-01 | 0.0811 |
| 51317 | PHF21A | LZE5T | Human | Esophagus | ESCC | 3.25e-02 | 2.44e-01 | 0.0514 |
| 51317 | PHF21A | LZE8T | Human | Esophagus | ESCC | 6.47e-34 | 1.14e+00 | 0.067 |
| 51317 | PHF21A | LZE24T | Human | Esophagus | ESCC | 3.59e-11 | 2.42e-01 | 0.0596 |
| 51317 | PHF21A | P1T-E | Human | Esophagus | ESCC | 1.31e-05 | 2.23e-01 | 0.0875 |
| 51317 | PHF21A | P2T-E | Human | Esophagus | ESCC | 2.48e-16 | 3.00e-01 | 0.1177 |
| 51317 | PHF21A | P4T-E | Human | Esophagus | ESCC | 1.64e-02 | 8.62e-02 | 0.1323 |
| 51317 | PHF21A | P8T-E | Human | Esophagus | ESCC | 4.00e-12 | 1.62e-01 | 0.0889 |
| 51317 | PHF21A | P9T-E | Human | Esophagus | ESCC | 2.32e-09 | 2.11e-01 | 0.1131 |
| 51317 | PHF21A | P10T-E | Human | Esophagus | ESCC | 2.10e-14 | 2.93e-01 | 0.116 |
| 51317 | PHF21A | P11T-E | Human | Esophagus | ESCC | 8.10e-06 | 3.66e-01 | 0.1426 |
| 51317 | PHF21A | P12T-E | Human | Esophagus | ESCC | 4.47e-15 | 2.43e-01 | 0.1122 |
| 51317 | PHF21A | P15T-E | Human | Esophagus | ESCC | 2.32e-13 | 3.15e-01 | 0.1149 |
| 51317 | PHF21A | P16T-E | Human | Esophagus | ESCC | 1.31e-11 | 1.51e-01 | 0.1153 |
| 51317 | PHF21A | P17T-E | Human | Esophagus | ESCC | 3.80e-03 | 2.02e-01 | 0.1278 |
| 51317 | PHF21A | P20T-E | Human | Esophagus | ESCC | 1.07e-14 | 2.94e-01 | 0.1124 |
| 51317 | PHF21A | P21T-E | Human | Esophagus | ESCC | 1.72e-05 | 8.50e-02 | 0.1617 |
| Page: 1 2 3 4 5 6 |
| Tissue | Expression Dynamics | Abbreviation |
| Cervix | 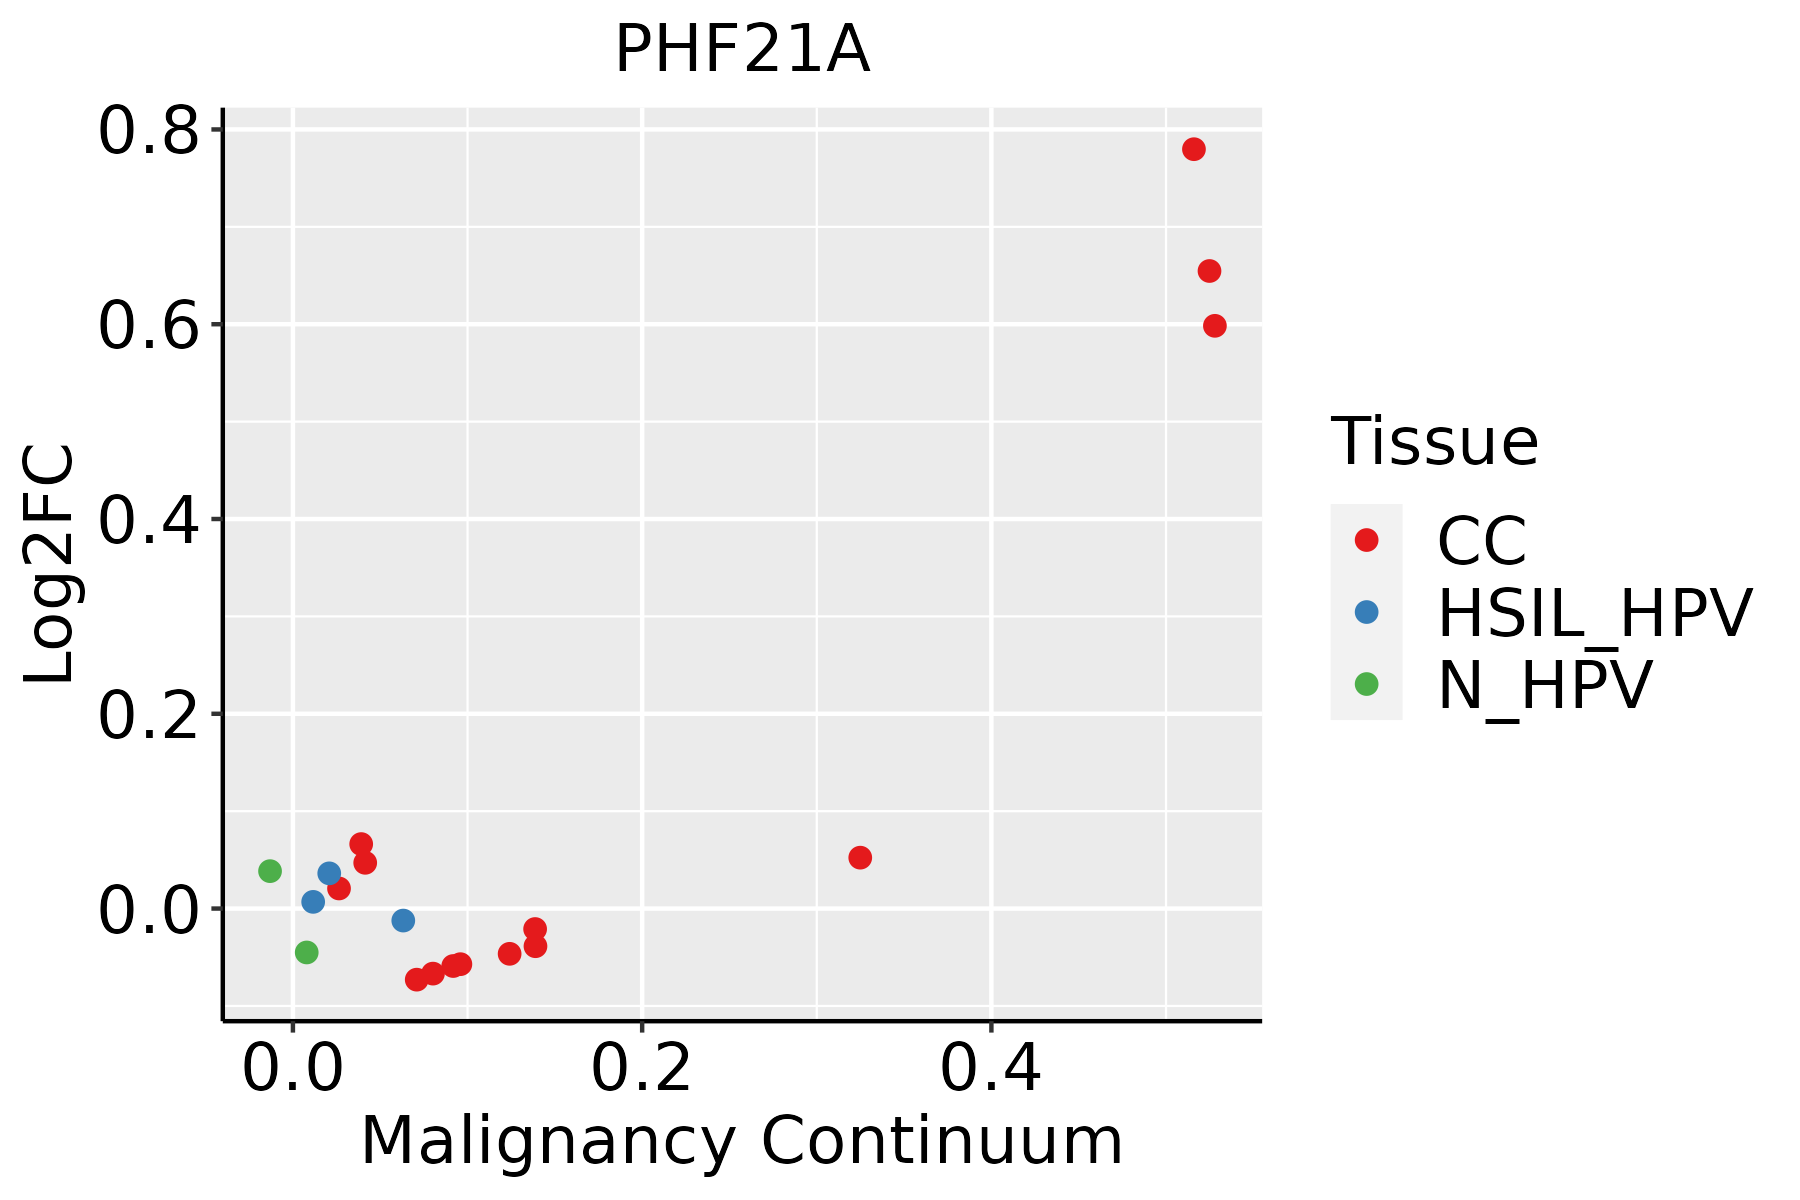 | CC: Cervix cancer |
| HSIL_HPV: HPV-infected high-grade squamous intraepithelial lesions | ||
| N_HPV: HPV-infected normal cervix | ||
| Esophagus | 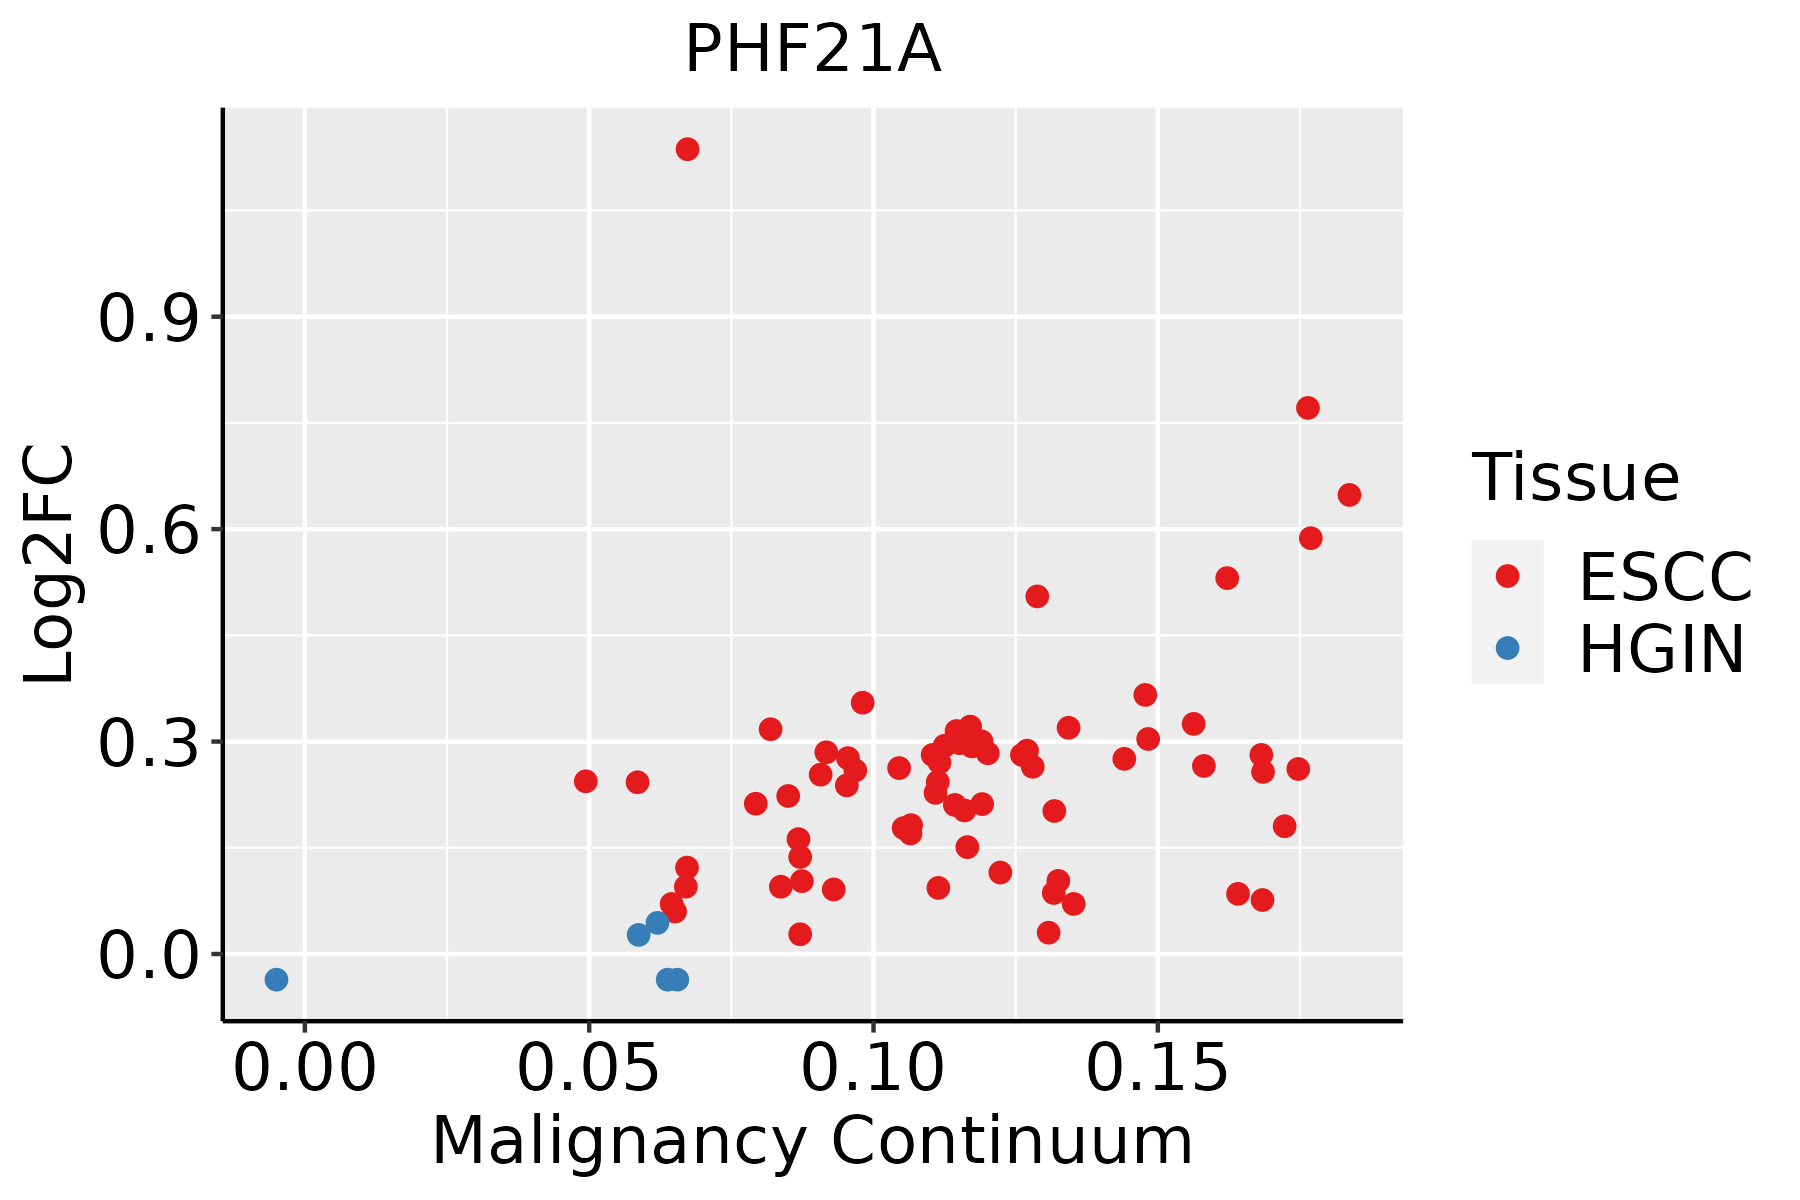 | ESCC: Esophageal squamous cell carcinoma |
| HGIN: High-grade intraepithelial neoplasias | ||
| LGIN: Low-grade intraepithelial neoplasias | ||
| Liver | 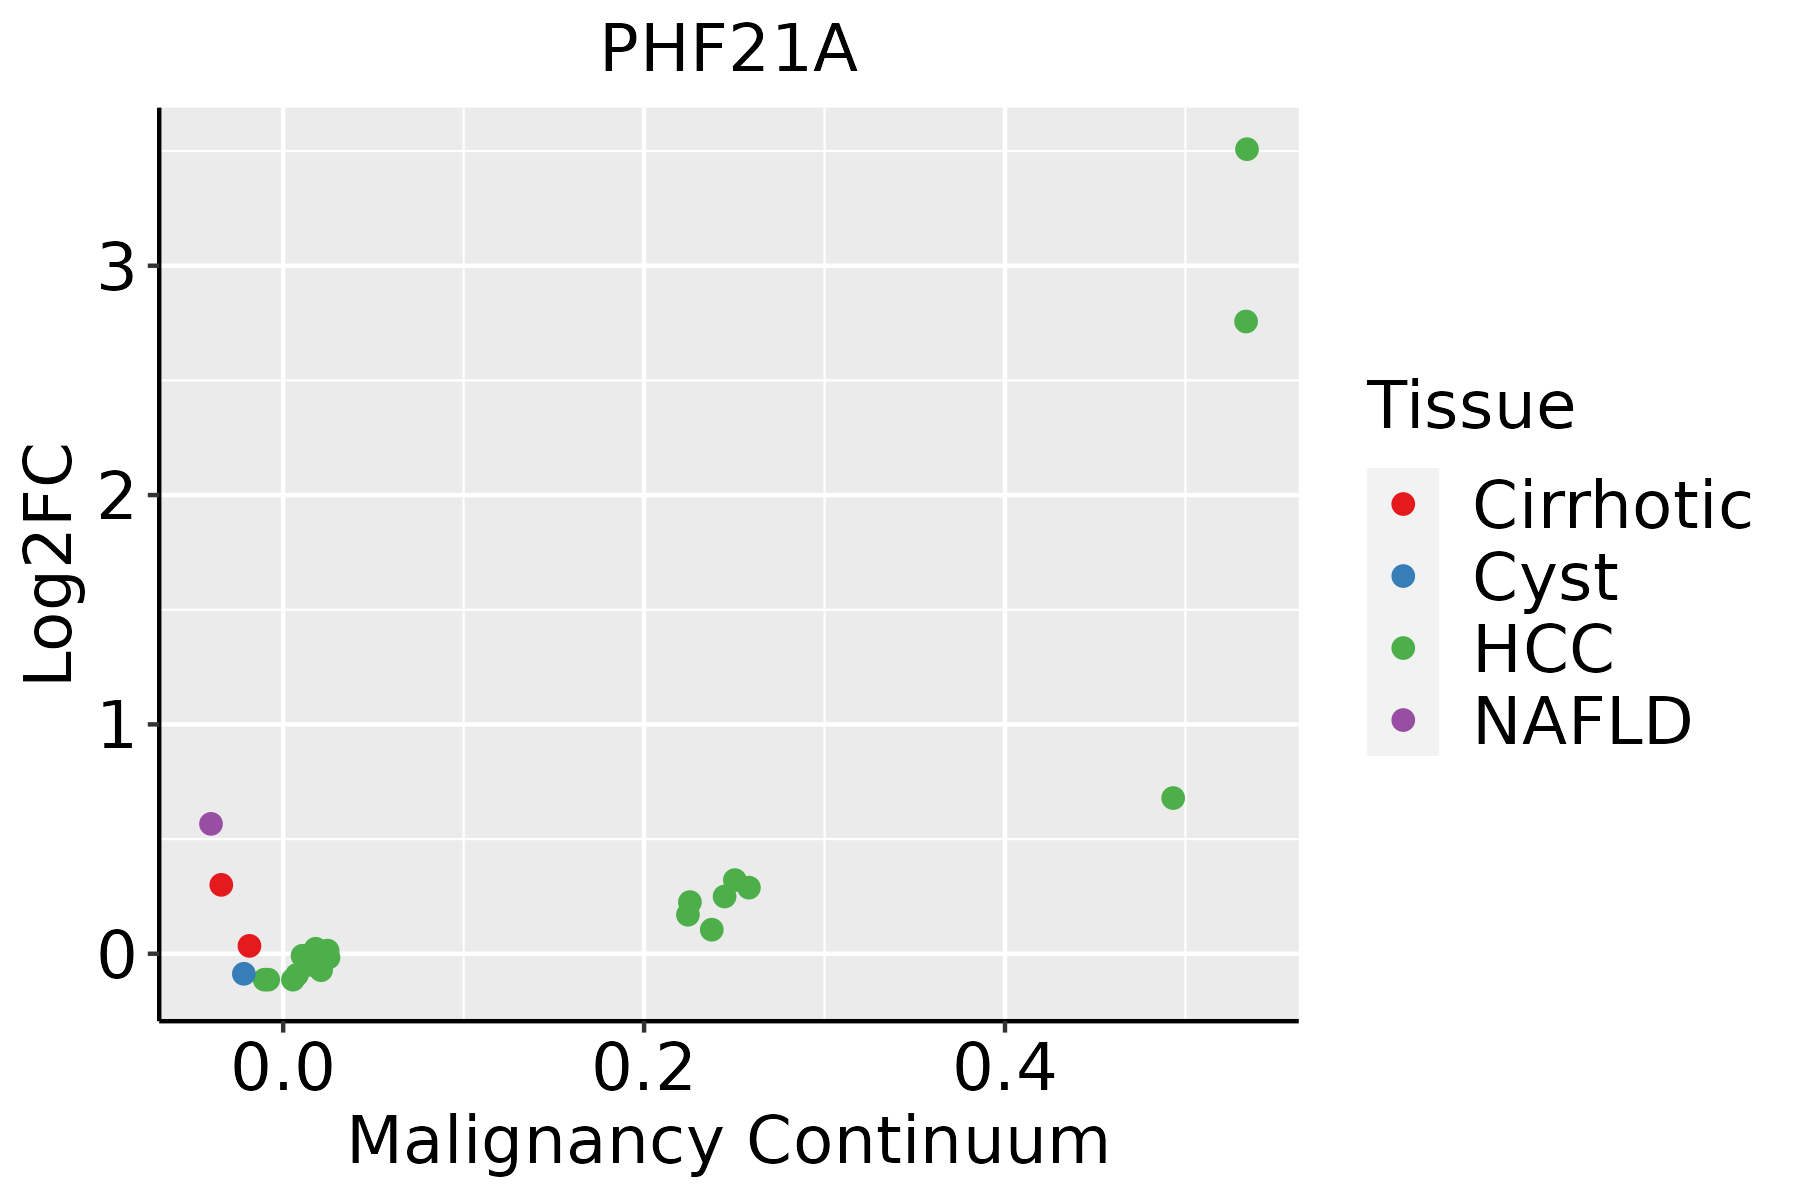 | HCC: Hepatocellular carcinoma |
| NAFLD: Non-alcoholic fatty liver disease | ||
| Lung |  | AAH: Atypical adenomatous hyperplasia |
| AIS: Adenocarcinoma in situ | ||
| IAC: Invasive lung adenocarcinoma | ||
| MIA: Minimally invasive adenocarcinoma | ||
| Oral Cavity | 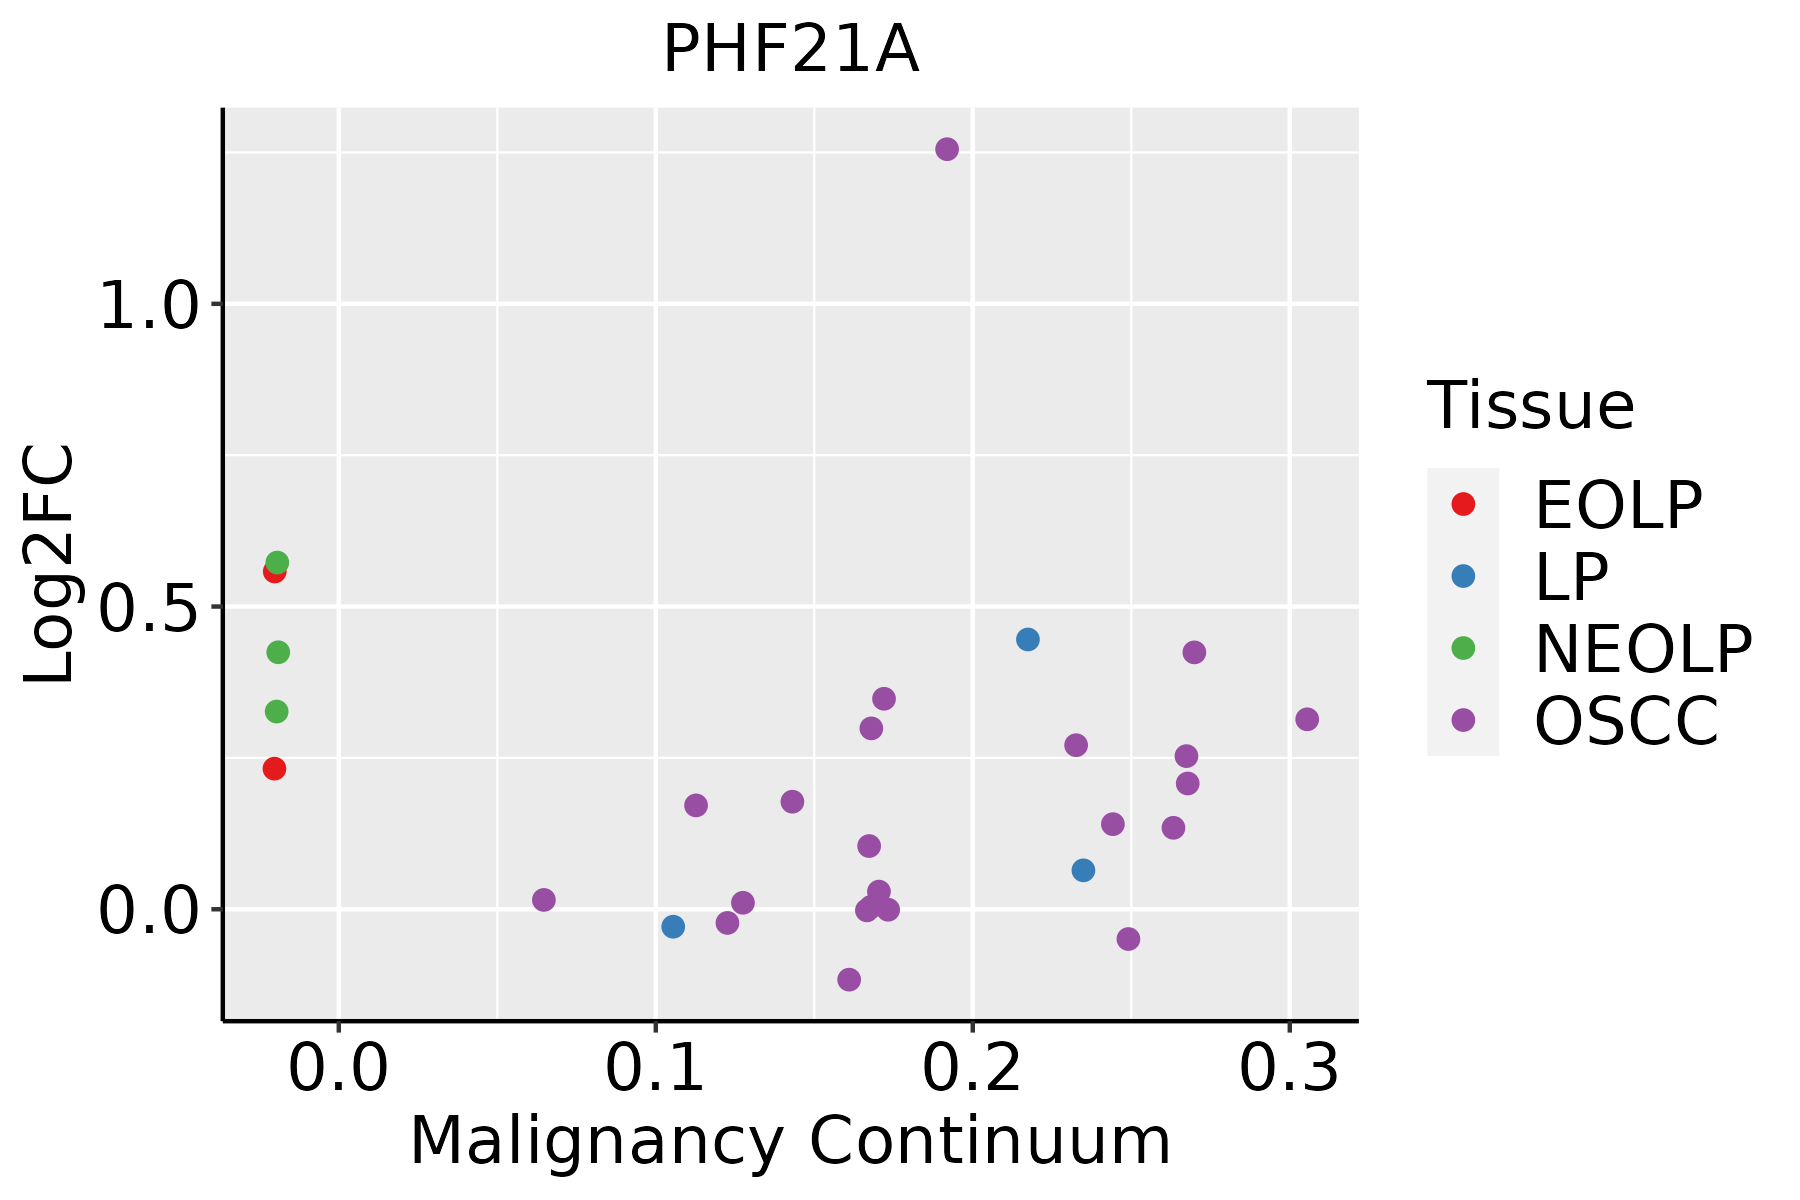 | EOLP: Erosive Oral lichen planus |
| LP: leukoplakia | ||
| NEOLP: Non-erosive oral lichen planus | ||
| OSCC: Oral squamous cell carcinoma | ||
| Prostate | 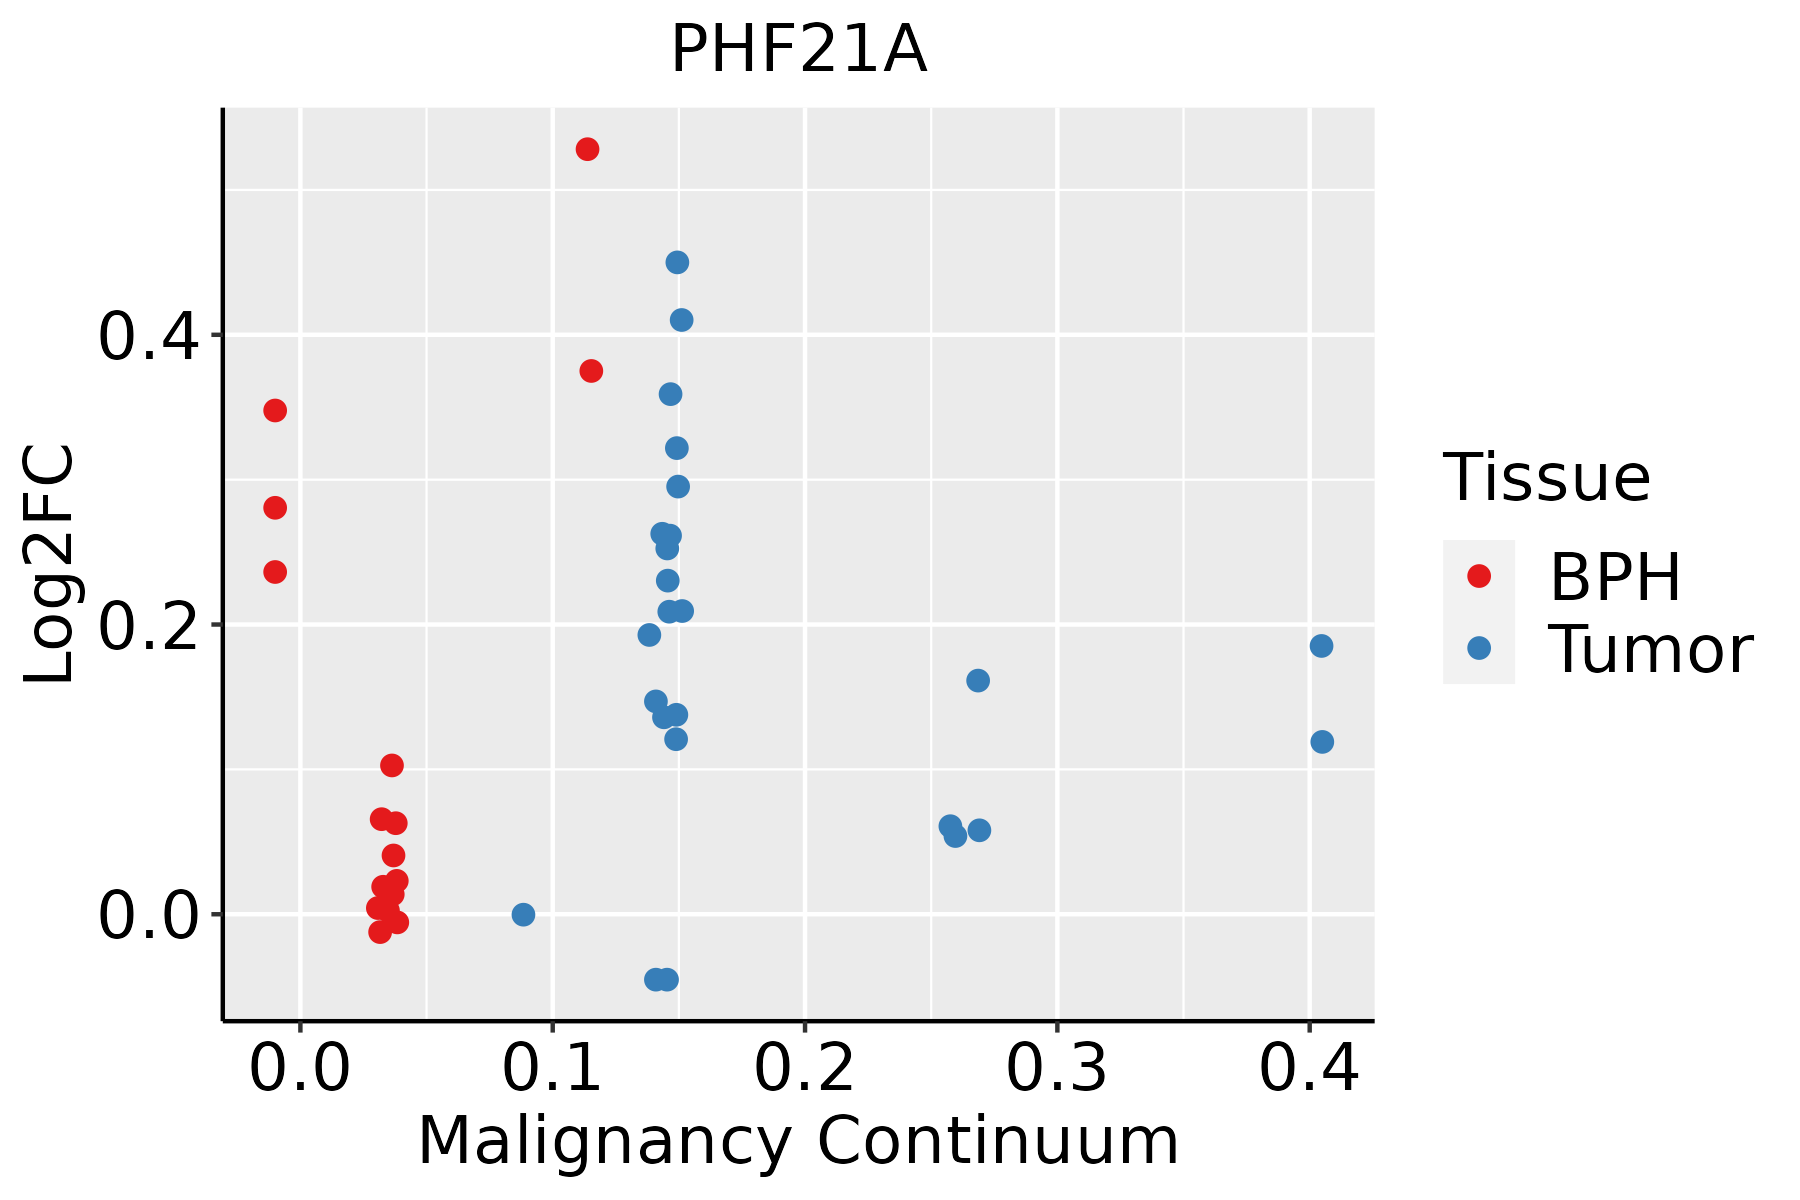 | BPH: Benign Prostatic Hyperplasia |
| Thyroid | 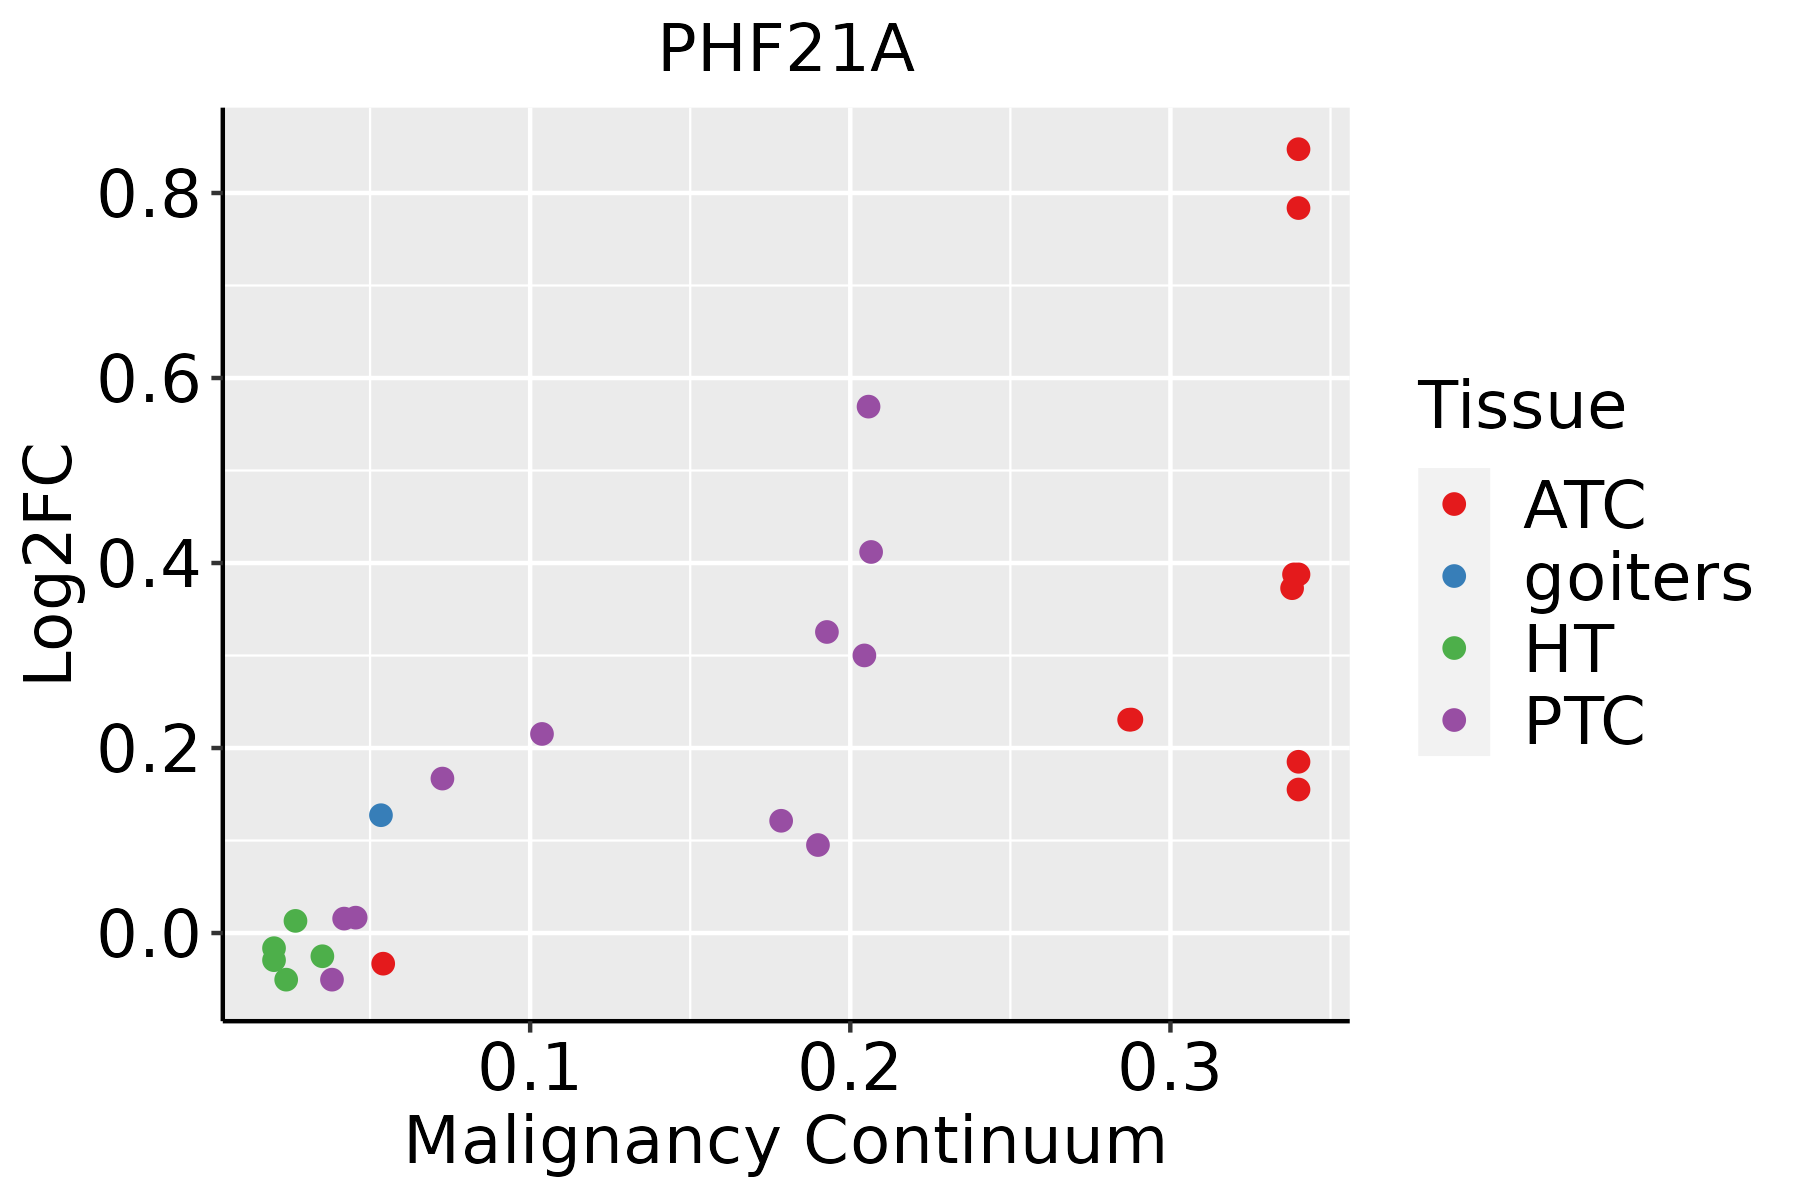 | ATC: Anaplastic thyroid cancer |
| HT: Hashimoto's thyroiditis | ||
| PTC: Papillary thyroid cancer |
| ∗log2FC in expression of this searched gene in stem-like cells from each diseased tissue sample relative to stem-like cells in normal samples in each tissue plotted against the malignancy continuum. Samples are colored based on if they are from different disease stage. |
Top |
Malignant transformation related pathway analysis |
| Find out the enriched GO biological processes and KEGG pathways involved in transition from healthy to precancer to cancer |
| Tissue | Disease Stage | Enriched GO biological Processes |
| Colorectum | AD |  |
| Colorectum | SER |  |
| Colorectum | MSS |  |
| Colorectum | MSI-H |  |
| Colorectum | FAP |  |
| ∗Top 15 enriched GO BP terms are showed in the bar plot of each disease state in each tissue. Each row represents a significant GO biological process which is colored according to the -log10(p.adjust). |
| Page: 1 2 3 4 5 6 7 8 9 |
| GO ID | Tissue | Disease Stage | Description | Gene Ratio | Bg Ratio | pvalue | p.adjust | Count |
| GO:00063257 | Cervix | CC | chromatin organization | 78/2311 | 409/18723 | 5.40e-05 | 8.02e-04 | 78 |
| GO:000632517 | Esophagus | ESCC | chromatin organization | 240/8552 | 409/18723 | 6.52e-08 | 1.14e-06 | 240 |
| GO:00063255 | Liver | NAFLD | chromatin organization | 64/1882 | 409/18723 | 2.31e-04 | 3.89e-03 | 64 |
| GO:000632511 | Liver | HCC | chromatin organization | 206/7958 | 409/18723 | 7.23e-04 | 4.41e-03 | 206 |
| GO:00063256 | Lung | IAC | chromatin organization | 69/2061 | 409/18723 | 2.01e-04 | 3.53e-03 | 69 |
| GO:000632512 | Lung | AIS | chromatin organization | 62/1849 | 409/18723 | 4.24e-04 | 7.29e-03 | 62 |
| GO:000632510 | Oral cavity | OSCC | chromatin organization | 190/7305 | 409/18723 | 1.17e-03 | 5.97e-03 | 190 |
| GO:000632515 | Oral cavity | EOLP | chromatin organization | 84/2218 | 409/18723 | 2.68e-07 | 8.16e-06 | 84 |
| GO:000632521 | Oral cavity | NEOLP | chromatin organization | 70/2005 | 409/18723 | 4.97e-05 | 6.83e-04 | 70 |
| GO:00063259 | Prostate | BPH | chromatin organization | 101/3107 | 409/18723 | 1.52e-05 | 1.94e-04 | 101 |
| GO:000632514 | Prostate | Tumor | chromatin organization | 104/3246 | 409/18723 | 2.02e-05 | 2.62e-04 | 104 |
| GO:000632520 | Thyroid | PTC | chromatin organization | 183/5968 | 409/18723 | 2.55e-08 | 5.70e-07 | 183 |
| GO:0006325110 | Thyroid | ATC | chromatin organization | 189/6293 | 409/18723 | 6.40e-08 | 1.13e-06 | 189 |
| Page: 1 |
| Pathway ID | Tissue | Disease Stage | Description | Gene Ratio | Bg Ratio | pvalue | p.adjust | qvalue | Count |
| Page: 1 |
Top |
Cell-cell communication analysis |
| Identification of potential cell-cell interactions between two cell types and their ligand-receptor pairs for different disease states |
| Ligand | Receptor | LRpair | Pathway | Tissue | Disease Stage |
| Page: 1 |
Top |
Single-cell gene regulatory network inference analysis |
| Find out the significant the regulons (TFs) and the target genes of each regulon across cell types for different disease states |
| TF | Cell Type | Tissue | Disease Stage | Target Gene | RSS | Regulon Activity |
| PHF21A | MDSCs | Oral cavity | ADJ | ST6GALNAC3,GOLGA1,PEX16, etc. | 1.06e-02 |  |
| PHF21A | CD8TEXP | Oral cavity | LP | ST6GALNAC3,GOLGA1,PEX16, etc. | 2.13e-02 |  |
| PHF21A | NK | Oral cavity | LP | ST6GALNAC3,GOLGA1,PEX16, etc. | 2.23e-02 | |
| PHF21A | TH17 | Oral cavity | LP | ST6GALNAC3,GOLGA1,PEX16, etc. | 3.52e-02 | |
| PHF21A | TH17 | Skin | cSCC | PIK3CD,GLG1,MYO5A, etc. | 1.53e-02 |  |
| PHF21A | CD8TEREX | Skin | SCCIS | PIK3CD,GLG1,MYO5A, etc. | 2.23e-02 |  |
| ∗The dot plots of a searched regulon are shown for all cell subpopulations in each disease state of each tissue based on the regulon specific score inferred using pySCENIC and by calculating the average expression. |
| Page: 1 |
Top |
Somatic mutation of malignant transformation related genes |
| Annotation of somatic variants for genes involved in malignant transformation |
| Hugo Symbol | Variant Class | Variant Classification | dbSNP RS | HGVSc | HGVSp | HGVSp Short | SWISSPROT | BIOTYPE | SIFT | PolyPhen | Tumor Sample Barcode | Tissue | Histology | Sex | Age | Stage | Therapy Types | Drugs | Outcome |
| PHF21A | SNV | Missense_Mutation | novel | c.1907C>T | p.Ser636Phe | p.S636F | Q96BD5 | protein_coding | deleterious(0.01) | possibly_damaging(0.876) | TCGA-3C-AALI-01 | Breast | breast invasive carcinoma | Female | <65 | I/II | Unspecific | Poly E | Complete Response |
| PHF21A | SNV | Missense_Mutation | c.985G>C | p.Glu329Gln | p.E329Q | Q96BD5 | protein_coding | tolerated(0.39) | possibly_damaging(0.836) | TCGA-AC-A23H-01 | Breast | breast invasive carcinoma | Female | >=65 | I/II | Unknown | Unknown | PD | |
| PHF21A | insertion | Frame_Shift_Ins | novel | c.1708_1709insCTGCTTTCTCCTCCTCACCATACCTACCCATGGCATGCAGATTT | p.Leu570ProfsTer22 | p.L570Pfs*22 | Q96BD5 | protein_coding | TCGA-B6-A0IC-01 | Breast | breast invasive carcinoma | Female | >=65 | I/II | Unknown | Unknown | SD | ||
| PHF21A | SNV | Missense_Mutation | c.1033N>A | p.Glu345Lys | p.E345K | Q96BD5 | protein_coding | tolerated(0.33) | benign(0.023) | TCGA-DS-A0VL-01 | Cervix | cervical & endocervical cancer | Female | <65 | I/II | Unknown | Unknown | SD | |
| PHF21A | SNV | Missense_Mutation | rs149898933 | c.2012C>T | p.Ala671Val | p.A671V | Q96BD5 | protein_coding | tolerated_low_confidence(1) | benign(0) | TCGA-LP-A5U2-01 | Cervix | cervical & endocervical cancer | Female | <65 | III/IV | Unknown | Unknown | SD |
| PHF21A | SNV | Missense_Mutation | novel | c.817N>C | p.Thr273Pro | p.T273P | Q96BD5 | protein_coding | tolerated(0.2) | benign(0) | TCGA-A6-5665-01 | Colorectum | colon adenocarcinoma | Female | >=65 | I/II | Unknown | Unknown | PD |
| PHF21A | SNV | Missense_Mutation | rs532473580 | c.928N>G | p.Thr310Ala | p.T310A | Q96BD5 | protein_coding | tolerated(0.3) | benign(0) | TCGA-AA-3672-01 | Colorectum | colon adenocarcinoma | Female | >=65 | III/IV | Unknown | Unknown | SD |
| PHF21A | SNV | Missense_Mutation | rs370627435 | c.1868G>A | p.Arg623His | p.R623H | Q96BD5 | protein_coding | tolerated(0.06) | possibly_damaging(0.82) | TCGA-AA-3947-01 | Colorectum | colon adenocarcinoma | Female | <65 | I/II | Unknown | Unknown | SD |
| PHF21A | SNV | Missense_Mutation | novel | c.890C>T | p.Thr297Met | p.T297M | Q96BD5 | protein_coding | deleterious(0.02) | possibly_damaging(0.799) | TCGA-AA-3949-01 | Colorectum | colon adenocarcinoma | Female | >=65 | III/IV | Unknown | Unknown | SD |
| PHF21A | SNV | Missense_Mutation | c.1508N>A | p.Cys503Tyr | p.C503Y | Q96BD5 | protein_coding | deleterious(0) | probably_damaging(1) | TCGA-G4-6588-01 | Colorectum | colon adenocarcinoma | Female | <65 | I/II | Unknown | Unknown | SD |
| Page: 1 2 3 4 5 6 |
Top |
Related drugs of malignant transformation related genes |
| Identification of chemicals and drugs interact with genes involved in malignant transfromation |
| (DGIdb 4.0) |
| Entrez ID | Symbol | Category | Interaction Types | Drug Claim Name | Drug Name | PMIDs |
| Page: 1 |

Copyright 2023-Present -The University of Texas Health Science Center at Houston |