| Tissue | Expression Dynamics | Abbreviation |
| Colorectum (GSE201348) |  | FAP: Familial adenomatous polyposis |
| CRC: Colorectal cancer |
| Colorectum (HTA11) | 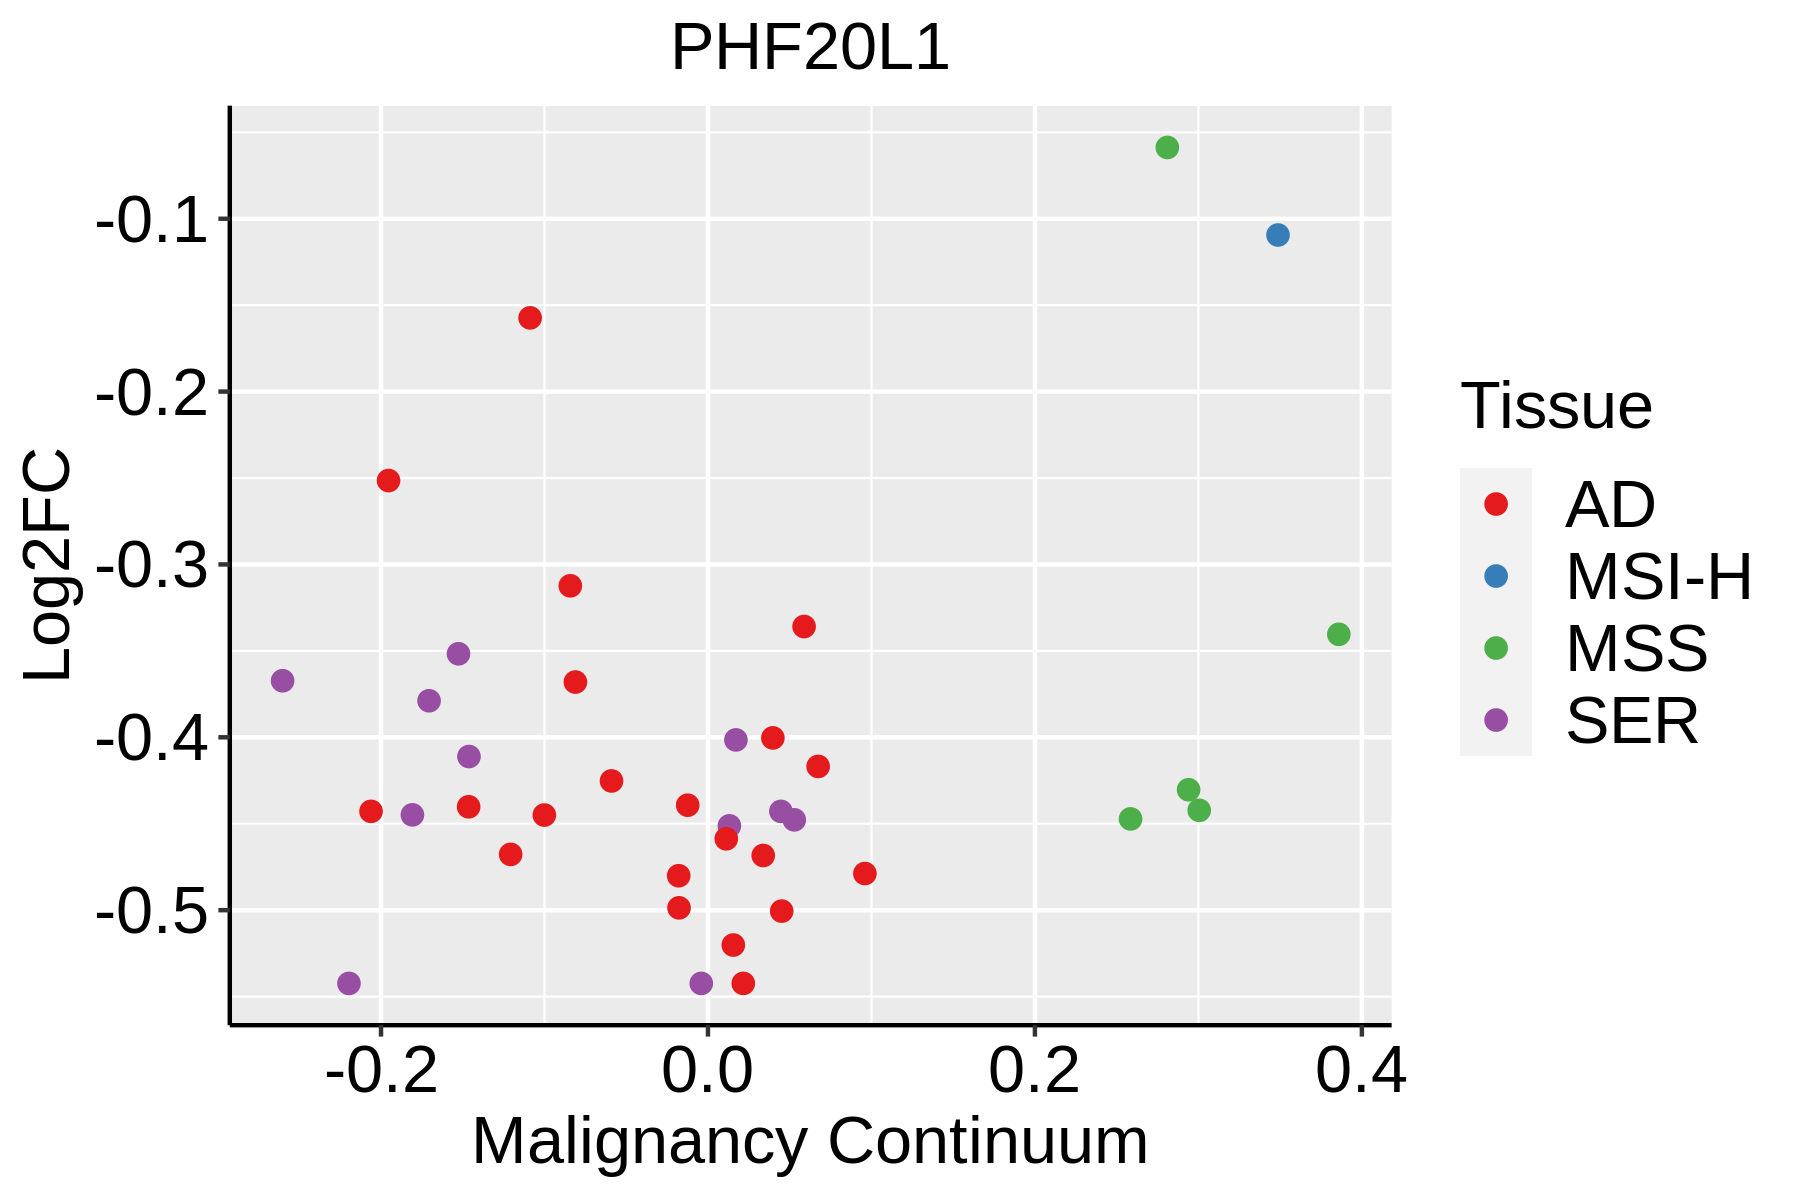 | AD: Adenomas |
| SER: Sessile serrated lesions |
| MSI-H: Microsatellite-high colorectal cancer |
| MSS: Microsatellite stable colorectal cancer |
| Esophagus | 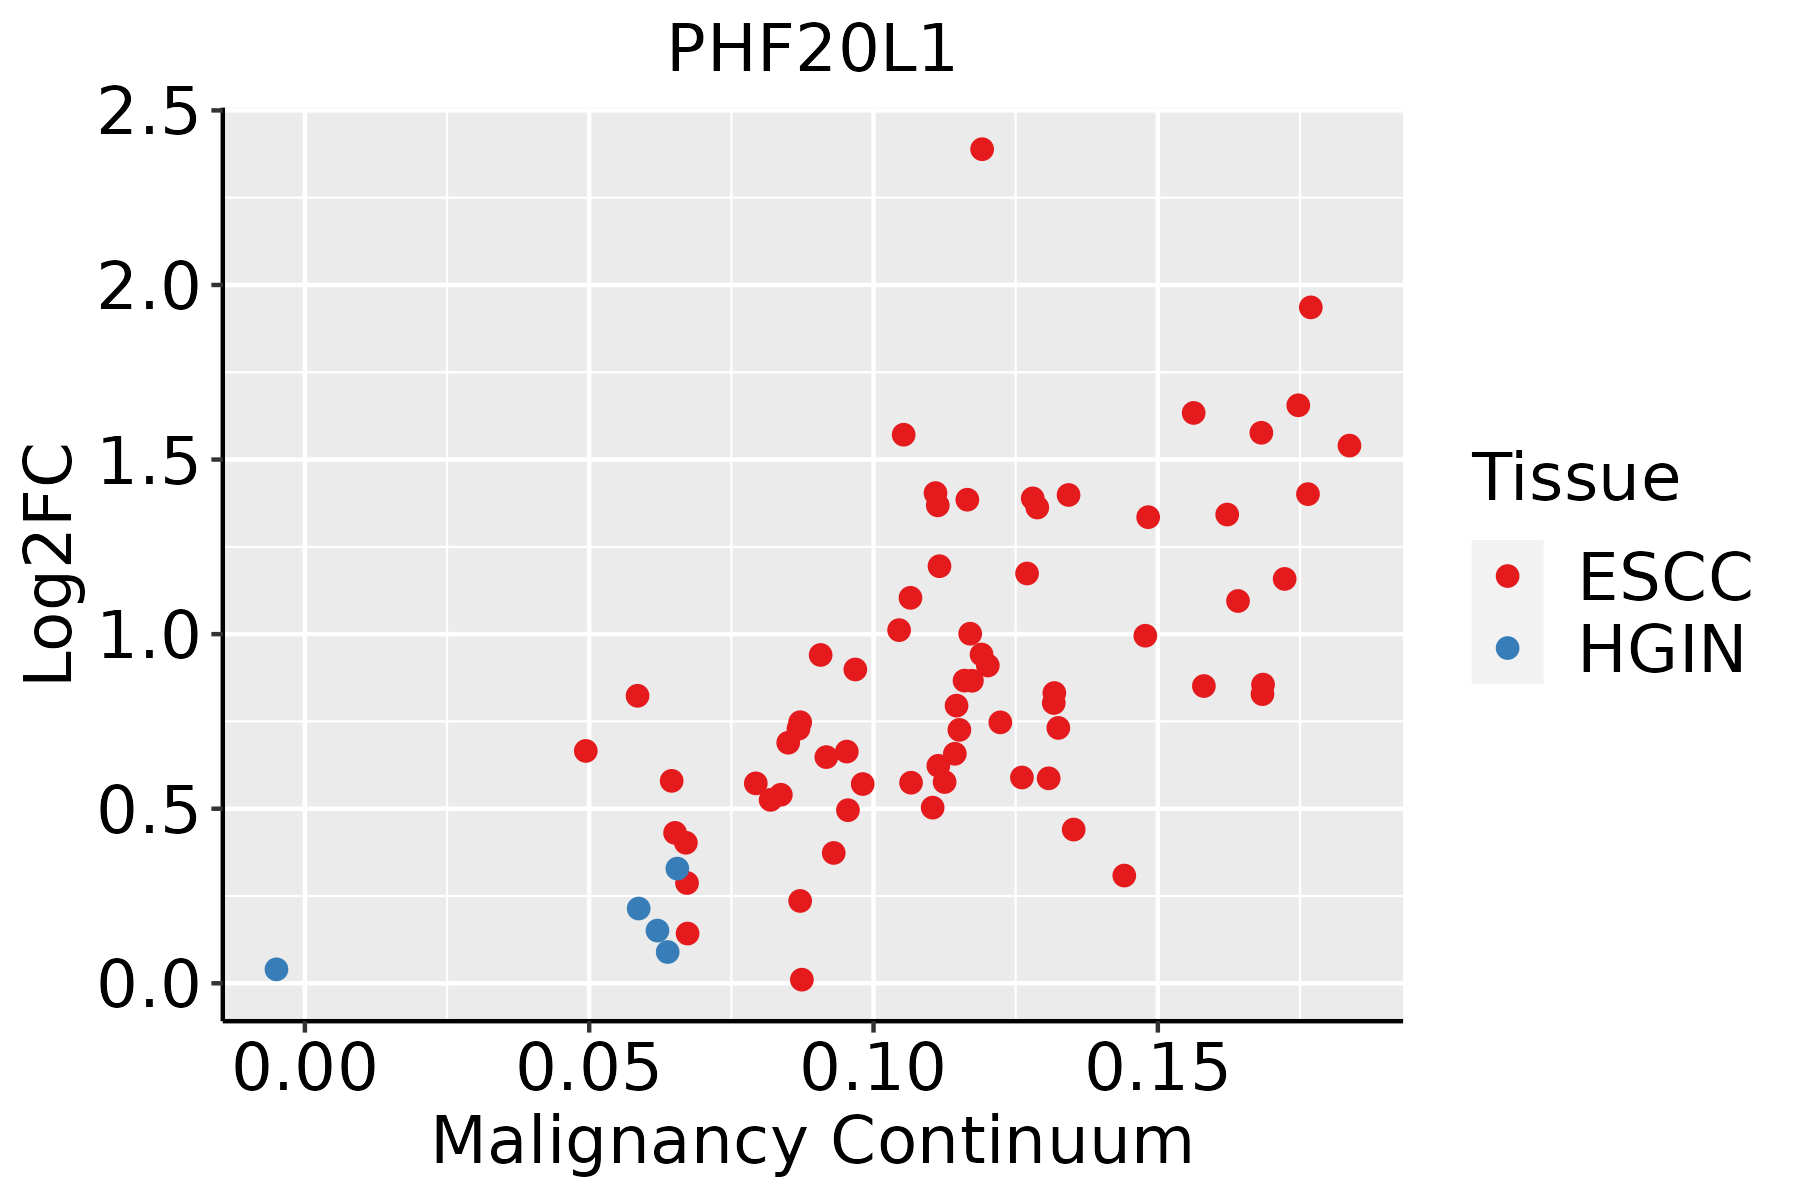 | ESCC: Esophageal squamous cell carcinoma |
| HGIN: High-grade intraepithelial neoplasias |
| LGIN: Low-grade intraepithelial neoplasias |
| Liver | 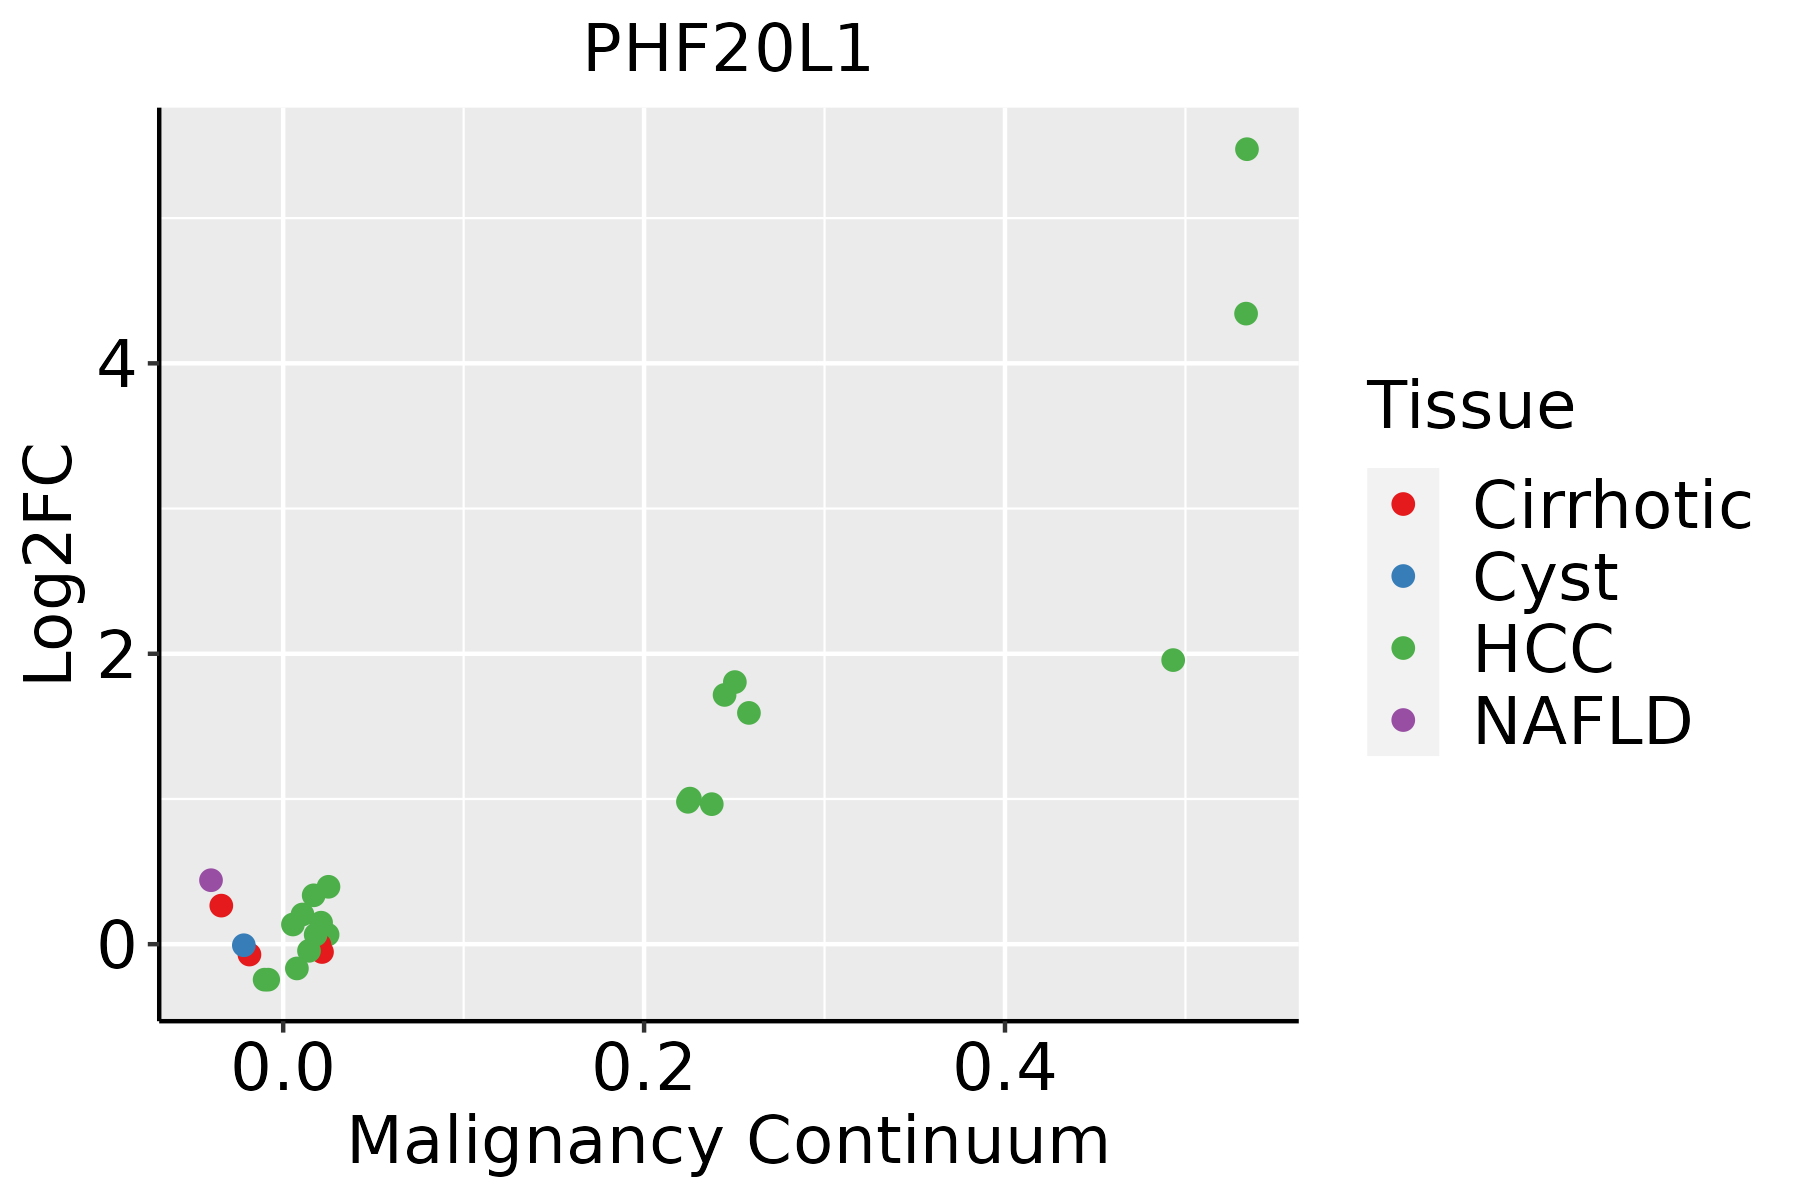 | HCC: Hepatocellular carcinoma |
| NAFLD: Non-alcoholic fatty liver disease |
| Lung |  | AAH: Atypical adenomatous hyperplasia |
| AIS: Adenocarcinoma in situ |
| IAC: Invasive lung adenocarcinoma |
| MIA: Minimally invasive adenocarcinoma |
| Oral Cavity | 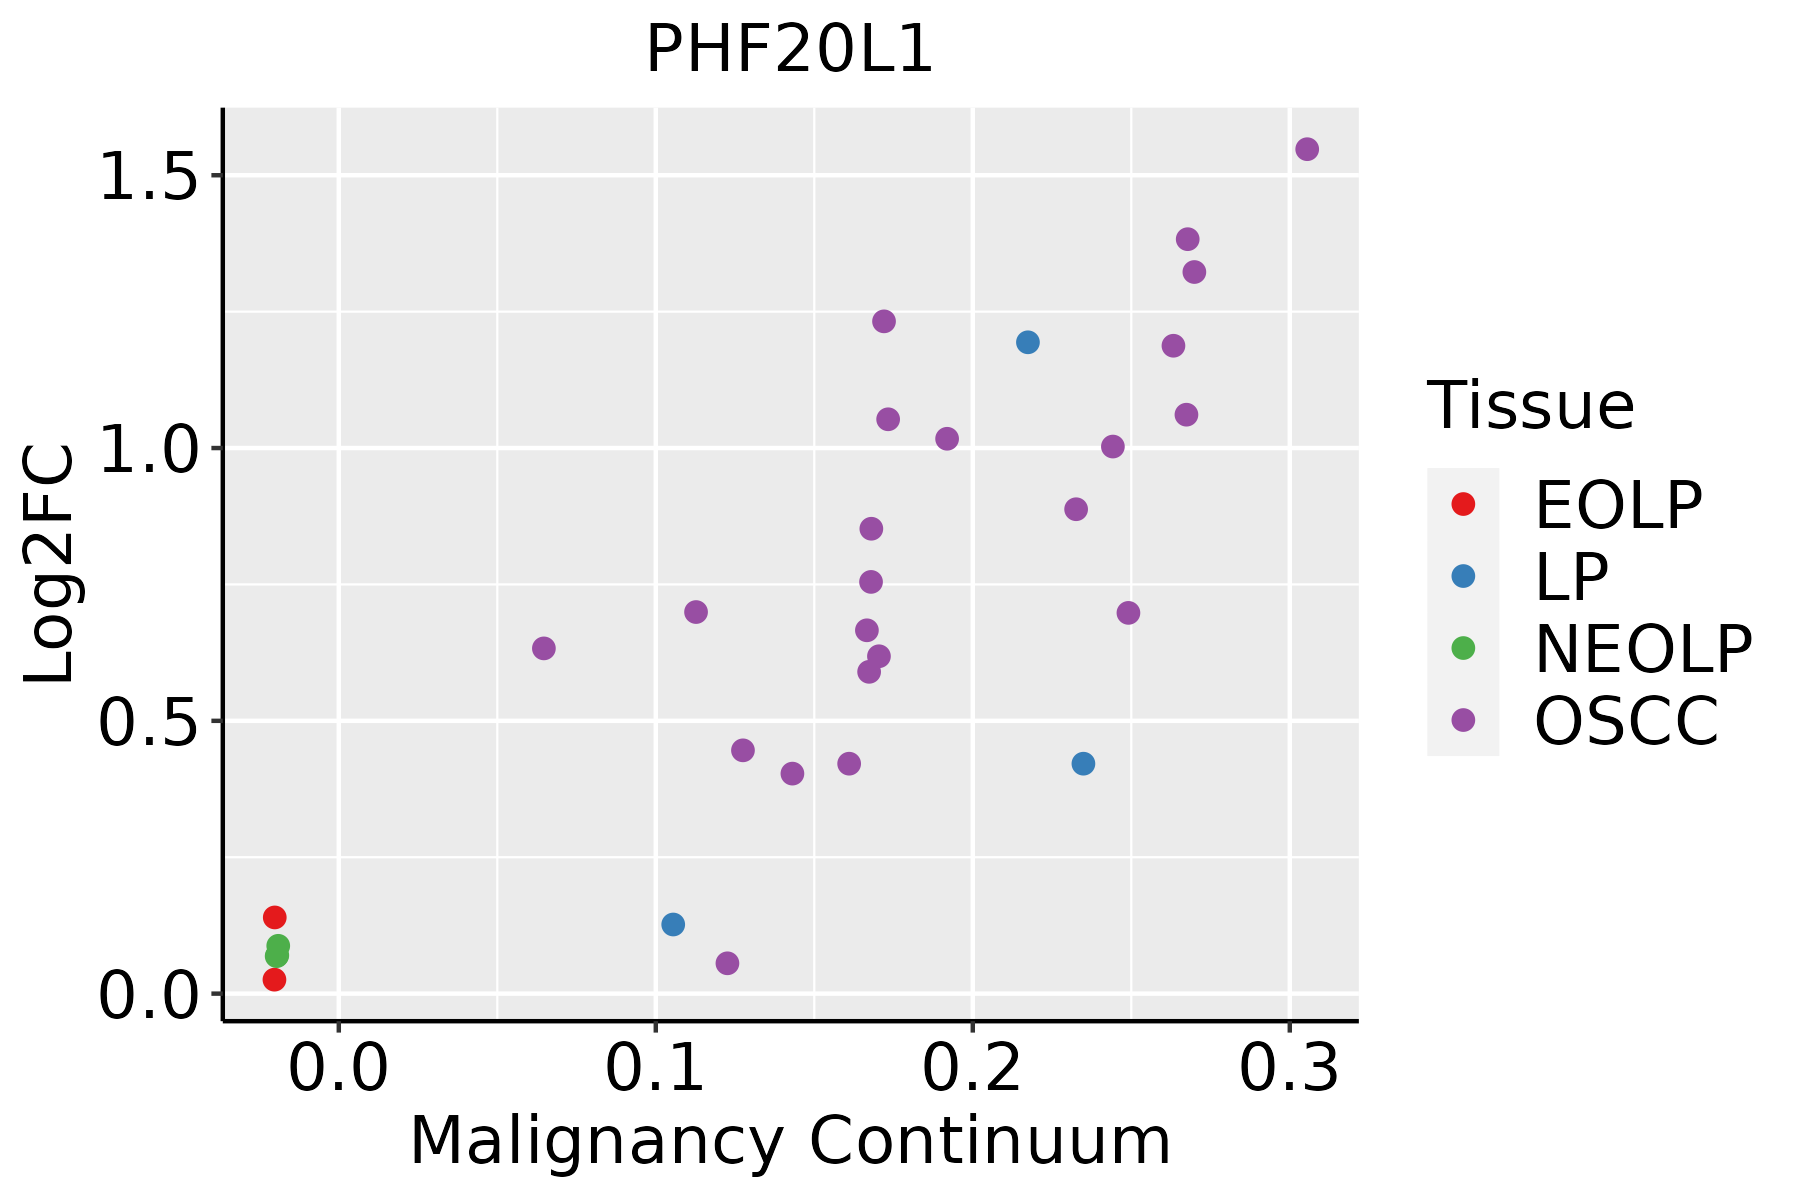 | EOLP: Erosive Oral lichen planus |
| LP: leukoplakia |
| NEOLP: Non-erosive oral lichen planus |
| OSCC: Oral squamous cell carcinoma |
| Prostate | 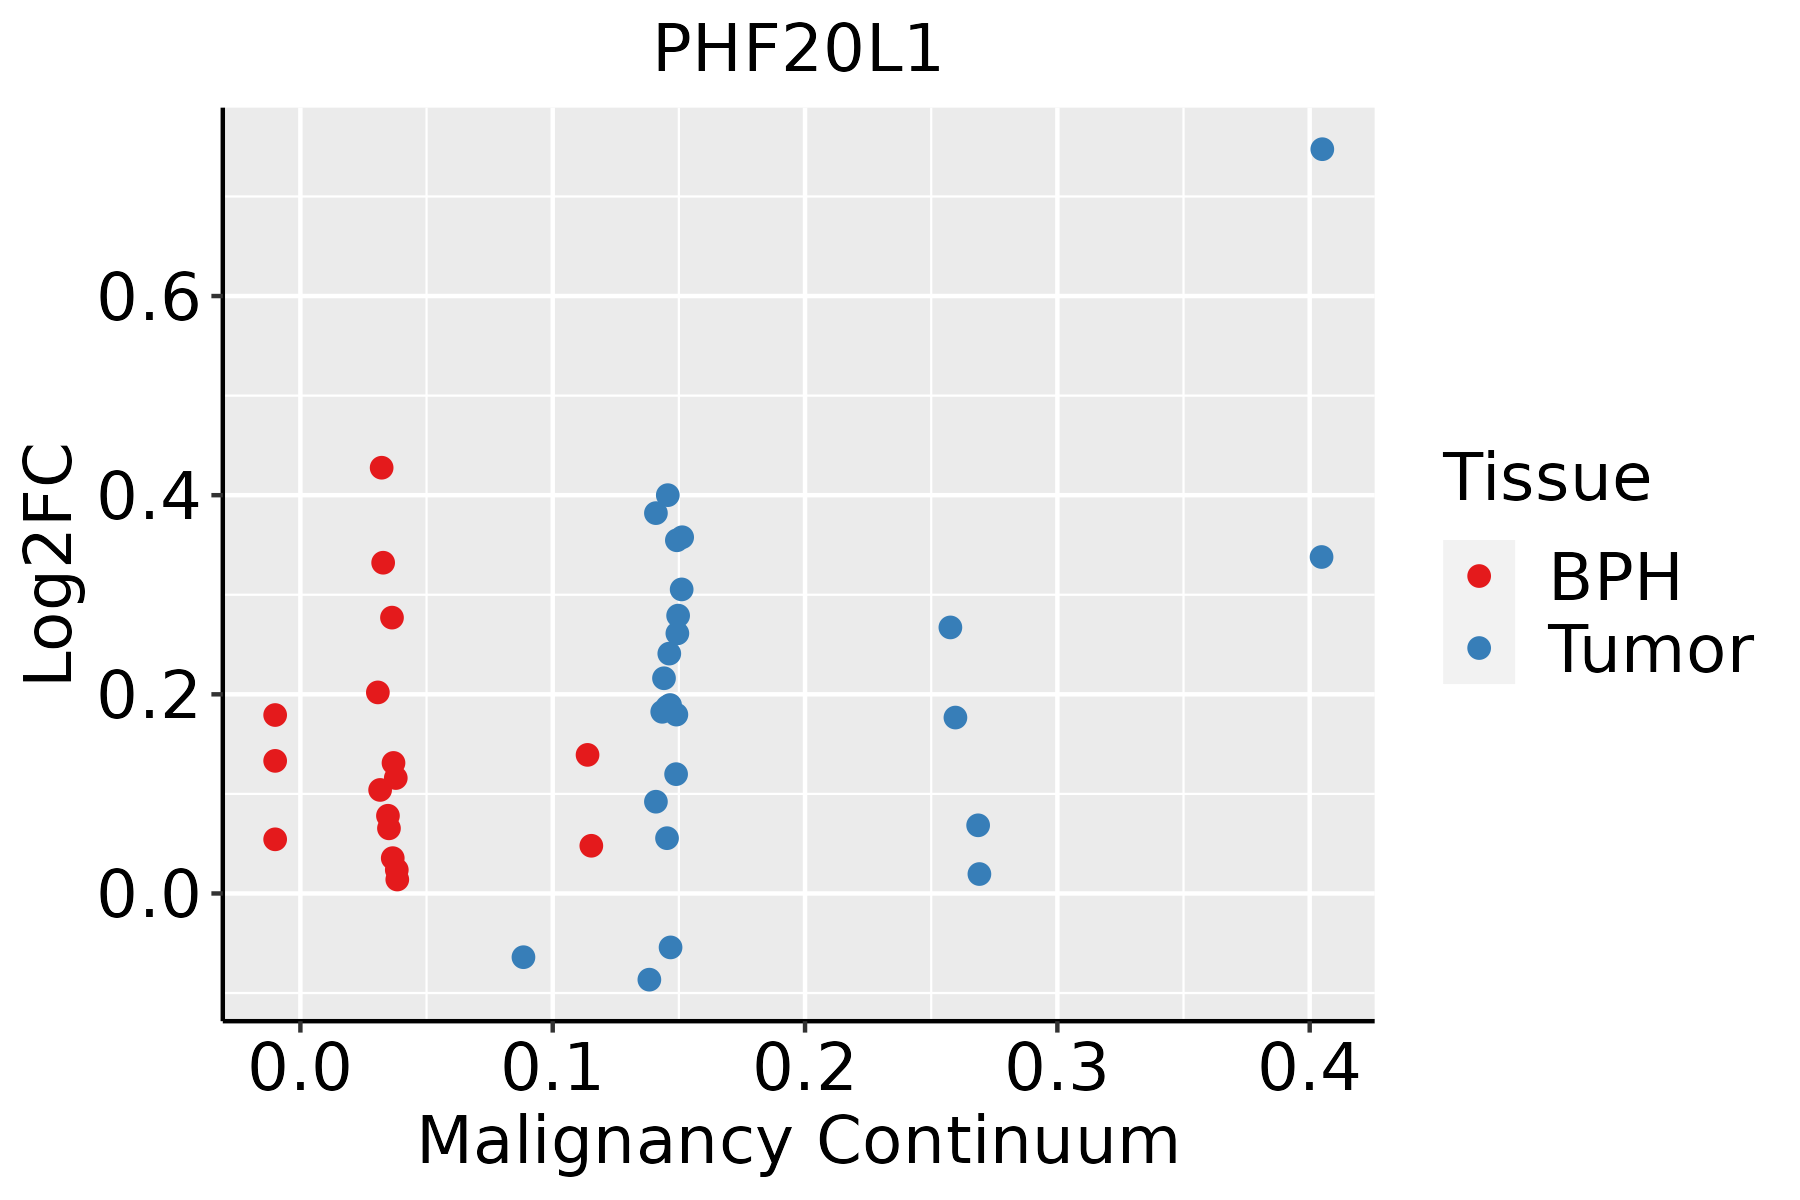 | BPH: Benign Prostatic Hyperplasia |
| Skin |  | AK: Actinic keratosis |
| cSCC: Cutaneous squamous cell carcinoma |
| SCCIS:squamous cell carcinoma in situ |
| Thyroid | 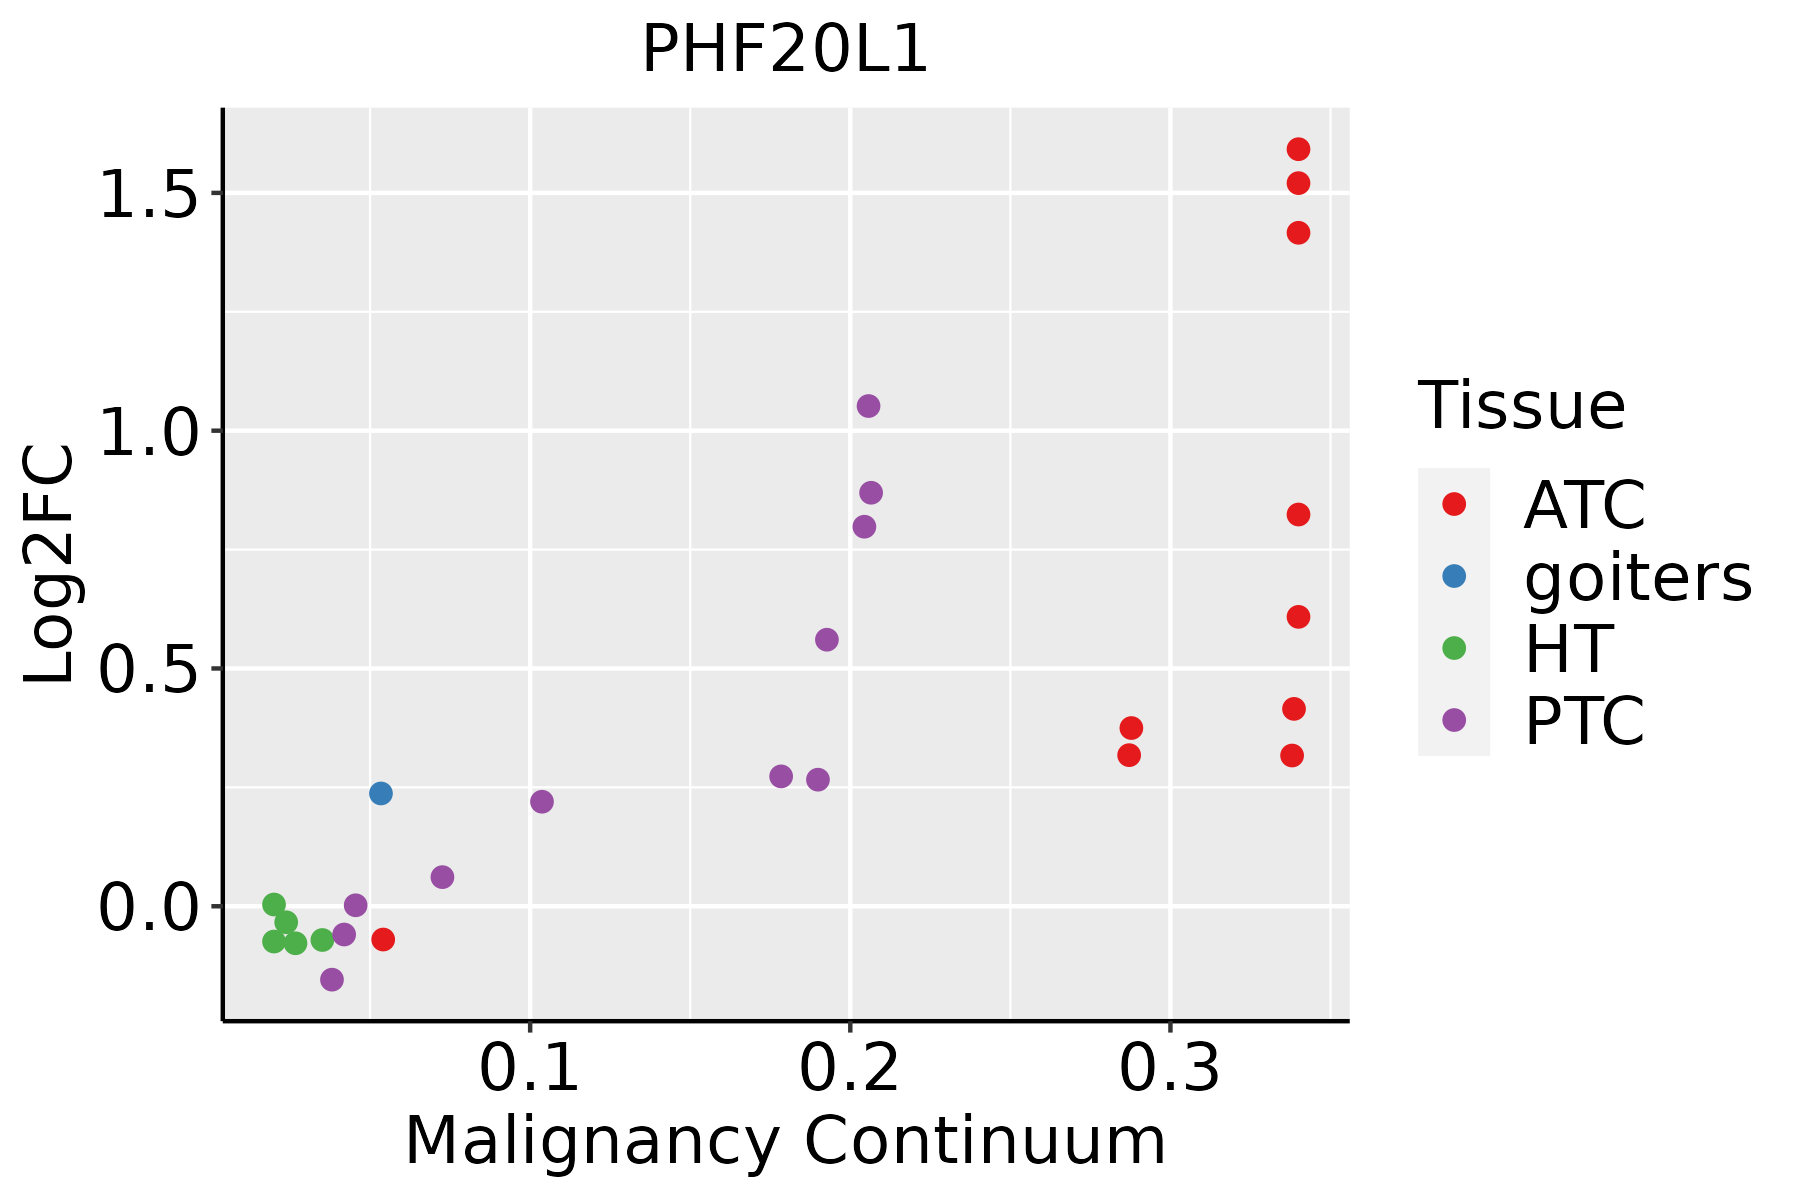 | ATC: Anaplastic thyroid cancer |
| HT: Hashimoto's thyroiditis |
| PTC: Papillary thyroid cancer |
| GO ID | Tissue | Disease Stage | Description | Gene Ratio | Bg Ratio | pvalue | p.adjust | Count |
| GO:0016570 | Colorectum | MSS | histone modification | 113/3467 | 463/18723 | 8.37e-04 | 8.68e-03 | 113 |
| GO:00165701 | Colorectum | FAP | histone modification | 94/2622 | 463/18723 | 1.06e-04 | 1.76e-03 | 94 |
| GO:00165702 | Colorectum | CRC | histone modification | 75/2078 | 463/18723 | 4.95e-04 | 7.06e-03 | 75 |
| GO:00182057 | Esophagus | HGIN | peptidyl-lysine modification | 88/2587 | 376/18723 | 2.99e-07 | 1.39e-05 | 88 |
| GO:00165708 | Esophagus | HGIN | histone modification | 92/2587 | 463/18723 | 1.70e-04 | 3.30e-03 | 92 |
| GO:00064735 | Esophagus | HGIN | protein acetylation | 45/2587 | 201/18723 | 6.17e-04 | 8.58e-03 | 45 |
| GO:00183945 | Esophagus | HGIN | peptidyl-lysine acetylation | 39/2587 | 169/18723 | 7.46e-04 | 9.90e-03 | 39 |
| GO:00435435 | Esophagus | HGIN | protein acylation | 51/2587 | 243/18723 | 1.33e-03 | 1.57e-02 | 51 |
| GO:00064755 | Esophagus | HGIN | internal protein amino acid acetylation | 36/2587 | 160/18723 | 1.87e-03 | 2.01e-02 | 36 |
| GO:00183935 | Esophagus | HGIN | internal peptidyl-lysine acetylation | 35/2587 | 158/18723 | 2.82e-03 | 2.75e-02 | 35 |
| GO:001657015 | Esophagus | ESCC | histone modification | 323/8552 | 463/18723 | 2.61e-26 | 7.88e-24 | 323 |
| GO:001820514 | Esophagus | ESCC | peptidyl-lysine modification | 259/8552 | 376/18723 | 3.90e-20 | 5.26e-18 | 259 |
| GO:001839413 | Esophagus | ESCC | peptidyl-lysine acetylation | 123/8552 | 169/18723 | 6.58e-13 | 2.94e-11 | 123 |
| GO:004354313 | Esophagus | ESCC | protein acylation | 165/8552 | 243/18723 | 1.69e-12 | 7.14e-11 | 165 |
| GO:000647313 | Esophagus | ESCC | protein acetylation | 140/8552 | 201/18723 | 4.37e-12 | 1.69e-10 | 140 |
| GO:001839313 | Esophagus | ESCC | internal peptidyl-lysine acetylation | 114/8552 | 158/18723 | 1.16e-11 | 4.24e-10 | 114 |
| GO:000647513 | Esophagus | ESCC | internal protein amino acid acetylation | 115/8552 | 160/18723 | 1.43e-11 | 5.08e-10 | 115 |
| GO:00165735 | Esophagus | ESCC | histone acetylation | 110/8552 | 152/18723 | 1.95e-11 | 6.81e-10 | 110 |
| GO:00165703 | Liver | NAFLD | histone modification | 90/1882 | 463/18723 | 5.74e-10 | 1.28e-07 | 90 |
| GO:0018205 | Liver | NAFLD | peptidyl-lysine modification | 65/1882 | 376/18723 | 9.42e-06 | 3.02e-04 | 65 |
| Hugo Symbol | Variant Class | Variant Classification | dbSNP RS | HGVSc | HGVSp | HGVSp Short | SWISSPROT | BIOTYPE | SIFT | PolyPhen | Tumor Sample Barcode | Tissue | Histology | Sex | Age | Stage | Therapy Types | Drugs | Outcome |
| PHF20L1 | SNV | Missense_Mutation | | c.725N>A | p.Leu242His | p.L242H | A8MW92 | protein_coding | deleterious_low_confidence(0.01) | probably_damaging(0.936) | TCGA-A2-A0CT-01 | Breast | breast invasive carcinoma | Female | >=65 | I/II | Chemotherapy | cytoxan | SD |
| PHF20L1 | SNV | Missense_Mutation | | c.2449N>G | p.Gln817Glu | p.Q817E | A8MW92 | protein_coding | tolerated(0.33) | benign(0) | TCGA-A2-A0YK-01 | Breast | breast invasive carcinoma | Female | <65 | I/II | Chemotherapy | cytoxan | SD |
| PHF20L1 | SNV | Missense_Mutation | novel | c.2073N>T | p.Glu691Asp | p.E691D | A8MW92 | protein_coding | deleterious(0) | probably_damaging(0.992) | TCGA-AN-A046-01 | Breast | breast invasive carcinoma | Female | >=65 | I/II | Unknown | Unknown | SD |
| PHF20L1 | SNV | Missense_Mutation | | c.2588N>G | p.Tyr863Cys | p.Y863C | A8MW92 | protein_coding | deleterious(0) | probably_damaging(0.995) | TCGA-AN-A046-01 | Breast | breast invasive carcinoma | Female | >=65 | I/II | Unknown | Unknown | SD |
| PHF20L1 | SNV | Missense_Mutation | novel | c.2413N>G | p.Leu805Val | p.L805V | A8MW92 | protein_coding | deleterious(0) | probably_damaging(0.967) | TCGA-AR-A0TU-01 | Breast | breast invasive carcinoma | Female | <65 | I/II | Unspecific | Doxorubicin | SD |
| PHF20L1 | SNV | Missense_Mutation | novel | c.907N>A | p.Glu303Lys | p.E303K | A8MW92 | protein_coding | deleterious(0.02) | benign(0.072) | TCGA-BH-A0B6-01 | Breast | breast invasive carcinoma | Female | <65 | I/II | Unknown | Unknown | SD |
| PHF20L1 | SNV | Missense_Mutation | | c.886N>A | p.Glu296Lys | p.E296K | A8MW92 | protein_coding | tolerated(0.15) | benign(0.226) | TCGA-C8-A274-01 | Breast | breast invasive carcinoma | Female | <65 | I/II | Hormone Therapy | tamoxiphen | SD |
| PHF20L1 | SNV | Missense_Mutation | | c.2132N>A | p.Gly711Glu | p.G711E | A8MW92 | protein_coding | deleterious(0) | probably_damaging(1) | TCGA-D8-A13Z-01 | Breast | breast invasive carcinoma | Female | <65 | I/II | Chemotherapy | doxorubicine | SD |
| PHF20L1 | SNV | Missense_Mutation | | c.1927N>C | p.Phe643Leu | p.F643L | A8MW92 | protein_coding | tolerated(0.09) | benign(0.223) | TCGA-EW-A2FS-01 | Breast | breast invasive carcinoma | Female | <65 | I/II | Hormone Therapy | goserelin | SD |
| PHF20L1 | SNV | Missense_Mutation | novel | c.2656N>C | p.Asp886His | p.D886H | A8MW92 | protein_coding | deleterious(0.01) | possibly_damaging(0.541) | TCGA-OL-A5RW-01 | Breast | breast invasive carcinoma | Female | <65 | I/II | Chemotherapy | adriamycin | CR |


