Schematic overview of the cellular and molecular mechanisms involved in the cancer progression, including the proposed cellular and molecular mechanisms in cancer cells trajectory. AT1: alveolar type 1 cells; AT2: alveolar type 2 cells; AAH: atypical adenomatous hyperplasia; AIS: adenocarcinoma in situ; MIA: minimally invasive adenocarcinoma; IA: invasive adenocarcinoma; EMT: epithelial-mesenchymal transition

Home

Download

Statistics

Help

Contact

Center for Computational Systems Medicine
leaf

Gene summary

leaf

Malignant transformation analysis

leaf

Malignant transformation related pathway analysis

leaf

Cell-cell communication analysis

leaf

Single-cell gene regulatory network inference analysis

leaf

Somatic mutation of malignant transformation related genes

leaf

Related drugs of malignant transformation related genes

Gene: PHF20

Gene summary for PHF20

check button Gene summary.

Gene informationSpeciesHuman
Gene symbol

PHF20

Gene ID

51230

Gene namePHD finger protein 20
Gene AliasC20orf104
Cytomap20q11.22-q11.23
Gene Typeprotein-coding
GO ID

GO:0006139

UniProtAcc

Q9BVI0


Top

Malignant transformation analysis

check button Identification of the aberrant gene expression in precancerous and cancerous lesions by comparing the gene expression of stem-like cells in diseased tissues with normal stem cells
check button Malignant transformation involving gene list.
Entrez IDSymbolReplicatesSpeciesOrganTissueAdj P-valueLog2FCMalignancy
51230PHF20AEH-subject2HumanEndometriumAEH3.91e-053.04e-03-0.2525
51230PHF20EEC-subject1HumanEndometriumEEC6.03e-041.04e-01-0.2682
51230PHF20EEC-subject3HumanEndometriumEEC5.94e-082.21e-02-0.2525
51230PHF20GSM6177620_NYU_UCEC1_lib1_lib1HumanEndometriumEEC3.37e-15-8.38e-02-0.1869
51230PHF20GSM6177620_NYU_UCEC1_lib2_lib2HumanEndometriumEEC2.34e-17-1.71e-01-0.1875
51230PHF20GSM6177620_NYU_UCEC1_lib3_lib3HumanEndometriumEEC1.83e-18-1.37e-01-0.1883
51230PHF20GSM6177621_NYU_UCEC2_lib1_lib1HumanEndometriumEEC1.03e-14-1.01e-01-0.1934
51230PHF20GSM6177622_NYU_UCEC3_lib1_lib1HumanEndometriumEEC9.25e-24-8.07e-02-0.1917
51230PHF20GSM6177622_NYU_UCEC3_lib2_lib2HumanEndometriumEEC2.09e-21-1.40e-01-0.1916
51230PHF20GSM6177623_NYU_UCEC3_VisHumanEndometriumEEC4.76e-04-1.04e-01-0.1269
51230PHF20LZE2THumanEsophagusESCC4.64e-021.70e-010.082
51230PHF20LZE4THumanEsophagusESCC1.19e-265.85e-010.0811
51230PHF20LZE5THumanEsophagusESCC1.67e-025.99e-010.0514
51230PHF20LZE7THumanEsophagusESCC6.81e-146.96e-010.0667
51230PHF20LZE8THumanEsophagusESCC7.21e-082.09e-010.067
51230PHF20LZE20THumanEsophagusESCC1.16e-102.71e-010.0662
51230PHF20LZE22D1HumanEsophagusHGIN6.53e-031.54e-010.0595
51230PHF20LZE22THumanEsophagusESCC4.25e-114.70e-010.068
51230PHF20LZE24THumanEsophagusESCC3.02e-268.74e-010.0596
51230PHF20LZE21THumanEsophagusESCC1.09e-051.16e-010.0655
Page: 1 2 3 4 5 6 7 8 

check button Transcriptomic changes along malignancy continuum.
TissueExpression DynamicsAbbreviation
EndometriumThe image shows the transcriptomic changes along malignancy continuum.log2FC in expression of this searched gene in stem-like cells from each diseased tissue sample relative to stem-like cells in normal samples in each tissue plotted against the malignancy continuum. Samples are colored based on if they are from different disease stage.
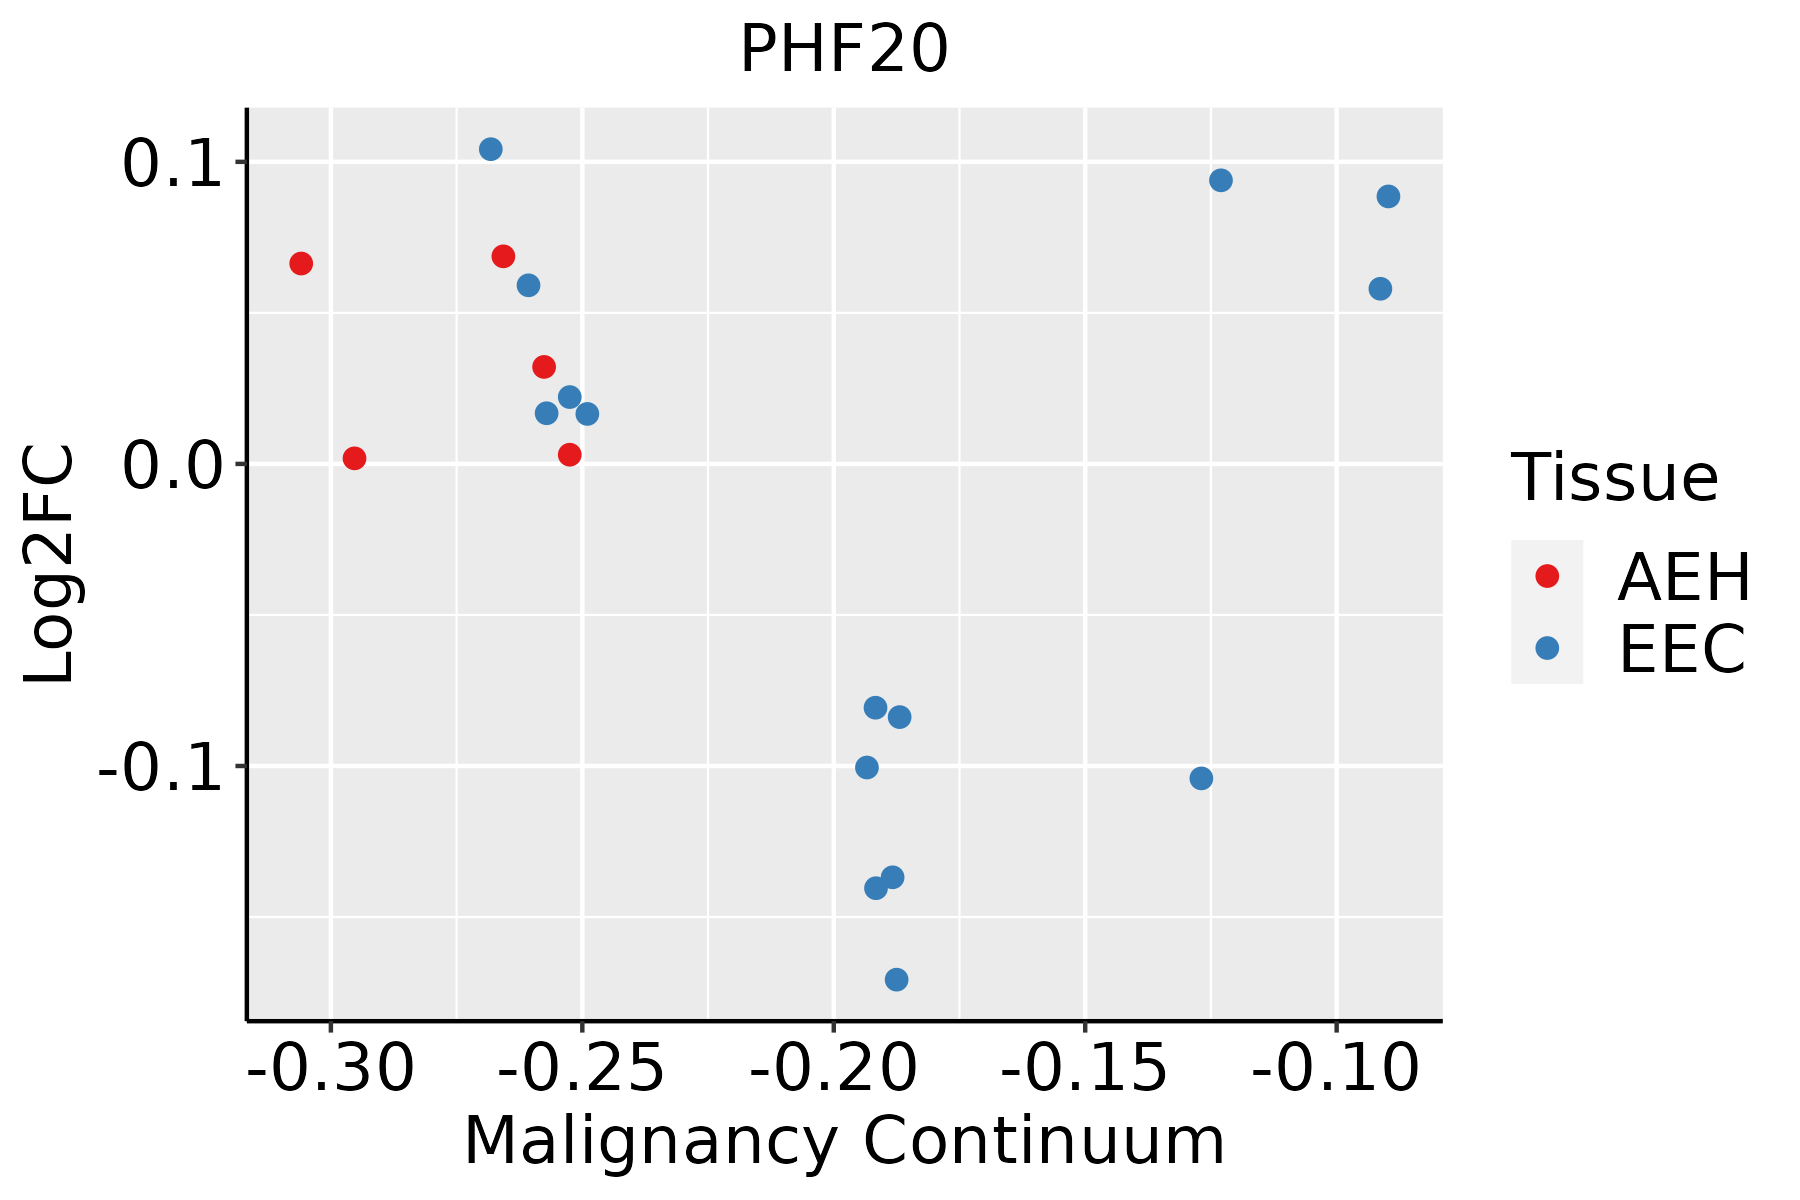
AEH: Atypical endometrial hyperplasia
EEC: Endometrioid Cancer
EsophagusThe image shows the transcriptomic changes along malignancy continuum.log2FC in expression of this searched gene in stem-like cells from each diseased tissue sample relative to stem-like cells in normal samples in each tissue plotted against the malignancy continuum. Samples are colored based on if they are from different disease stage.
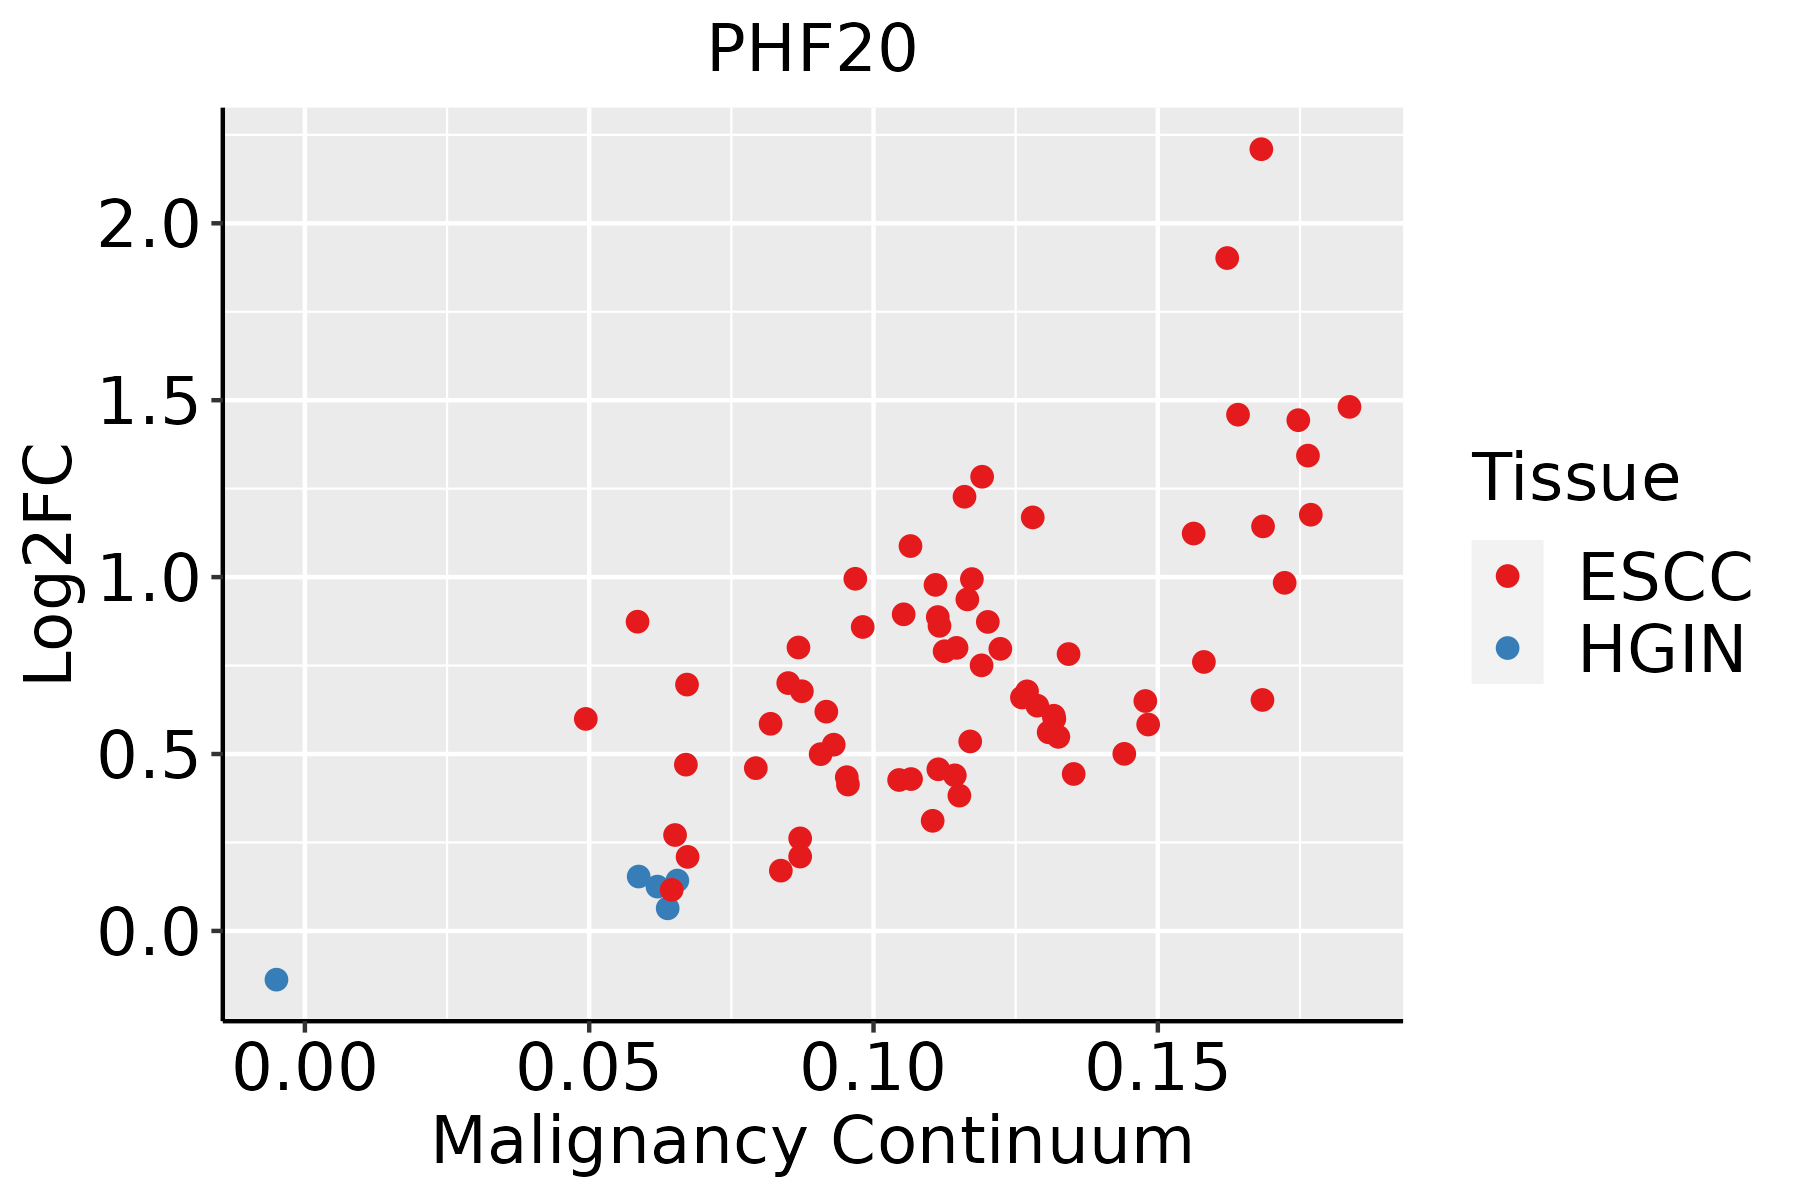
ESCC: Esophageal squamous cell carcinoma
HGIN: High-grade intraepithelial neoplasias
LGIN: Low-grade intraepithelial neoplasias
LiverThe image shows the transcriptomic changes along malignancy continuum.log2FC in expression of this searched gene in stem-like cells from each diseased tissue sample relative to stem-like cells in normal samples in each tissue plotted against the malignancy continuum. Samples are colored based on if they are from different disease stage.HCC: Hepatocellular carcinoma
NAFLD: Non-alcoholic fatty liver disease
LungThe image shows the transcriptomic changes along malignancy continuum.log2FC in expression of this searched gene in stem-like cells from each diseased tissue sample relative to stem-like cells in normal samples in each tissue plotted against the malignancy continuum. Samples are colored based on if they are from different disease stage.
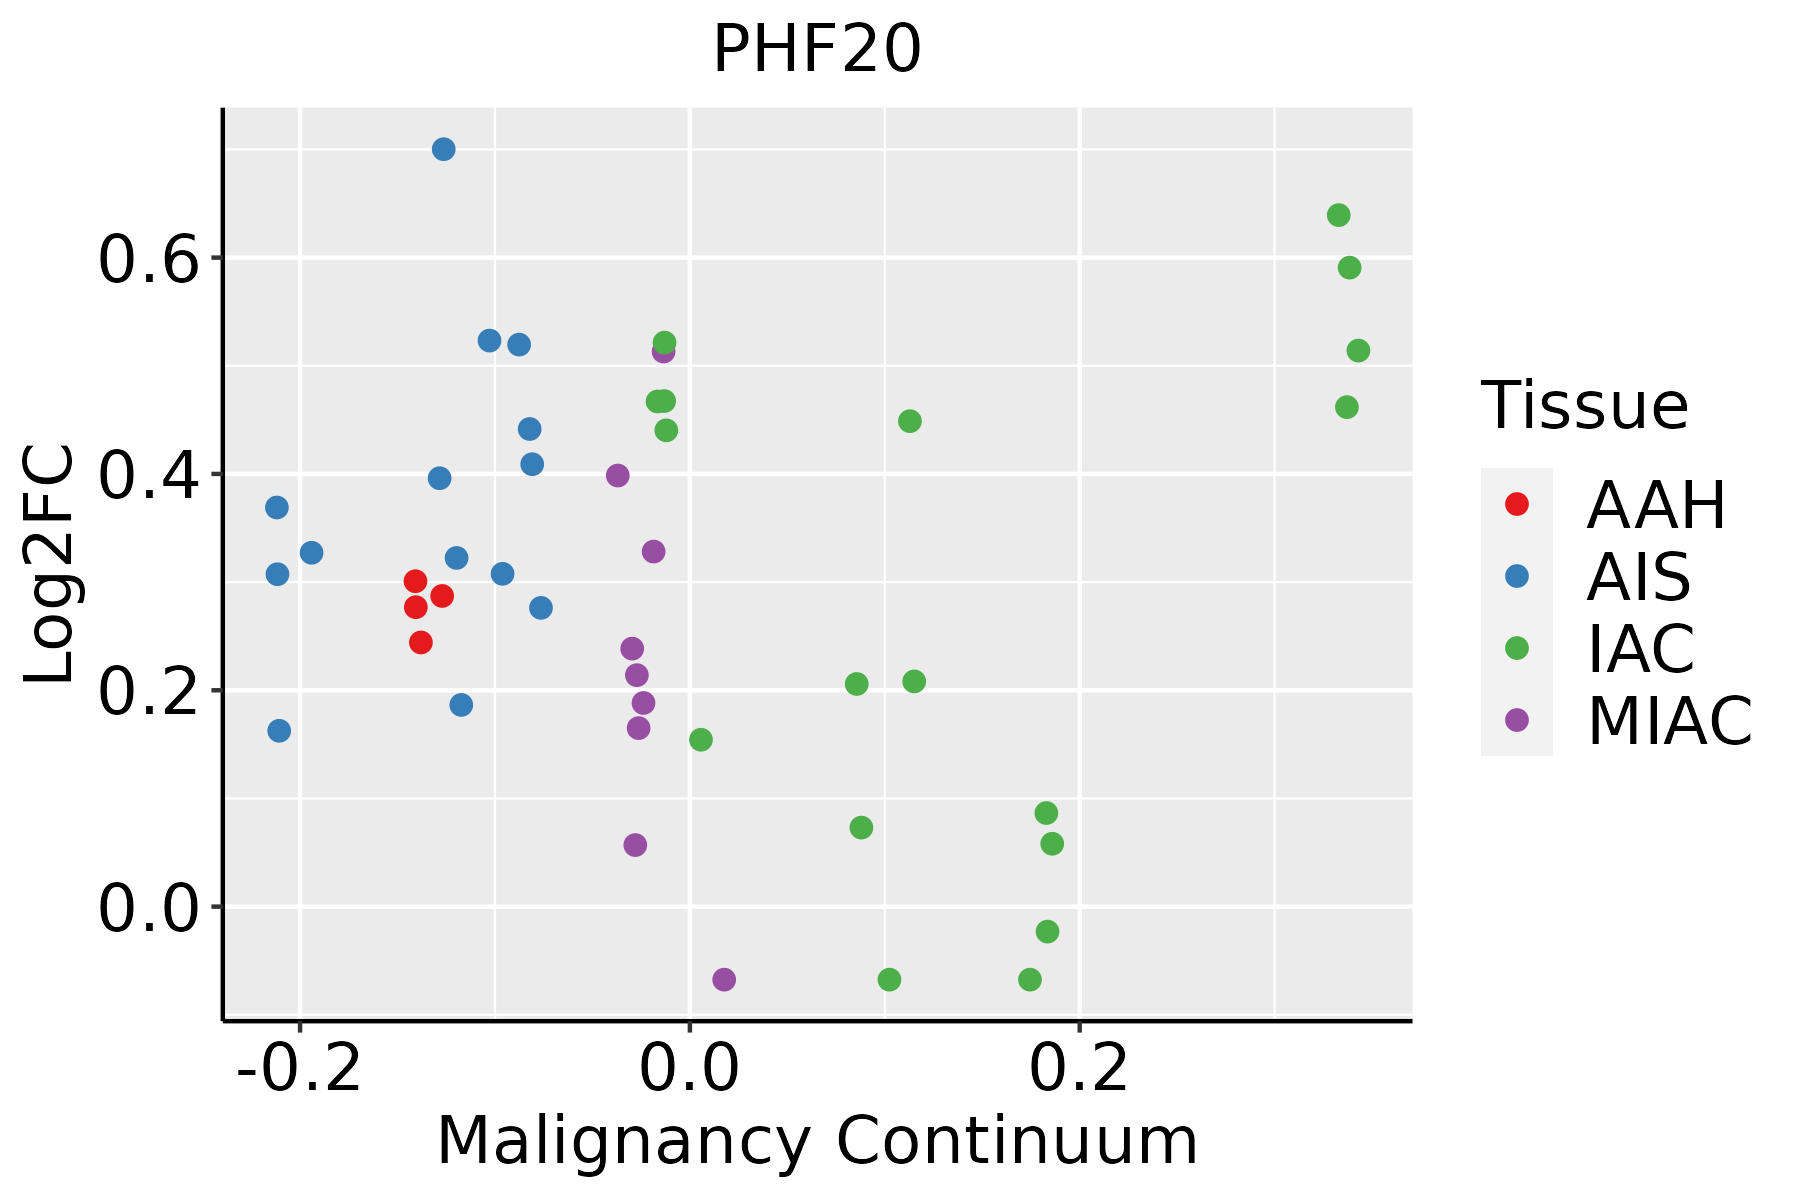
AAH: Atypical adenomatous hyperplasia
AIS: Adenocarcinoma in situ
IAC: Invasive lung adenocarcinoma
MIA: Minimally invasive adenocarcinoma
Oral CavityThe image shows the transcriptomic changes along malignancy continuum.log2FC in expression of this searched gene in stem-like cells from each diseased tissue sample relative to stem-like cells in normal samples in each tissue plotted against the malignancy continuum. Samples are colored based on if they are from different disease stage.EOLP: Erosive Oral lichen planus
LP: leukoplakia
NEOLP: Non-erosive oral lichen planus
OSCC: Oral squamous cell carcinoma
ProstateThe image shows the transcriptomic changes along malignancy continuum.log2FC in expression of this searched gene in stem-like cells from each diseased tissue sample relative to stem-like cells in normal samples in each tissue plotted against the malignancy continuum. Samples are colored based on if they are from different disease stage.BPH: Benign Prostatic Hyperplasia
ThyroidThe image shows the transcriptomic changes along malignancy continuum.log2FC in expression of this searched gene in stem-like cells from each diseased tissue sample relative to stem-like cells in normal samples in each tissue plotted against the malignancy continuum. Samples are colored based on if they are from different disease stage.
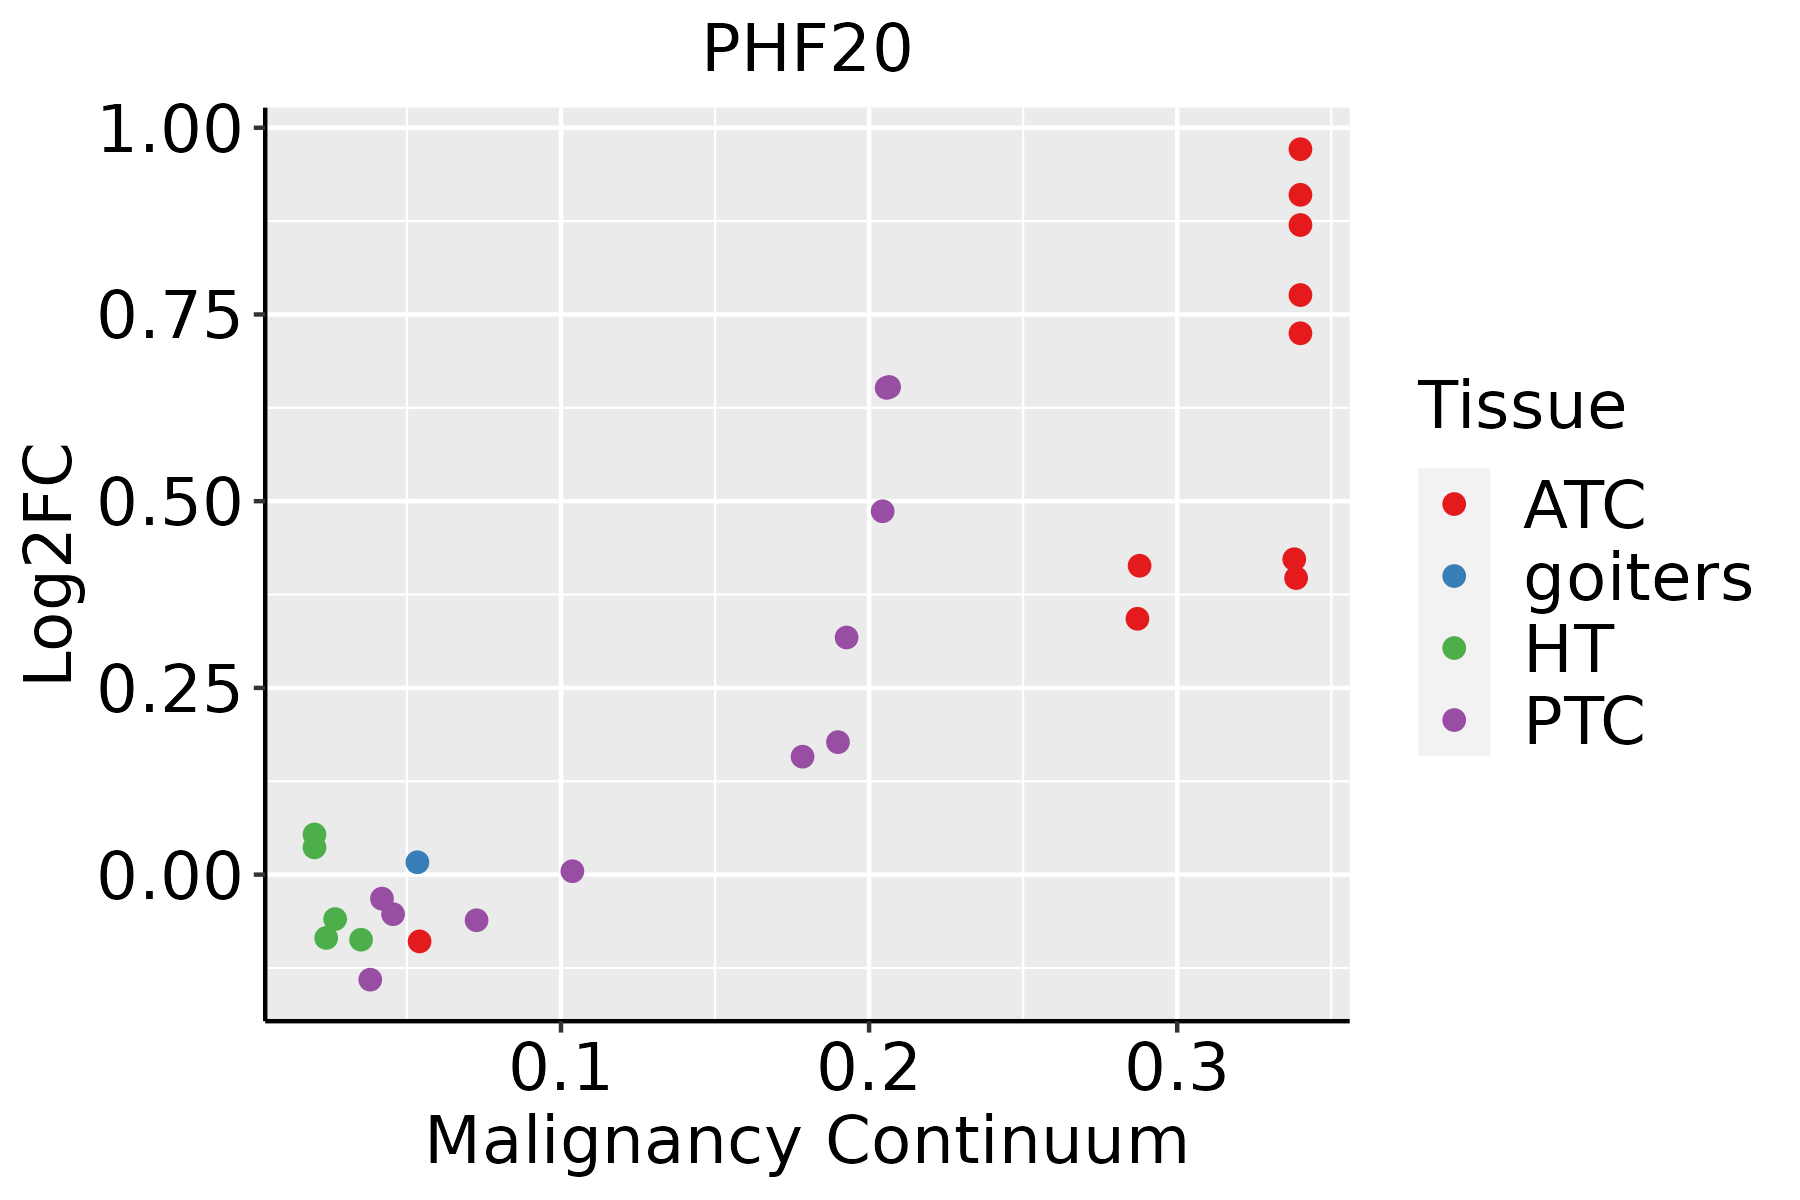
ATC: Anaplastic thyroid cancer
HT: Hashimoto's thyroiditis
PTC: Papillary thyroid cancer
∗log2FC in expression of this searched gene in stem-like cells from each diseased tissue sample relative to stem-like cells in normal samples in each tissue plotted against the malignancy continuum. Samples are colored based on if they are from different disease stage.

Top

Malignant transformation related pathway analysis

check buttonFind out the enriched GO biological processes and KEGG pathways involved in transition from healthy to precancer to cancer
check button Figure of enriched GO biological processes.
TissueDisease StageEnriched GO biological Processes
ColorectumADGO analysis - Figure of enriched GO biological processes: Top 15 enriched GO BP terms are showed in the bar plot of each disease state in each tissue. Each row represents a significant GO biological process which is colored according to the -log10(p.adjust).
ColorectumSERGO analysis - Figure of enriched GO biological processes: Top 15 enriched GO BP terms are showed in the bar plot of each disease state in each tissue. Each row represents a significant GO biological process which is colored according to the -log10(p.adjust).
ColorectumMSSGO analysis - Figure of enriched GO biological processes: Top 15 enriched GO BP terms are showed in the bar plot of each disease state in each tissue. Each row represents a significant GO biological process which is colored according to the -log10(p.adjust).
ColorectumMSI-HGO analysis - Figure of enriched GO biological processes: Top 15 enriched GO BP terms are showed in the bar plot of each disease state in each tissue. Each row represents a significant GO biological process which is colored according to the -log10(p.adjust).
ColorectumFAPGO analysis - Figure of enriched GO biological processes: Top 15 enriched GO BP terms are showed in the bar plot of each disease state in each tissue. Each row represents a significant GO biological process which is colored according to the -log10(p.adjust).
∗Top 15 enriched GO BP terms are showed in the bar plot of each disease state in each tissue. Each row represents a significant GO biological process which is colored according to the -log10(p.adjust).
Page: 1 2 3 4 5 6 7 8 9 

check button Enriched GO biological processes.
GO IDTissueDisease StageDescriptionGene RatioBg Ratiopvaluep.adjustCount
GO:0016570ColorectumMSShistone modification113/3467463/187238.37e-048.68e-03113
GO:00165701ColorectumFAPhistone modification94/2622463/187231.06e-041.76e-0394
GO:00165702ColorectumCRChistone modification75/2078463/187234.95e-047.06e-0375
GO:00182057EsophagusHGINpeptidyl-lysine modification88/2587376/187232.99e-071.39e-0588
GO:00165708EsophagusHGINhistone modification92/2587463/187231.70e-043.30e-0392
GO:00064735EsophagusHGINprotein acetylation45/2587201/187236.17e-048.58e-0345
GO:00439844EsophagusHGINhistone H4-K16 acetylation9/258720/187237.18e-049.60e-039
GO:00183945EsophagusHGINpeptidyl-lysine acetylation39/2587169/187237.46e-049.90e-0339
GO:00435435EsophagusHGINprotein acylation51/2587243/187231.33e-031.57e-0251
GO:00439675EsophagusHGINhistone H4 acetylation19/258767/187231.39e-031.63e-0219
GO:00064755EsophagusHGINinternal protein amino acid acetylation36/2587160/187231.87e-032.01e-0236
GO:00183935EsophagusHGINinternal peptidyl-lysine acetylation35/2587158/187232.82e-032.75e-0235
GO:001657015EsophagusESCChistone modification323/8552463/187232.61e-267.88e-24323
GO:001820514EsophagusESCCpeptidyl-lysine modification259/8552376/187233.90e-205.26e-18259
GO:001839413EsophagusESCCpeptidyl-lysine acetylation123/8552169/187236.58e-132.94e-11123
GO:004354313EsophagusESCCprotein acylation165/8552243/187231.69e-127.14e-11165
GO:000647313EsophagusESCCprotein acetylation140/8552201/187234.37e-121.69e-10140
GO:001839313EsophagusESCCinternal peptidyl-lysine acetylation114/8552158/187231.16e-114.24e-10114
GO:000647513EsophagusESCCinternal protein amino acid acetylation115/8552160/187231.43e-115.08e-10115
GO:00165735EsophagusESCChistone acetylation110/8552152/187231.95e-116.81e-10110
Page: 1 2 3 4 5 6 7 8 

check button Enriched KEGG pathways.
Pathway IDTissueDisease StageDescriptionGene RatioBg Ratiopvaluep.adjustqvalueCount
Page: 1 

Top

Cell-cell communication analysis

check buttonIdentification of potential cell-cell interactions between two cell types and their ligand-receptor pairs for different disease states
LigandReceptorLRpairPathwayTissueDisease Stage
Page: 1 

Top

Single-cell gene regulatory network inference analysis

check buttonFind out the significant the regulons (TFs) and the target genes of each regulon across cell types for different disease states
TFCell TypeTissueDisease StageTarget GeneRSSRegulon Activity
∗The dot plots of a searched regulon are shown for all cell subpopulations in each disease state of each tissue based on the regulon specific score inferred using pySCENIC and by calculating the average expression.
Page: 1 

Top

Somatic mutation of malignant transformation related genes

check buttonAnnotation of somatic variants for genes involved in malignant transformation
Hugo SymbolVariant ClassVariant ClassificationdbSNP RSHGVScHGVSpHGVSp ShortSWISSPROTBIOTYPESIFTPolyPhenTumor Sample BarcodeTissueHistologySexAgeStageTherapy TypesDrugsOutcome
PHF20SNVMissense_Mutationrs780164709c.1271C>Tp.Ser424Leup.S424LQ9BVI0protein_codingdeleterious(0.01)benign(0.122)TCGA-AC-A23H-01Breastbreast invasive carcinomaFemale>=65I/IIUnknownUnknownPD
PHF20SNVMissense_Mutationc.2249A>Tp.Gln750Leup.Q750LQ9BVI0protein_codingtolerated(0.1)possibly_damaging(0.728)TCGA-B6-A0X0-01Breastbreast invasive carcinomaFemale<65I/IIUnknownUnknownSD
PHF20SNVMissense_Mutationc.1998G>Tp.Met666Ilep.M666IQ9BVI0protein_codingdeleterious(0)probably_damaging(0.977)TCGA-D8-A1XZ-01Breastbreast invasive carcinomaFemale>=65III/IVHormone Therapytamoxiphen+anastrozolumSD
PHF20SNVMissense_Mutationc.368N>Cp.Gly123Alap.G123AQ9BVI0protein_codingdeleterious(0)probably_damaging(0.997)TCGA-D8-A27G-01Breastbreast invasive carcinomaFemale>=65I/IIUnknownUnknownSD
PHF20SNVMissense_Mutationnovelc.2945N>Tp.Pro982Leup.P982LQ9BVI0protein_codingdeleterious(0)probably_damaging(0.998)TCGA-S3-AA17-01Breastbreast invasive carcinomaFemale<65I/IIHormone TherapyanastrozoleSD
PHF20insertionFrame_Shift_Insnovelc.319_320insTATCTATAATGGTCCTGCTGCTTTTGGATCTGACp.Thr108SerfsTer15p.T108Sfs*15Q9BVI0protein_codingTCGA-A8-A095-01Breastbreast invasive carcinomaFemale<65I/IIChemotherapy5-fluorouracilCR
PHF20insertionIn_Frame_Insnovelc.189_190insACTGGCCGGGCACAGTGGTTCACCCTTGTAATCp.Pro63_Tyr64insThrGlyArgAlaGlnTrpPheThrLeuValIlep.P63_Y64insTGRAQWFTLVIQ9BVI0protein_codingTCGA-AO-A03R-01Breastbreast invasive carcinomaFemale<65I/IIChemotherapydoxorubicinSD
PHF20insertionFrame_Shift_Insnovelc.2379_2380insGTGGTCTCCTp.Asn794ValfsTer4p.N794Vfs*4Q9BVI0protein_codingTCGA-AO-A0J5-01Breastbreast invasive carcinomaFemale<65III/IVOther, specify in notesBisphosphonatezoledronicPD
PHF20SNVMissense_Mutationrs200315522c.2600N>Tp.Ala867Valp.A867VQ9BVI0protein_codingdeleterious(0.04)benign(0.038)TCGA-2W-A8YY-01Cervixcervical & endocervical cancerFemale<65I/IIChemotherapycisplatinCR
PHF20SNVMissense_Mutationnovelc.2845N>Tp.Leu949Phep.L949FQ9BVI0protein_codingdeleterious(0.01)probably_damaging(0.975)TCGA-C5-A8XJ-01Cervixcervical & endocervical cancerFemale>=65I/IIChemotherapycisplatinSD
Page: 1 2 3 4 5 6 7 8 9 10 

Top

Related drugs of malignant transformation related genes

check buttonIdentification of chemicals and drugs interact with genes involved in malignant transfromation
(DGIdb 4.0)
Entrez IDSymbolCategoryInteraction TypesDrug Claim NameDrug NamePMIDs
Page: 1