
|
|||||
|
 | |
| |
| |
| |
| |
| |
|
Gene: PHF12 |
Gene summary for PHF12 |
| Gene information | Species | Human | Gene symbol | PHF12 | Gene ID | 57649 |
| Gene name | PHD finger protein 12 | |
| Gene Alias | PF1 | |
| Cytomap | 17q11.2 | |
| Gene Type | protein-coding | GO ID | GO:0000122 | UniProtAcc | Q96QT6 |
Top |
Malignant transformation analysis |
| Identification of the aberrant gene expression in precancerous and cancerous lesions by comparing the gene expression of stem-like cells in diseased tissues with normal stem cells |
| Entrez ID | Symbol | Replicates | Species | Organ | Tissue | Adj P-value | Log2FC | Malignancy |
| 57649 | PHF12 | LZE4T | Human | Esophagus | ESCC | 7.53e-07 | 1.15e-01 | 0.0811 |
| 57649 | PHF12 | LZE5T | Human | Esophagus | ESCC | 1.31e-03 | 3.73e-01 | 0.0514 |
| 57649 | PHF12 | LZE7T | Human | Esophagus | ESCC | 1.61e-07 | 2.83e-01 | 0.0667 |
| 57649 | PHF12 | LZE20T | Human | Esophagus | ESCC | 8.11e-08 | 1.08e-01 | 0.0662 |
| 57649 | PHF12 | LZE22T | Human | Esophagus | ESCC | 2.03e-04 | 1.84e-01 | 0.068 |
| 57649 | PHF12 | LZE24T | Human | Esophagus | ESCC | 9.55e-14 | 1.98e-01 | 0.0596 |
| 57649 | PHF12 | P1T-E | Human | Esophagus | ESCC | 1.89e-02 | 2.80e-01 | 0.0875 |
| 57649 | PHF12 | P2T-E | Human | Esophagus | ESCC | 7.81e-22 | 3.48e-01 | 0.1177 |
| 57649 | PHF12 | P4T-E | Human | Esophagus | ESCC | 1.25e-17 | 2.24e-01 | 0.1323 |
| 57649 | PHF12 | P5T-E | Human | Esophagus | ESCC | 3.24e-22 | 2.11e-01 | 0.1327 |
| 57649 | PHF12 | P8T-E | Human | Esophagus | ESCC | 1.43e-10 | 1.60e-01 | 0.0889 |
| 57649 | PHF12 | P9T-E | Human | Esophagus | ESCC | 6.02e-12 | 1.08e-01 | 0.1131 |
| 57649 | PHF12 | P10T-E | Human | Esophagus | ESCC | 8.03e-24 | 4.52e-01 | 0.116 |
| 57649 | PHF12 | P11T-E | Human | Esophagus | ESCC | 1.21e-08 | 2.27e-01 | 0.1426 |
| 57649 | PHF12 | P12T-E | Human | Esophagus | ESCC | 2.79e-14 | 2.27e-01 | 0.1122 |
| 57649 | PHF12 | P15T-E | Human | Esophagus | ESCC | 3.46e-20 | 2.78e-01 | 0.1149 |
| 57649 | PHF12 | P16T-E | Human | Esophagus | ESCC | 1.52e-14 | 1.98e-01 | 0.1153 |
| 57649 | PHF12 | P17T-E | Human | Esophagus | ESCC | 3.12e-05 | 1.86e-01 | 0.1278 |
| 57649 | PHF12 | P20T-E | Human | Esophagus | ESCC | 2.26e-05 | 5.96e-02 | 0.1124 |
| 57649 | PHF12 | P21T-E | Human | Esophagus | ESCC | 1.72e-08 | 1.06e-01 | 0.1617 |
| Page: 1 2 3 4 |
| Tissue | Expression Dynamics | Abbreviation |
| Esophagus | 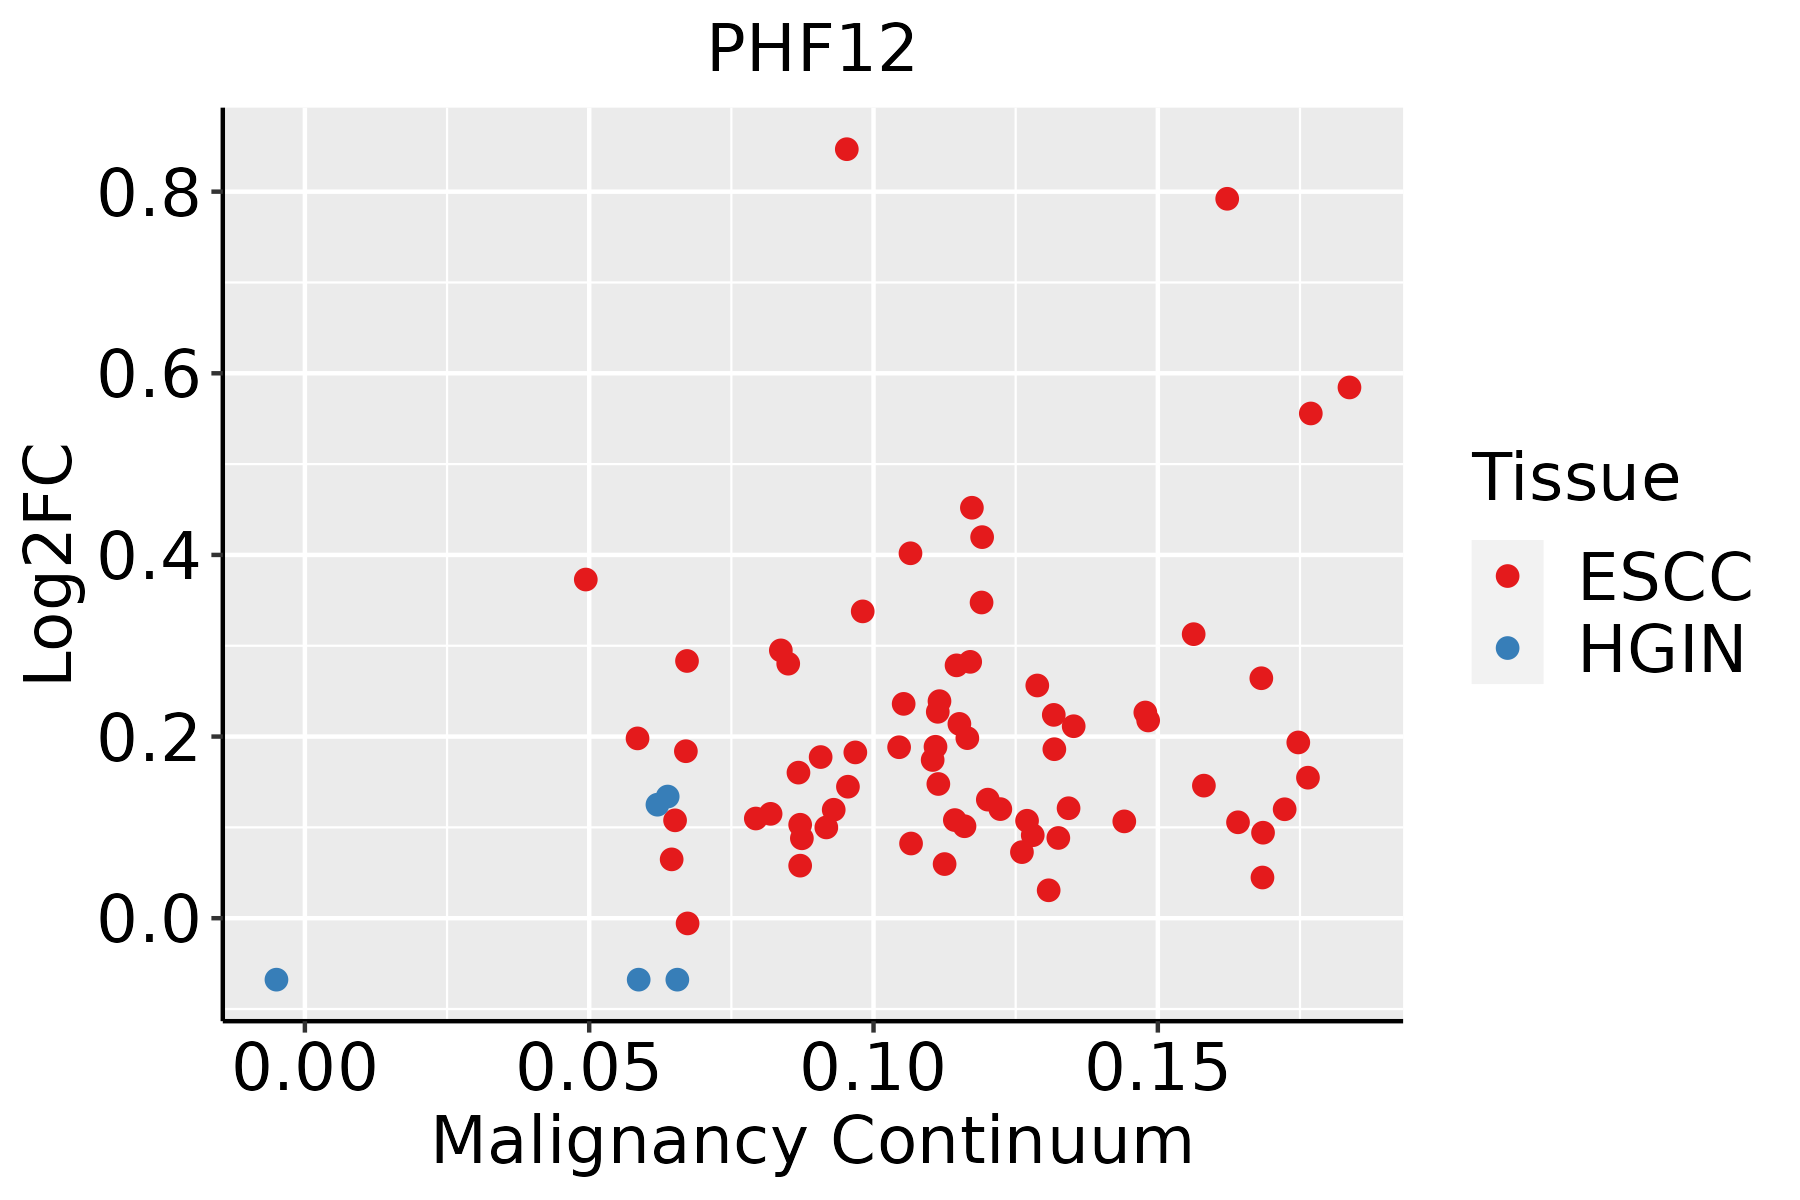 | ESCC: Esophageal squamous cell carcinoma |
| HGIN: High-grade intraepithelial neoplasias | ||
| LGIN: Low-grade intraepithelial neoplasias | ||
| Liver | 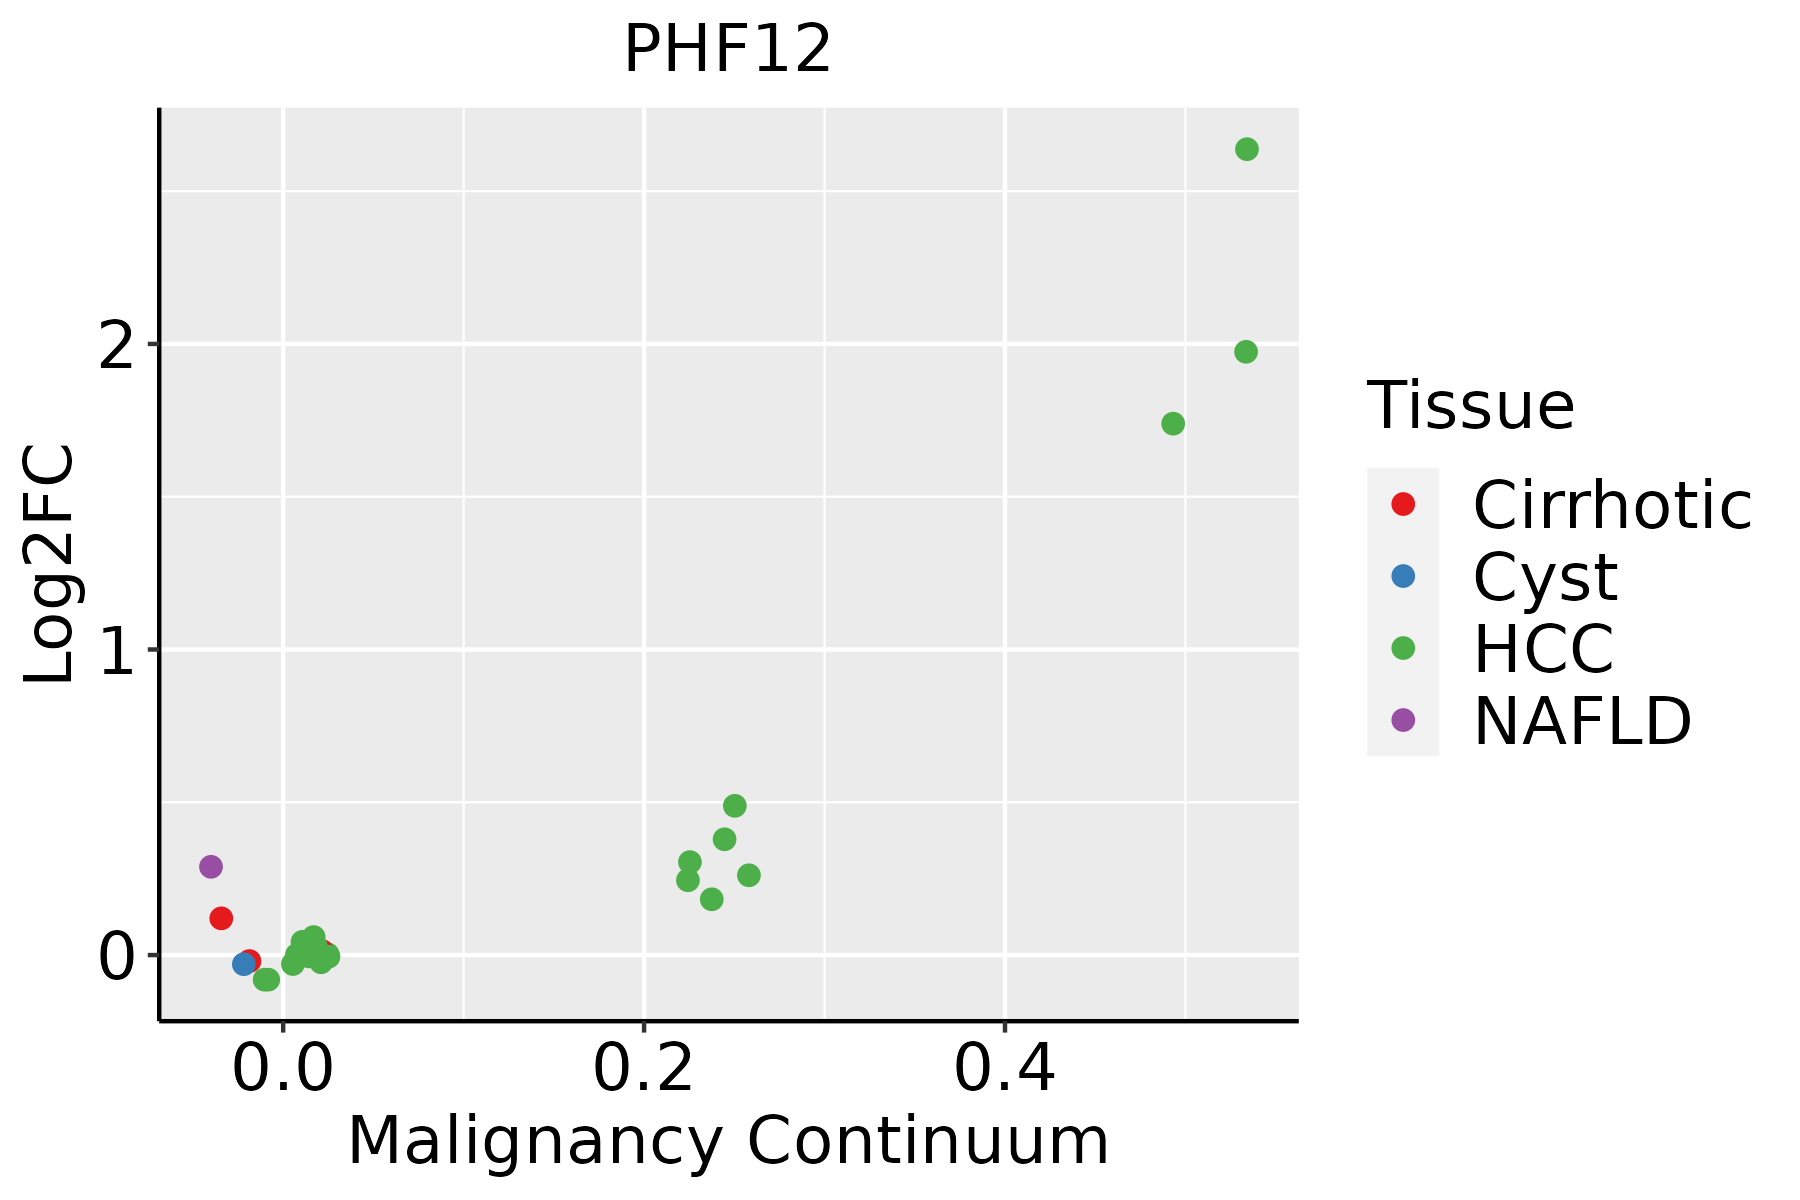 | HCC: Hepatocellular carcinoma |
| NAFLD: Non-alcoholic fatty liver disease |
| ∗log2FC in expression of this searched gene in stem-like cells from each diseased tissue sample relative to stem-like cells in normal samples in each tissue plotted against the malignancy continuum. Samples are colored based on if they are from different disease stage. |
Top |
Malignant transformation related pathway analysis |
| Find out the enriched GO biological processes and KEGG pathways involved in transition from healthy to precancer to cancer |
| Tissue | Disease Stage | Enriched GO biological Processes |
| Colorectum | AD |  |
| Colorectum | SER |  |
| Colorectum | MSS |  |
| Colorectum | MSI-H |  |
| Colorectum | FAP |  |
| ∗Top 15 enriched GO BP terms are showed in the bar plot of each disease state in each tissue. Each row represents a significant GO biological process which is colored according to the -log10(p.adjust). |
| Page: 1 2 3 4 5 6 7 8 9 |
| GO ID | Tissue | Disease Stage | Description | Gene Ratio | Bg Ratio | pvalue | p.adjust | Count |
| Page: 1 |
| Pathway ID | Tissue | Disease Stage | Description | Gene Ratio | Bg Ratio | pvalue | p.adjust | qvalue | Count |
| Page: 1 |
Top |
Cell-cell communication analysis |
| Identification of potential cell-cell interactions between two cell types and their ligand-receptor pairs for different disease states |
| Ligand | Receptor | LRpair | Pathway | Tissue | Disease Stage |
| Page: 1 |
Top |
Single-cell gene regulatory network inference analysis |
| Find out the significant the regulons (TFs) and the target genes of each regulon across cell types for different disease states |
| TF | Cell Type | Tissue | Disease Stage | Target Gene | RSS | Regulon Activity |
| ∗The dot plots of a searched regulon are shown for all cell subpopulations in each disease state of each tissue based on the regulon specific score inferred using pySCENIC and by calculating the average expression. |
| Page: 1 |
Top |
Somatic mutation of malignant transformation related genes |
| Annotation of somatic variants for genes involved in malignant transformation |
| Hugo Symbol | Variant Class | Variant Classification | dbSNP RS | HGVSc | HGVSp | HGVSp Short | SWISSPROT | BIOTYPE | SIFT | PolyPhen | Tumor Sample Barcode | Tissue | Histology | Sex | Age | Stage | Therapy Types | Drugs | Outcome |
| PHF12 | SNV | Missense_Mutation | c.2492N>A | p.Gly831Asp | p.G831D | Q96QT6 | protein_coding | deleterious(0) | probably_damaging(0.998) | TCGA-A8-A097-01 | Breast | breast invasive carcinoma | Female | >=65 | I/II | Hormone Therapy | tamoxiphen | SD | |
| PHF12 | SNV | Missense_Mutation | c.1571N>A | p.Ser524Tyr | p.S524Y | Q96QT6 | protein_coding | tolerated(0.37) | possibly_damaging(0.462) | TCGA-AN-A046-01 | Breast | breast invasive carcinoma | Female | >=65 | I/II | Unknown | Unknown | SD | |
| PHF12 | SNV | Missense_Mutation | novel | c.2423T>A | p.Val808Glu | p.V808E | Q96QT6 | protein_coding | deleterious(0) | probably_damaging(0.916) | TCGA-AR-A24U-01 | Breast | breast invasive carcinoma | Female | <65 | I/II | Chemotherapy | doxorubicin | SD |
| PHF12 | SNV | Missense_Mutation | novel | c.1160A>G | p.Tyr387Cys | p.Y387C | Q96QT6 | protein_coding | deleterious(0) | probably_damaging(0.997) | TCGA-BH-A0AV-01 | Breast | breast invasive carcinoma | Female | <65 | I/II | Chemotherapy | taxotere | CR |
| PHF12 | SNV | Missense_Mutation | c.2859C>G | p.Ile953Met | p.I953M | Q96QT6 | protein_coding | deleterious(0) | benign(0.311) | TCGA-C8-A275-01 | Breast | breast invasive carcinoma | Female | <65 | I/II | Unknown | Unknown | SD | |
| PHF12 | SNV | Missense_Mutation | c.2539N>A | p.Glu847Lys | p.E847K | Q96QT6 | protein_coding | deleterious(0.01) | probably_damaging(0.956) | TCGA-D8-A1JA-01 | Breast | breast invasive carcinoma | Female | <65 | III/IV | Chemotherapy | adriamycin | PD | |
| PHF12 | SNV | Missense_Mutation | c.1964N>T | p.Thr655Ile | p.T655I | Q96QT6 | protein_coding | deleterious(0.01) | benign(0.077) | TCGA-E9-A1QZ-01 | Breast | breast invasive carcinoma | Female | <65 | I/II | Unknown | Unknown | SD | |
| PHF12 | SNV | Missense_Mutation | c.1968T>A | p.Asp656Glu | p.D656E | Q96QT6 | protein_coding | tolerated(0.92) | benign(0.003) | TCGA-EW-A1IZ-01 | Breast | breast invasive carcinoma | Female | <65 | III/IV | Chemotherapy | taxotere | SD | |
| PHF12 | SNV | Missense_Mutation | rs752844713 | c.356N>G | p.Asn119Ser | p.N119S | Q96QT6 | protein_coding | deleterious(0.01) | probably_damaging(0.978) | TCGA-PE-A5DD-01 | Breast | breast invasive carcinoma | Female | <65 | I/II | Chemotherapy | CR | |
| PHF12 | insertion | Nonsense_Mutation | novel | c.2229_2230insGGGAGGATCGCTTGAGTCTGGGAGGTCAAGGCTGCAGTGAGCTATG | p.Met744GlyfsTer5 | p.M744Gfs*5 | Q96QT6 | protein_coding | TCGA-A2-A0EQ-01 | Breast | breast invasive carcinoma | Female | <65 | I/II | Chemotherapy | adriamycin | SD |
| Page: 1 2 3 4 5 6 7 8 9 |
Top |
Related drugs of malignant transformation related genes |
| Identification of chemicals and drugs interact with genes involved in malignant transfromation |
| (DGIdb 4.0) |
| Entrez ID | Symbol | Category | Interaction Types | Drug Claim Name | Drug Name | PMIDs |
| Page: 1 |

Copyright 2023-Present -The University of Texas Health Science Center at Houston |