
|
|||||
|
 | |
| |
| |
| |
| |
| |
|
Gene: PHF10 |
Gene summary for PHF10 |
| Gene information | Species | Human | Gene symbol | PHF10 | Gene ID | 55274 |
| Gene name | PHD finger protein 10 | |
| Gene Alias | BAF45A | |
| Cytomap | 6q27 | |
| Gene Type | protein-coding | GO ID | GO:0006139 | UniProtAcc | Q8WUB8 |
Top |
Malignant transformation analysis |
| Identification of the aberrant gene expression in precancerous and cancerous lesions by comparing the gene expression of stem-like cells in diseased tissues with normal stem cells |
| Entrez ID | Symbol | Replicates | Species | Organ | Tissue | Adj P-value | Log2FC | Malignancy |
| 55274 | PHF10 | HCC1_Meng | Human | Liver | HCC | 1.66e-28 | -3.73e-02 | 0.0246 |
| 55274 | PHF10 | HCC2_Meng | Human | Liver | HCC | 5.14e-08 | -1.26e-02 | 0.0107 |
| 55274 | PHF10 | HCC1 | Human | Liver | HCC | 1.43e-03 | 3.91e+00 | 0.5336 |
| 55274 | PHF10 | HCC2 | Human | Liver | HCC | 1.09e-16 | 3.91e+00 | 0.5341 |
| 55274 | PHF10 | S014 | Human | Liver | HCC | 1.72e-03 | 3.56e-01 | 0.2254 |
| 55274 | PHF10 | S015 | Human | Liver | HCC | 3.15e-03 | 3.78e-01 | 0.2375 |
| 55274 | PHF10 | S028 | Human | Liver | HCC | 2.46e-12 | 5.69e-01 | 0.2503 |
| 55274 | PHF10 | S029 | Human | Liver | HCC | 9.22e-11 | 5.98e-01 | 0.2581 |
| 55274 | PHF10 | Adj_PTCwithHT_6 | Human | Thyroid | HT | 1.15e-03 | -2.33e-01 | 0.02 |
| 55274 | PHF10 | PTCwithHT_6 | Human | Thyroid | HT | 2.43e-03 | -2.18e-01 | 0.02 |
| 55274 | PHF10 | PTCwithHT_8 | Human | Thyroid | HT | 5.43e-04 | -2.20e-01 | 0.0351 |
| 55274 | PHF10 | male-WTA | Human | Thyroid | PTC | 7.56e-55 | 3.76e-01 | 0.1037 |
| 55274 | PHF10 | PTC01 | Human | Thyroid | PTC | 1.26e-12 | -5.91e-02 | 0.1899 |
| 55274 | PHF10 | PTC04 | Human | Thyroid | PTC | 2.08e-21 | 2.45e-01 | 0.1927 |
| 55274 | PHF10 | PTC05 | Human | Thyroid | PTC | 1.34e-11 | 4.74e-01 | 0.2065 |
| 55274 | PHF10 | PTC06 | Human | Thyroid | PTC | 1.93e-27 | 5.96e-01 | 0.2057 |
| 55274 | PHF10 | PTC07 | Human | Thyroid | PTC | 9.15e-31 | 2.73e-01 | 0.2044 |
| 55274 | PHF10 | ATC09 | Human | Thyroid | ATC | 1.23e-06 | 3.47e-02 | 0.2871 |
| 55274 | PHF10 | ATC12 | Human | Thyroid | ATC | 3.20e-16 | -7.16e-02 | 0.34 |
| 55274 | PHF10 | ATC13 | Human | Thyroid | ATC | 2.42e-31 | 7.96e-01 | 0.34 |
| Page: 1 2 |
| Tissue | Expression Dynamics | Abbreviation |
| Liver | 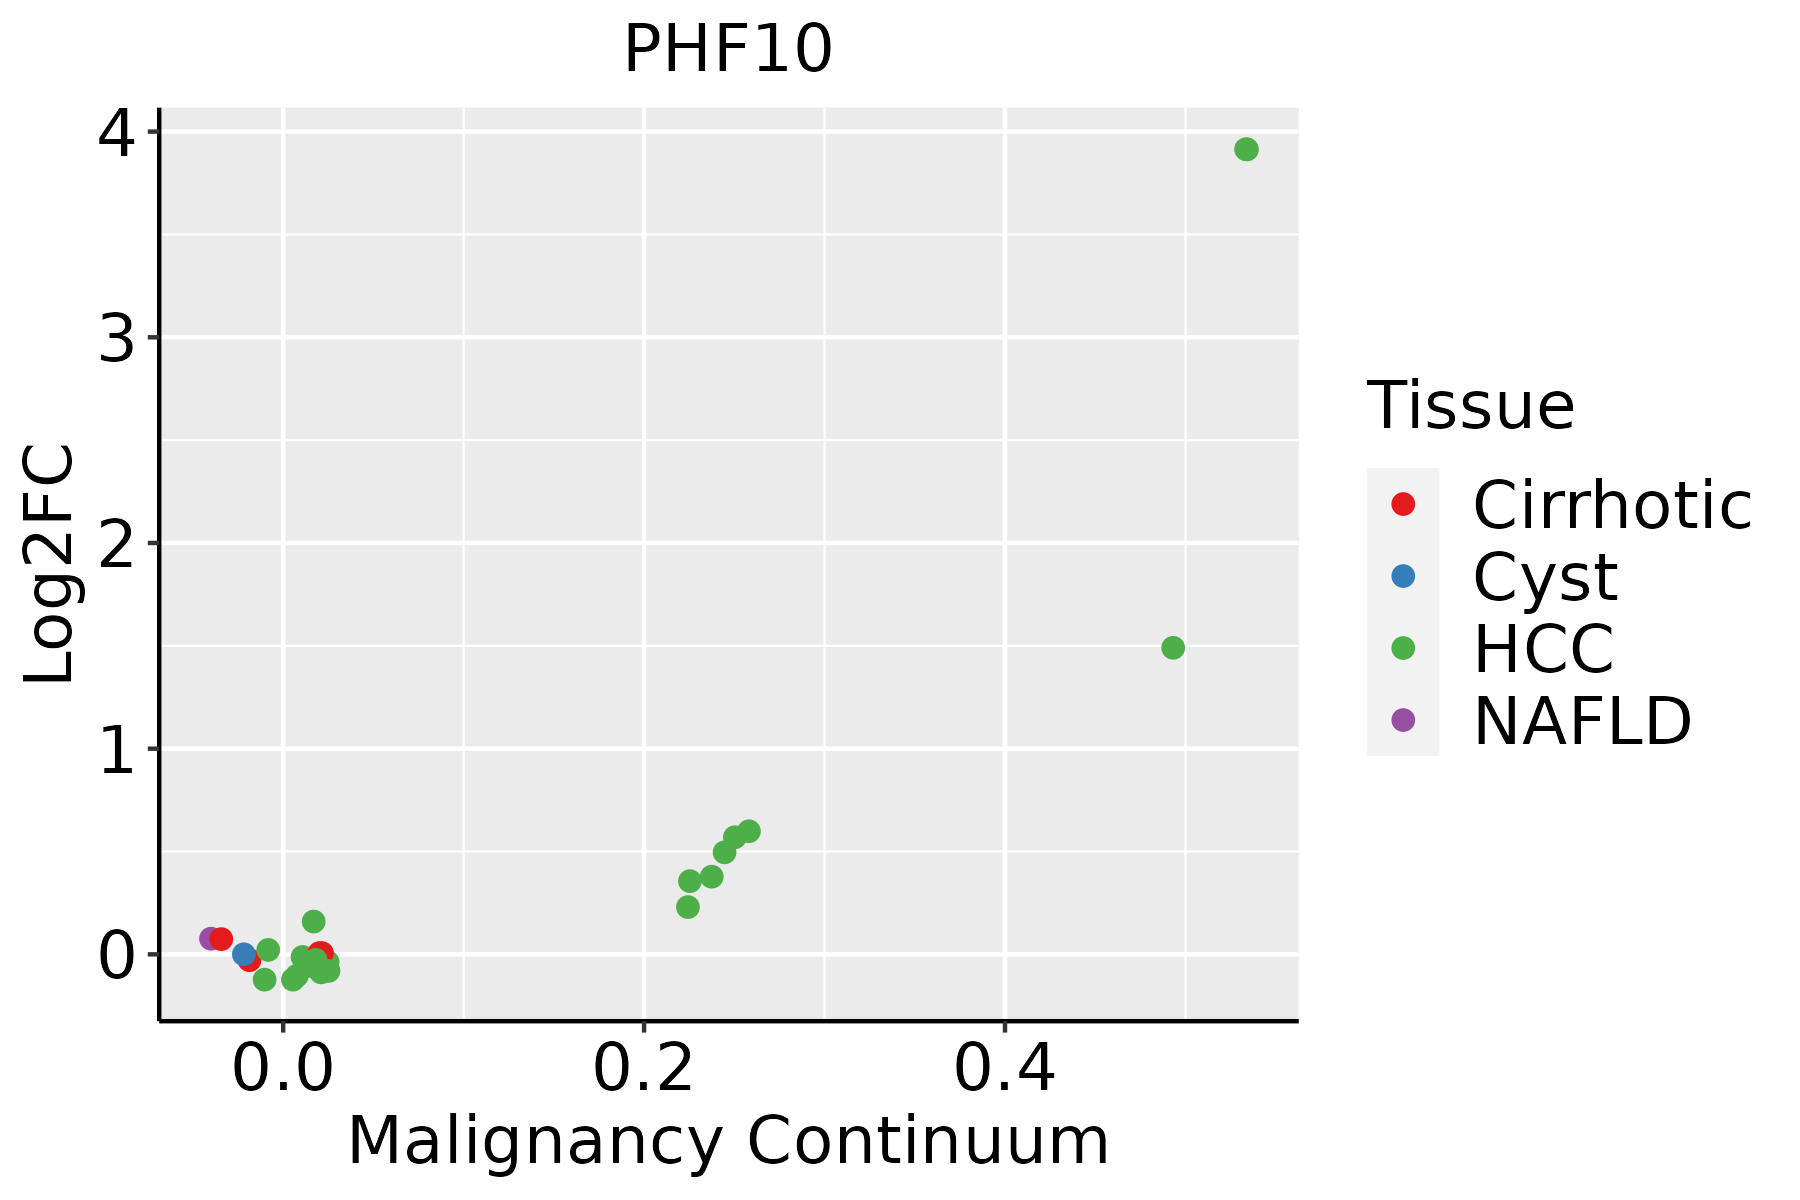 | HCC: Hepatocellular carcinoma |
| NAFLD: Non-alcoholic fatty liver disease | ||
| Thyroid | 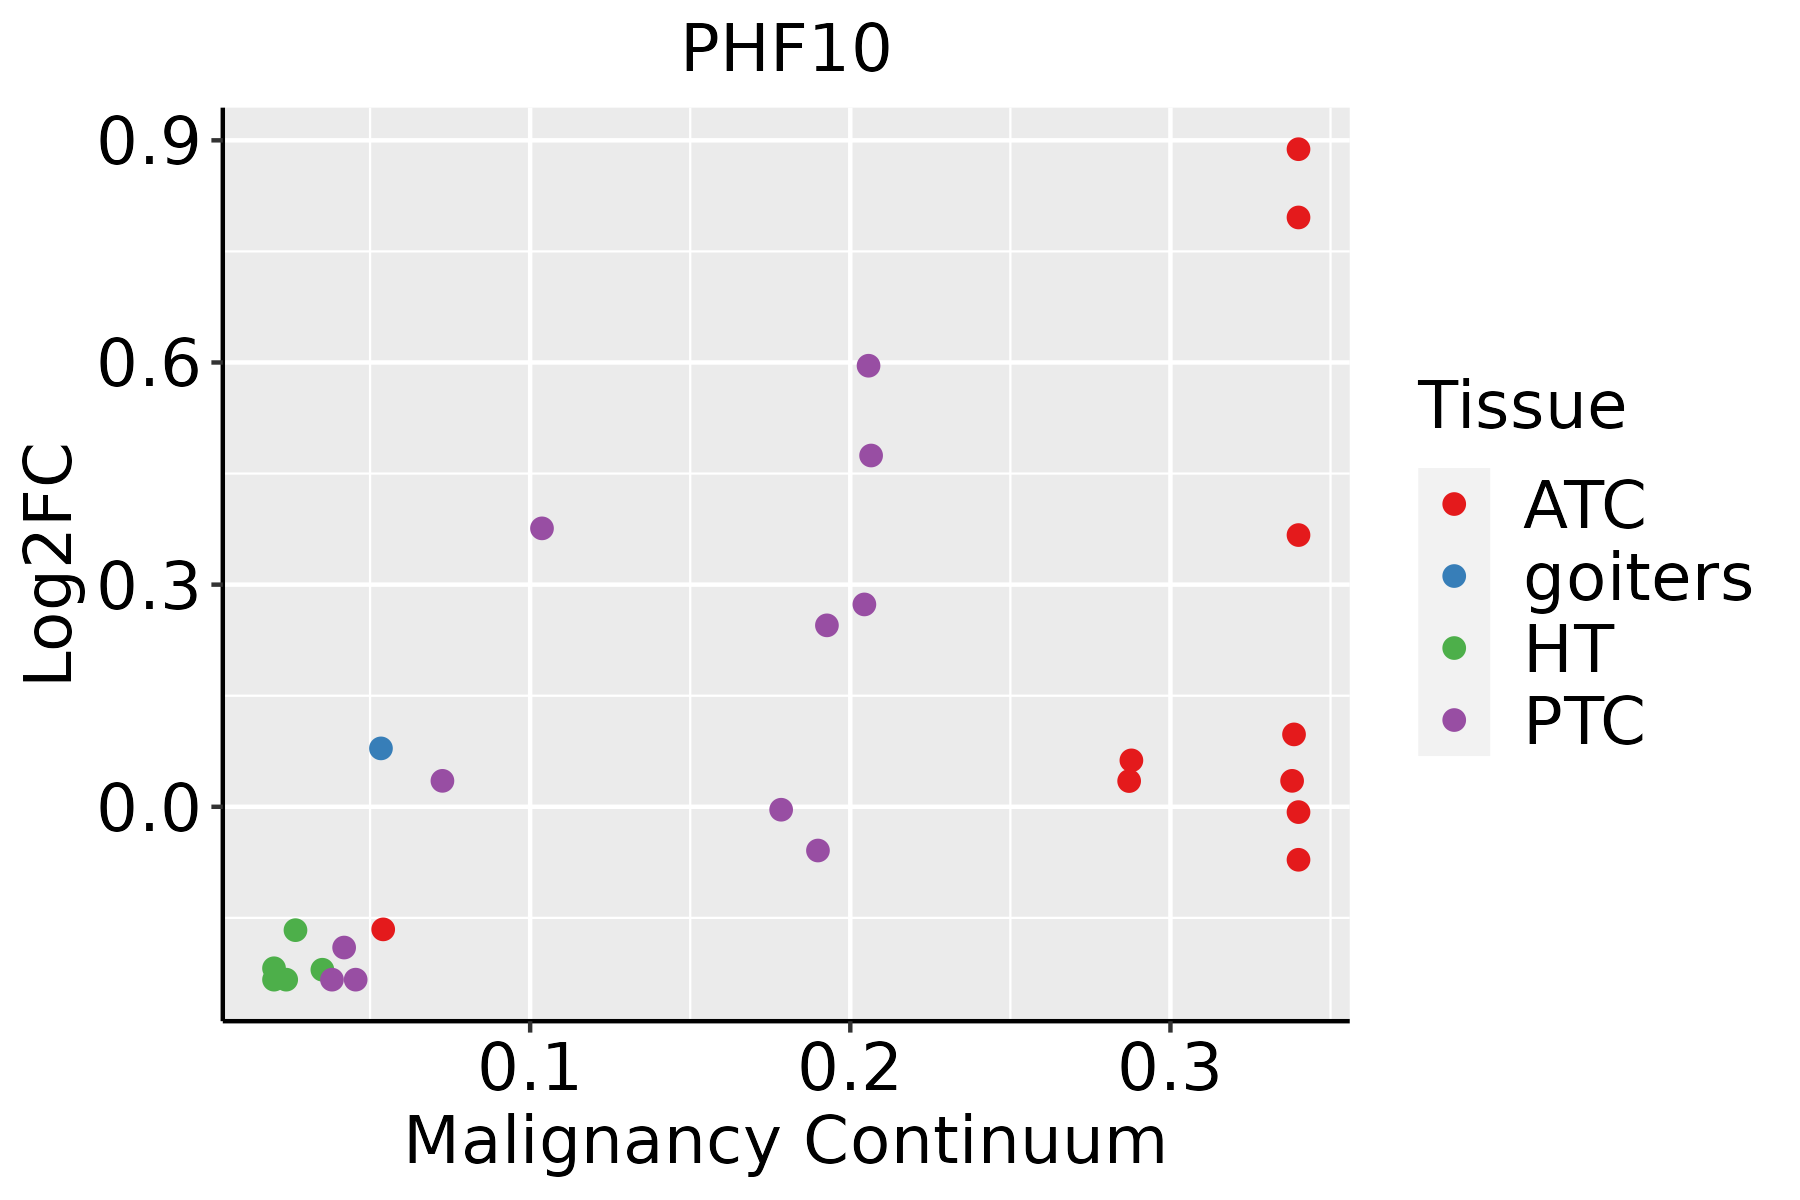 | ATC: Anaplastic thyroid cancer |
| HT: Hashimoto's thyroiditis | ||
| PTC: Papillary thyroid cancer |
| ∗log2FC in expression of this searched gene in stem-like cells from each diseased tissue sample relative to stem-like cells in normal samples in each tissue plotted against the malignancy continuum. Samples are colored based on if they are from different disease stage. |
Top |
Malignant transformation related pathway analysis |
| Find out the enriched GO biological processes and KEGG pathways involved in transition from healthy to precancer to cancer |
| Tissue | Disease Stage | Enriched GO biological Processes |
| Colorectum | AD |  |
| Colorectum | SER |  |
| Colorectum | MSS |  |
| Colorectum | MSI-H |  |
| Colorectum | FAP |  |
| ∗Top 15 enriched GO BP terms are showed in the bar plot of each disease state in each tissue. Each row represents a significant GO biological process which is colored according to the -log10(p.adjust). |
| Page: 1 2 3 4 5 6 7 8 9 |
| GO ID | Tissue | Disease Stage | Description | Gene Ratio | Bg Ratio | pvalue | p.adjust | Count |
| Page: 1 |
| Pathway ID | Tissue | Disease Stage | Description | Gene Ratio | Bg Ratio | pvalue | p.adjust | qvalue | Count |
| hsa052258 | Liver | HCC | Hepatocellular carcinoma | 106/4020 | 168/8465 | 2.87e-05 | 1.85e-04 | 1.03e-04 | 106 |
| hsa0522511 | Liver | HCC | Hepatocellular carcinoma | 106/4020 | 168/8465 | 2.87e-05 | 1.85e-04 | 1.03e-04 | 106 |
| Page: 1 |
Top |
Cell-cell communication analysis |
| Identification of potential cell-cell interactions between two cell types and their ligand-receptor pairs for different disease states |
| Ligand | Receptor | LRpair | Pathway | Tissue | Disease Stage |
| Page: 1 |
Top |
Single-cell gene regulatory network inference analysis |
| Find out the significant the regulons (TFs) and the target genes of each regulon across cell types for different disease states |
| TF | Cell Type | Tissue | Disease Stage | Target Gene | RSS | Regulon Activity |
| ∗The dot plots of a searched regulon are shown for all cell subpopulations in each disease state of each tissue based on the regulon specific score inferred using pySCENIC and by calculating the average expression. |
| Page: 1 |
Top |
Somatic mutation of malignant transformation related genes |
| Annotation of somatic variants for genes involved in malignant transformation |
| Hugo Symbol | Variant Class | Variant Classification | dbSNP RS | HGVSc | HGVSp | HGVSp Short | SWISSPROT | BIOTYPE | SIFT | PolyPhen | Tumor Sample Barcode | Tissue | Histology | Sex | Age | Stage | Therapy Types | Drugs | Outcome |
| PHF10 | deletion | Frame_Shift_Del | novel | c.714delN | p.Lys239SerfsTer41 | p.K239Sfs*41 | Q8WUB8 | protein_coding | TCGA-EW-A2FV-01 | Breast | breast invasive carcinoma | Female | <65 | III/IV | Chemotherapy | docetaxel | SD | ||
| PHF10 | SNV | Missense_Mutation | rs747615034 | c.509N>A | p.Arg170His | p.R170H | Q8WUB8 | protein_coding | deleterious(0) | possibly_damaging(0.807) | TCGA-CA-6718-01 | Colorectum | colon adenocarcinoma | Male | <65 | I/II | Unknown | Unknown | PD |
| PHF10 | SNV | Missense_Mutation | c.190C>A | p.Leu64Ile | p.L64I | Q8WUB8 | protein_coding | tolerated(0.13) | benign(0.137) | TCGA-CM-4750-01 | Colorectum | colon adenocarcinoma | Female | <65 | III/IV | Chemotherapy | fluorouracil | SD | |
| PHF10 | SNV | Missense_Mutation | c.539N>T | p.Tyr180Phe | p.Y180F | Q8WUB8 | protein_coding | deleterious(0.01) | possibly_damaging(0.501) | TCGA-CM-5861-01 | Colorectum | colon adenocarcinoma | Female | <65 | I/II | Unknown | Unknown | PD | |
| PHF10 | SNV | Missense_Mutation | novel | c.1241N>G | p.Asp414Gly | p.D414G | Q8WUB8 | protein_coding | tolerated(0.15) | benign(0.348) | TCGA-AG-A002-01 | Colorectum | rectum adenocarcinoma | Male | <65 | I/II | Unknown | Unknown | SD |
| PHF10 | SNV | Missense_Mutation | novel | c.1061G>T | p.Arg354Ile | p.R354I | Q8WUB8 | protein_coding | tolerated(0.17) | benign(0.14) | TCGA-F5-6814-01 | Colorectum | rectum adenocarcinoma | Male | <65 | I/II | Unknown | Unknown | SD |
| PHF10 | deletion | Frame_Shift_Del | c.618delA | p.Ala207GlnfsTer8 | p.A207Qfs*8 | Q8WUB8 | protein_coding | TCGA-NH-A5IV-01 | Colorectum | colon adenocarcinoma | Female | >=65 | I/II | Unknown | Unknown | SD | |||
| PHF10 | SNV | Missense_Mutation | c.653N>A | p.Arg218His | p.R218H | Q8WUB8 | protein_coding | deleterious(0.01) | benign(0.276) | TCGA-AJ-A3BH-01 | Endometrium | uterine corpus endometrioid carcinoma | Female | Unknown | I/II | Unknown | Unknown | SD | |
| PHF10 | SNV | Missense_Mutation | novel | c.515G>A | p.Arg172Gln | p.R172Q | Q8WUB8 | protein_coding | tolerated(0.06) | benign(0.079) | TCGA-AJ-A3EL-01 | Endometrium | uterine corpus endometrioid carcinoma | Female | <65 | I/II | Unknown | Unknown | SD |
| PHF10 | SNV | Missense_Mutation | novel | c.865G>T | p.Asp289Tyr | p.D289Y | Q8WUB8 | protein_coding | deleterious(0) | possibly_damaging(0.804) | TCGA-AP-A059-01 | Endometrium | uterine corpus endometrioid carcinoma | Female | >=65 | I/II | Unknown | Unknown | SD |
| Page: 1 2 3 4 |
Top |
Related drugs of malignant transformation related genes |
| Identification of chemicals and drugs interact with genes involved in malignant transfromation |
| (DGIdb 4.0) |
| Entrez ID | Symbol | Category | Interaction Types | Drug Claim Name | Drug Name | PMIDs |
| Page: 1 |

Copyright 2023-Present -The University of Texas Health Science Center at Houston |