
|
|||||
|
 | |
| |
| |
| |
| |
| |
|
Gene: PHF1 |
Gene summary for PHF1 |
| Gene information | Species | Human | Gene symbol | PHF1 | Gene ID | 5252 |
| Gene name | PHD finger protein 1 | |
| Gene Alias | MTF2L2 | |
| Cytomap | 6p21.32 | |
| Gene Type | protein-coding | GO ID | GO:0006139 | UniProtAcc | A0A140VJR4 |
Top |
Malignant transformation analysis |
| Identification of the aberrant gene expression in precancerous and cancerous lesions by comparing the gene expression of stem-like cells in diseased tissues with normal stem cells |
| Entrez ID | Symbol | Replicates | Species | Organ | Tissue | Adj P-value | Log2FC | Malignancy |
| 5252 | PHF1 | LZE4T | Human | Esophagus | ESCC | 7.65e-07 | 8.03e-02 | 0.0811 |
| 5252 | PHF1 | LZE5T | Human | Esophagus | ESCC | 5.01e-03 | 1.84e-01 | 0.0514 |
| 5252 | PHF1 | LZE8T | Human | Esophagus | ESCC | 3.01e-03 | -7.49e-03 | 0.067 |
| 5252 | PHF1 | LZE20T | Human | Esophagus | ESCC | 2.18e-13 | 3.21e-01 | 0.0662 |
| 5252 | PHF1 | LZE22T | Human | Esophagus | ESCC | 6.43e-06 | 3.87e-01 | 0.068 |
| 5252 | PHF1 | LZE24T | Human | Esophagus | ESCC | 2.92e-16 | 4.77e-01 | 0.0596 |
| 5252 | PHF1 | LZE21T | Human | Esophagus | ESCC | 7.54e-06 | 3.77e-01 | 0.0655 |
| 5252 | PHF1 | LZE6T | Human | Esophagus | ESCC | 3.97e-05 | 3.62e-02 | 0.0845 |
| 5252 | PHF1 | P1T-E | Human | Esophagus | ESCC | 8.89e-04 | 4.33e-01 | 0.0875 |
| 5252 | PHF1 | P2T-E | Human | Esophagus | ESCC | 9.01e-32 | 5.60e-01 | 0.1177 |
| 5252 | PHF1 | P4T-E | Human | Esophagus | ESCC | 1.75e-13 | 2.00e-01 | 0.1323 |
| 5252 | PHF1 | P5T-E | Human | Esophagus | ESCC | 3.61e-09 | 1.37e-02 | 0.1327 |
| 5252 | PHF1 | P8T-E | Human | Esophagus | ESCC | 4.91e-22 | 1.77e-01 | 0.0889 |
| 5252 | PHF1 | P9T-E | Human | Esophagus | ESCC | 5.14e-05 | 1.32e-01 | 0.1131 |
| 5252 | PHF1 | P10T-E | Human | Esophagus | ESCC | 9.41e-16 | 2.13e-01 | 0.116 |
| 5252 | PHF1 | P11T-E | Human | Esophagus | ESCC | 2.00e-22 | 6.26e-01 | 0.1426 |
| 5252 | PHF1 | P12T-E | Human | Esophagus | ESCC | 5.68e-30 | 3.01e-01 | 0.1122 |
| 5252 | PHF1 | P15T-E | Human | Esophagus | ESCC | 1.48e-20 | 2.58e-01 | 0.1149 |
| 5252 | PHF1 | P16T-E | Human | Esophagus | ESCC | 1.49e-21 | 3.22e-01 | 0.1153 |
| 5252 | PHF1 | P17T-E | Human | Esophagus | ESCC | 2.23e-07 | 4.82e-01 | 0.1278 |
| Page: 1 2 3 4 5 6 |
| Tissue | Expression Dynamics | Abbreviation |
| Esophagus | 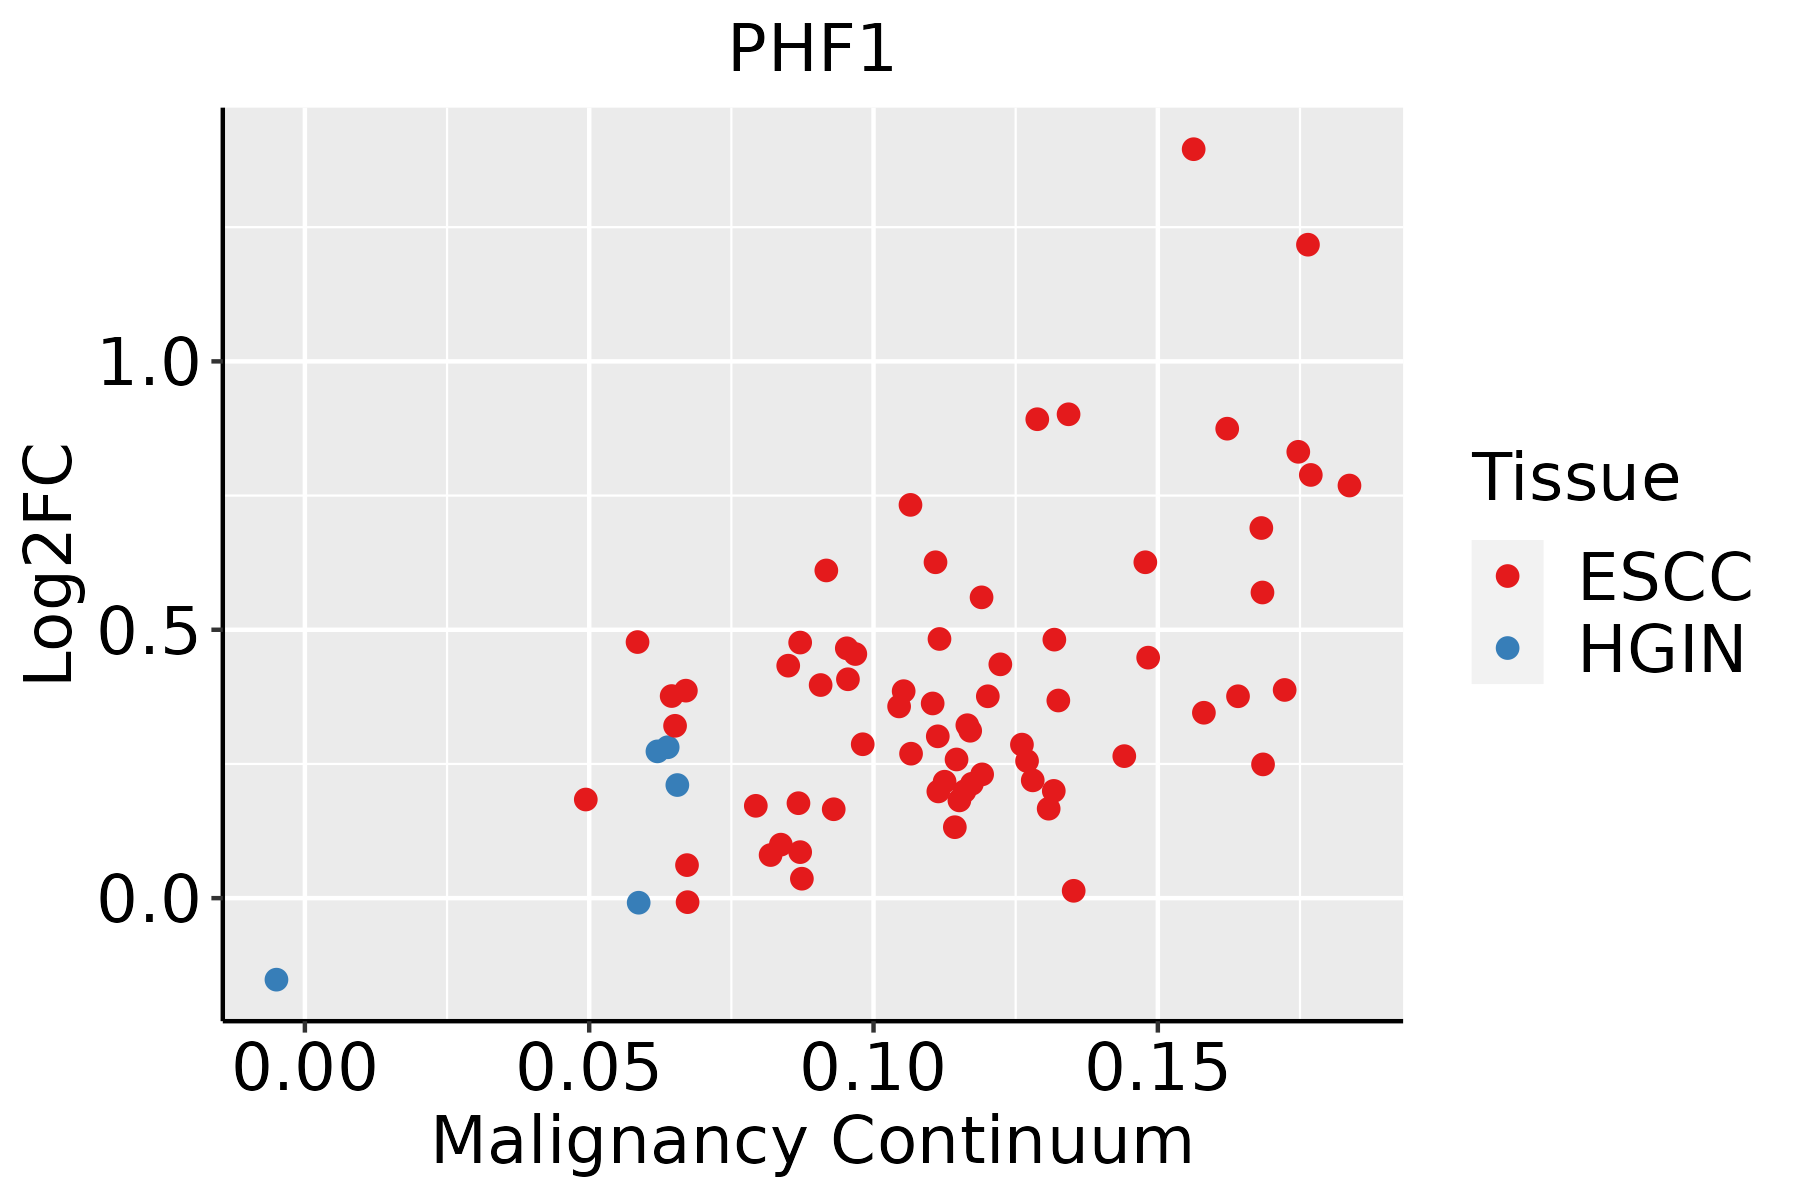 | ESCC: Esophageal squamous cell carcinoma |
| HGIN: High-grade intraepithelial neoplasias | ||
| LGIN: Low-grade intraepithelial neoplasias | ||
| Liver | 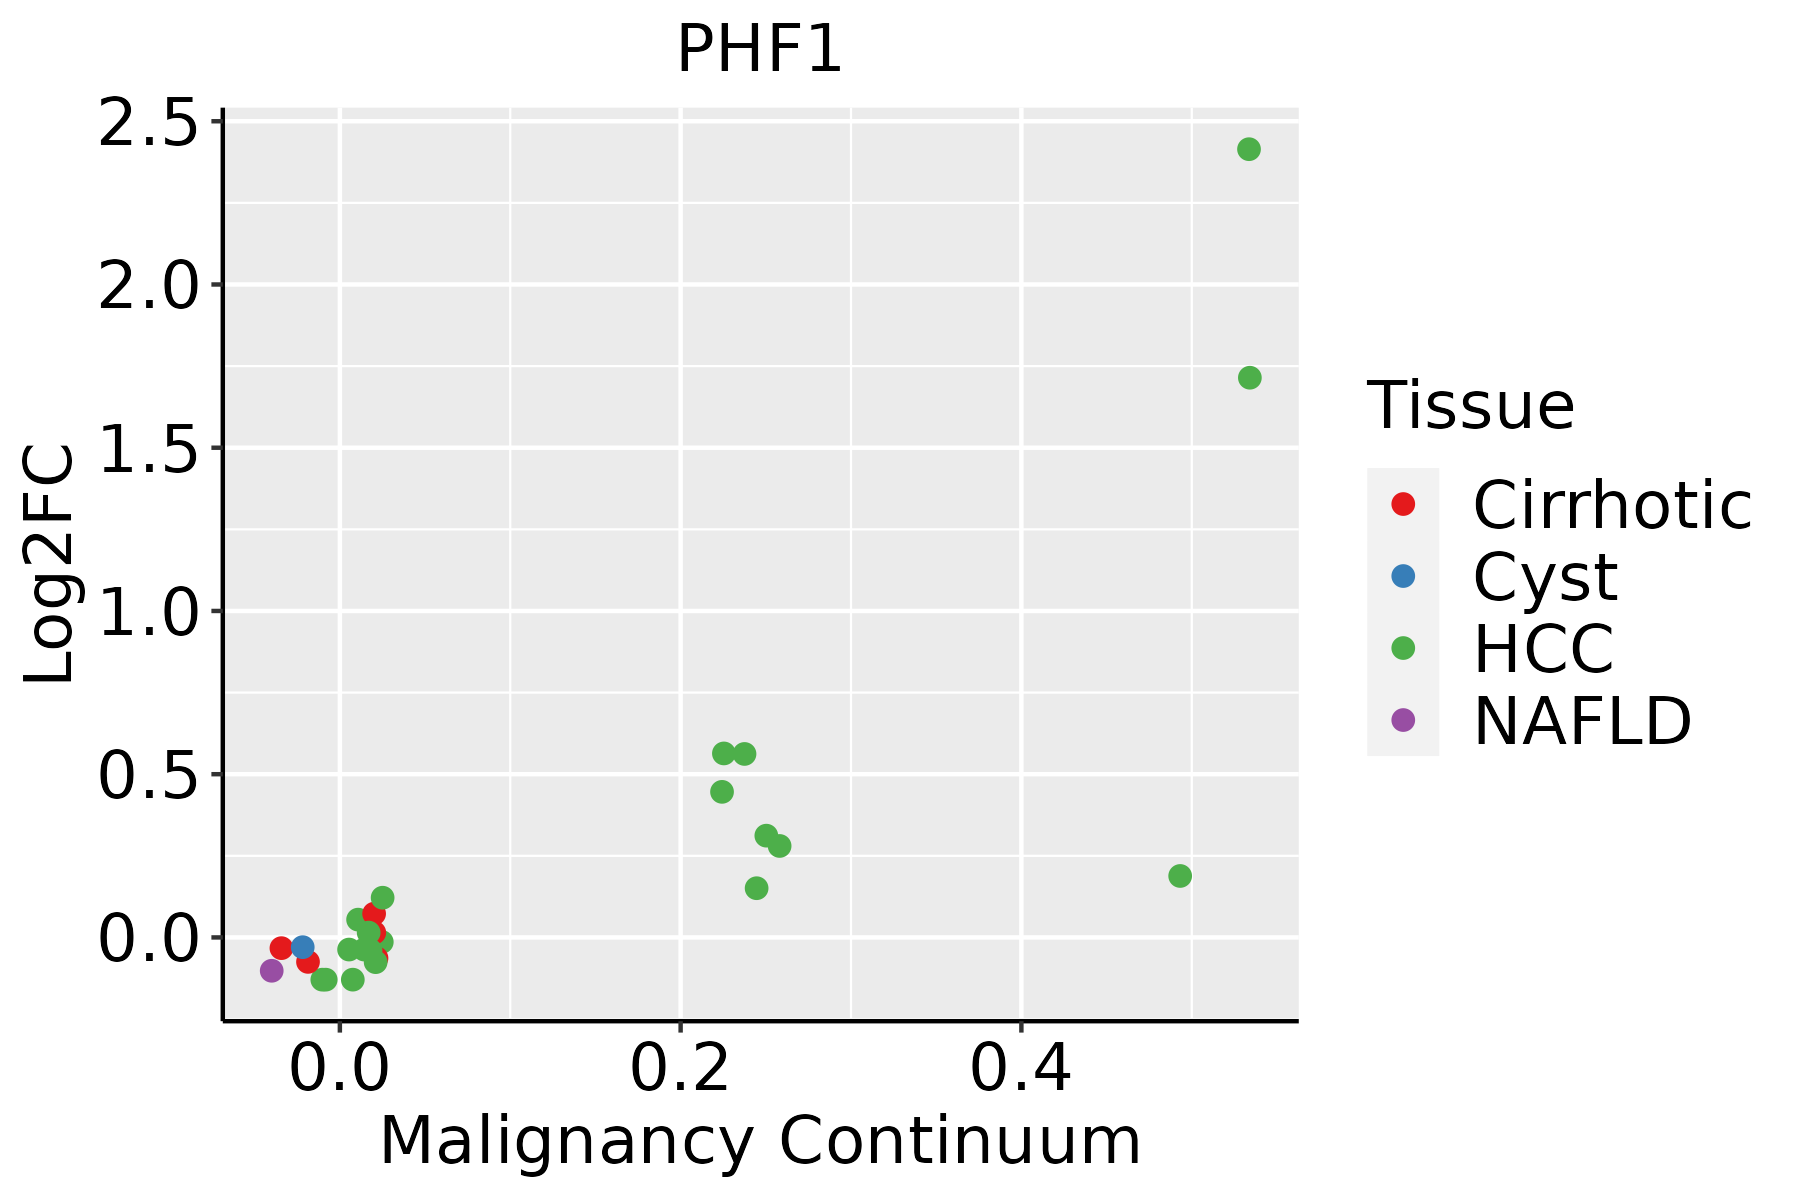 | HCC: Hepatocellular carcinoma |
| NAFLD: Non-alcoholic fatty liver disease | ||
| Oral Cavity | 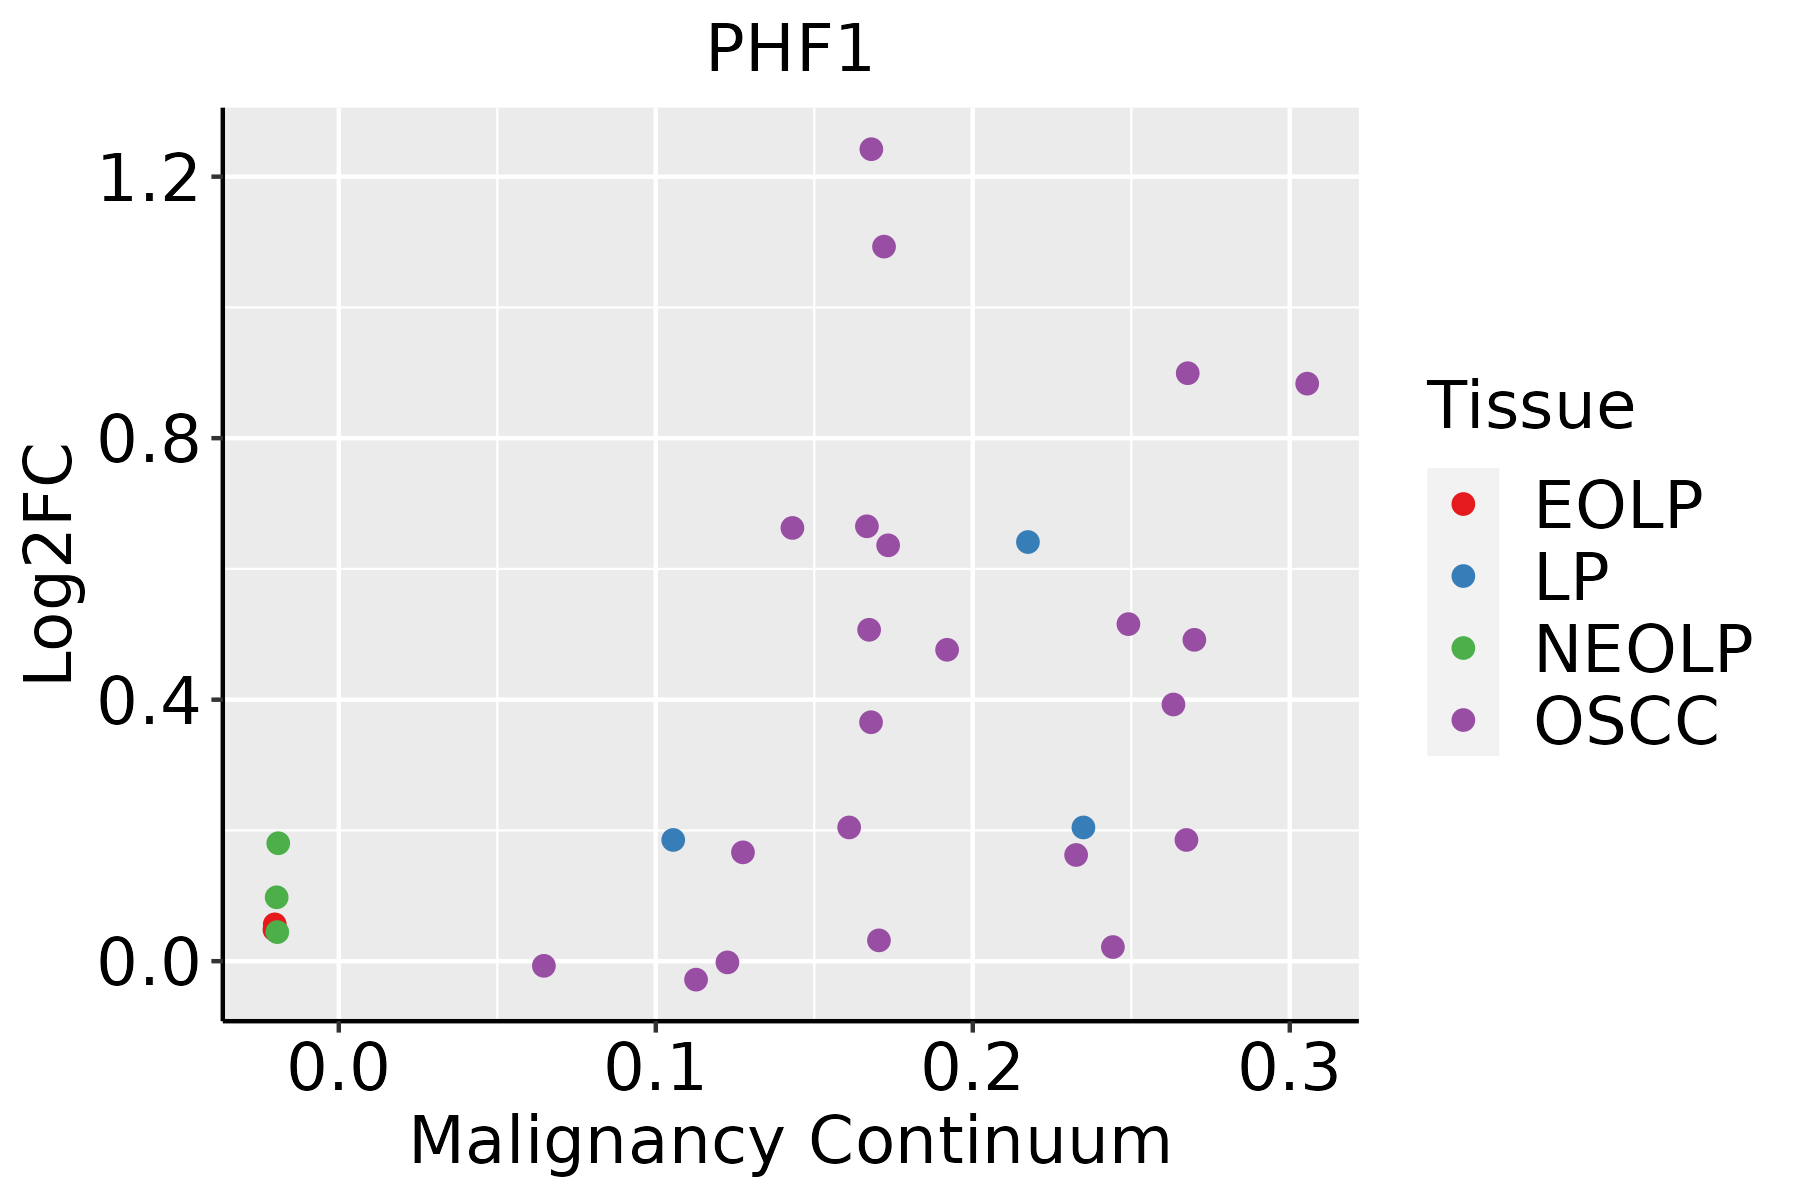 | EOLP: Erosive Oral lichen planus |
| LP: leukoplakia | ||
| NEOLP: Non-erosive oral lichen planus | ||
| OSCC: Oral squamous cell carcinoma | ||
| Thyroid |  | ATC: Anaplastic thyroid cancer |
| HT: Hashimoto's thyroiditis | ||
| PTC: Papillary thyroid cancer |
| ∗log2FC in expression of this searched gene in stem-like cells from each diseased tissue sample relative to stem-like cells in normal samples in each tissue plotted against the malignancy continuum. Samples are colored based on if they are from different disease stage. |
Top |
Malignant transformation related pathway analysis |
| Find out the enriched GO biological processes and KEGG pathways involved in transition from healthy to precancer to cancer |
| Tissue | Disease Stage | Enriched GO biological Processes |
| Colorectum | AD |  |
| Colorectum | SER |  |
| Colorectum | MSS |  |
| Colorectum | MSI-H |  |
| Colorectum | FAP |  |
| ∗Top 15 enriched GO BP terms are showed in the bar plot of each disease state in each tissue. Each row represents a significant GO biological process which is colored according to the -log10(p.adjust). |
| Page: 1 2 3 4 5 6 7 8 9 |
| GO ID | Tissue | Disease Stage | Description | Gene Ratio | Bg Ratio | pvalue | p.adjust | Count |
| GO:00165705 | Cervix | CC | histone modification | 84/2311 | 463/18723 | 1.70e-04 | 2.01e-03 | 84 |
| GO:00182054 | Cervix | CC | peptidyl-lysine modification | 62/2311 | 376/18723 | 1.04e-02 | 4.97e-02 | 62 |
| GO:0016570 | Colorectum | MSS | histone modification | 113/3467 | 463/18723 | 8.37e-04 | 8.68e-03 | 113 |
| GO:00165701 | Colorectum | FAP | histone modification | 94/2622 | 463/18723 | 1.06e-04 | 1.76e-03 | 94 |
| GO:00165702 | Colorectum | CRC | histone modification | 75/2078 | 463/18723 | 4.95e-04 | 7.06e-03 | 75 |
| GO:00182057 | Esophagus | HGIN | peptidyl-lysine modification | 88/2587 | 376/18723 | 2.99e-07 | 1.39e-05 | 88 |
| GO:00165708 | Esophagus | HGIN | histone modification | 92/2587 | 463/18723 | 1.70e-04 | 3.30e-03 | 92 |
| GO:00064735 | Esophagus | HGIN | protein acetylation | 45/2587 | 201/18723 | 6.17e-04 | 8.58e-03 | 45 |
| GO:00183945 | Esophagus | HGIN | peptidyl-lysine acetylation | 39/2587 | 169/18723 | 7.46e-04 | 9.90e-03 | 39 |
| GO:00435435 | Esophagus | HGIN | protein acylation | 51/2587 | 243/18723 | 1.33e-03 | 1.57e-02 | 51 |
| GO:00064755 | Esophagus | HGIN | internal protein amino acid acetylation | 36/2587 | 160/18723 | 1.87e-03 | 2.01e-02 | 36 |
| GO:00183935 | Esophagus | HGIN | internal peptidyl-lysine acetylation | 35/2587 | 158/18723 | 2.82e-03 | 2.75e-02 | 35 |
| GO:001657015 | Esophagus | ESCC | histone modification | 323/8552 | 463/18723 | 2.61e-26 | 7.88e-24 | 323 |
| GO:014001414 | Esophagus | ESCC | mitotic nuclear division | 218/8552 | 287/18723 | 6.17e-26 | 1.78e-23 | 218 |
| GO:000007011 | Esophagus | ESCC | mitotic sister chromatid segregation | 138/8552 | 168/18723 | 1.37e-22 | 2.63e-20 | 138 |
| GO:00008194 | Esophagus | ESCC | sister chromatid segregation | 157/8552 | 202/18723 | 8.41e-21 | 1.33e-18 | 157 |
| GO:001820514 | Esophagus | ESCC | peptidyl-lysine modification | 259/8552 | 376/18723 | 3.90e-20 | 5.26e-18 | 259 |
| GO:000705911 | Esophagus | ESCC | chromosome segregation | 238/8552 | 346/18723 | 1.72e-18 | 1.82e-16 | 238 |
| GO:00482853 | Esophagus | ESCC | organelle fission | 301/8552 | 488/18723 | 4.64e-13 | 2.12e-11 | 301 |
| GO:001839413 | Esophagus | ESCC | peptidyl-lysine acetylation | 123/8552 | 169/18723 | 6.58e-13 | 2.94e-11 | 123 |
| Page: 1 2 3 4 5 6 7 8 9 10 11 12 |
| Pathway ID | Tissue | Disease Stage | Description | Gene Ratio | Bg Ratio | pvalue | p.adjust | qvalue | Count |
| Page: 1 |
Top |
Cell-cell communication analysis |
| Identification of potential cell-cell interactions between two cell types and their ligand-receptor pairs for different disease states |
| Ligand | Receptor | LRpair | Pathway | Tissue | Disease Stage |
| Page: 1 |
Top |
Single-cell gene regulatory network inference analysis |
| Find out the significant the regulons (TFs) and the target genes of each regulon across cell types for different disease states |
| TF | Cell Type | Tissue | Disease Stage | Target Gene | RSS | Regulon Activity |
| ∗The dot plots of a searched regulon are shown for all cell subpopulations in each disease state of each tissue based on the regulon specific score inferred using pySCENIC and by calculating the average expression. |
| Page: 1 |
Top |
Somatic mutation of malignant transformation related genes |
| Annotation of somatic variants for genes involved in malignant transformation |
| Hugo Symbol | Variant Class | Variant Classification | dbSNP RS | HGVSc | HGVSp | HGVSp Short | SWISSPROT | BIOTYPE | SIFT | PolyPhen | Tumor Sample Barcode | Tissue | Histology | Sex | Age | Stage | Therapy Types | Drugs | Outcome |
| PHF1 | SNV | Missense_Mutation | novel | c.938A>G | p.Lys313Arg | p.K313R | O43189 | protein_coding | deleterious(0.03) | possibly_damaging(0.757) | TCGA-A7-A4SE-01 | Breast | breast invasive carcinoma | Female | <65 | I/II | Chemotherapy | adriamycin | CR |
| PHF1 | SNV | Missense_Mutation | rs767831440 | c.748C>T | p.Arg250Cys | p.R250C | O43189 | protein_coding | deleterious(0) | possibly_damaging(0.725) | TCGA-AC-A3W6-01 | Breast | breast invasive carcinoma | Female | >=65 | III/IV | Unknown | Unknown | SD |
| PHF1 | SNV | Missense_Mutation | rs759664324 | c.314T>G | p.Val105Gly | p.V105G | O43189 | protein_coding | deleterious(0) | benign(0.386) | TCGA-AN-A0AT-01 | Breast | breast invasive carcinoma | Female | <65 | I/II | Unknown | Unknown | SD |
| PHF1 | SNV | Missense_Mutation | novel | c.188N>G | p.Val63Gly | p.V63G | O43189 | protein_coding | deleterious(0) | possibly_damaging(0.829) | TCGA-AO-A1KT-01 | Breast | breast invasive carcinoma | Female | >=65 | I/II | Chemotherapy | fluorouracil | SD |
| PHF1 | SNV | Missense_Mutation | rs368297880 | c.41N>T | p.Ser14Leu | p.S14L | O43189 | protein_coding | tolerated_low_confidence(0.13) | benign(0) | TCGA-BH-A2L8-01 | Breast | breast invasive carcinoma | Female | <65 | I/II | Chemotherapy | cytoxan | CR |
| PHF1 | insertion | Frame_Shift_Ins | novel | c.844_845insTTATCACCAGGACTGCCATGTTCCCAGGG | p.Ser282PhefsTer105 | p.S282Ffs*105 | O43189 | protein_coding | TCGA-AN-A0FN-01 | Breast | breast invasive carcinoma | Female | <65 | I/II | Unknown | Unknown | SD | ||
| PHF1 | deletion | Frame_Shift_Del | novel | c.237delN | p.Pro80LeufsTer72 | p.P80Lfs*72 | O43189 | protein_coding | TCGA-EW-A2FV-01 | Breast | breast invasive carcinoma | Female | <65 | III/IV | Chemotherapy | docetaxel | SD | ||
| PHF1 | insertion | Frame_Shift_Ins | novel | c.456_457insA | p.Tyr156LeufsTer58 | p.Y156Lfs*58 | O43189 | protein_coding | TCGA-OL-A66P-01 | Breast | breast invasive carcinoma | Female | >=65 | I/II | Chemotherapy | cytoxan | CR | ||
| PHF1 | SNV | Missense_Mutation | rs779056192 | c.445G>T | p.Gly149Cys | p.G149C | O43189 | protein_coding | deleterious(0) | probably_damaging(0.999) | TCGA-2W-A8YY-01 | Cervix | cervical & endocervical cancer | Female | <65 | I/II | Chemotherapy | cisplatin | CR |
| PHF1 | SNV | Missense_Mutation | novel | c.691N>C | p.Glu231Gln | p.E231Q | O43189 | protein_coding | tolerated(0.13) | benign(0.021) | TCGA-VS-A958-01 | Cervix | cervical & endocervical cancer | Female | <65 | I/II | Chemotherapy | cisplatin | CR |
| Page: 1 2 3 4 5 6 7 |
Top |
Related drugs of malignant transformation related genes |
| Identification of chemicals and drugs interact with genes involved in malignant transfromation |
| (DGIdb 4.0) |
| Entrez ID | Symbol | Category | Interaction Types | Drug Claim Name | Drug Name | PMIDs |
| Page: 1 |

Copyright 2023-Present -The University of Texas Health Science Center at Houston |