
|
|||||
|
 | |
| |
| |
| |
| |
| |
|
Gene: PHC3 |
Gene summary for PHC3 |
| Gene information | Species | Human | Gene symbol | PHC3 | Gene ID | 80012 |
| Gene name | polyhomeotic homolog 3 | |
| Gene Alias | EDR3 | |
| Cytomap | 3q26.2 | |
| Gene Type | protein-coding | GO ID | GO:0006139 | UniProtAcc | B4E2T1 |
Top |
Malignant transformation analysis |
| Identification of the aberrant gene expression in precancerous and cancerous lesions by comparing the gene expression of stem-like cells in diseased tissues with normal stem cells |
| Entrez ID | Symbol | Replicates | Species | Organ | Tissue | Adj P-value | Log2FC | Malignancy |
| 80012 | PHC3 | CCI_1 | Human | Cervix | CC | 4.53e-02 | 5.15e-01 | 0.528 |
| 80012 | PHC3 | CCI_2 | Human | Cervix | CC | 2.60e-20 | 1.78e+00 | 0.5249 |
| 80012 | PHC3 | CCI_3 | Human | Cervix | CC | 1.83e-11 | 1.00e+00 | 0.516 |
| 80012 | PHC3 | sample3 | Human | Cervix | CC | 1.42e-02 | 7.04e-02 | 0.1387 |
| 80012 | PHC3 | HTA11_3410_2000001011 | Human | Colorectum | AD | 9.73e-04 | -3.08e-01 | 0.0155 |
| 80012 | PHC3 | HTA11_347_2000001011 | Human | Colorectum | AD | 3.20e-05 | 4.68e-01 | -0.1954 |
| 80012 | PHC3 | HTA11_10711_2000001011 | Human | Colorectum | AD | 4.47e-03 | -1.48e-01 | 0.0338 |
| 80012 | PHC3 | HTA11_7696_3000711011 | Human | Colorectum | AD | 2.97e-03 | -2.49e-01 | 0.0674 |
| 80012 | PHC3 | HTA11_99999973899_84307 | Human | Colorectum | MSS | 1.85e-03 | -5.52e-01 | 0.2585 |
| 80012 | PHC3 | HTA11_99999974143_84620 | Human | Colorectum | MSS | 1.76e-14 | -4.68e-01 | 0.3005 |
| 80012 | PHC3 | A001-C-207 | Human | Colorectum | FAP | 2.92e-03 | -3.00e-01 | 0.1278 |
| 80012 | PHC3 | A015-C-203 | Human | Colorectum | FAP | 3.49e-38 | -6.49e-01 | -0.1294 |
| 80012 | PHC3 | A015-C-204 | Human | Colorectum | FAP | 6.86e-11 | -5.17e-01 | -0.0228 |
| 80012 | PHC3 | A014-C-040 | Human | Colorectum | FAP | 3.16e-03 | -3.28e-01 | -0.1184 |
| 80012 | PHC3 | A002-C-201 | Human | Colorectum | FAP | 4.86e-15 | -4.80e-01 | 0.0324 |
| 80012 | PHC3 | A002-C-203 | Human | Colorectum | FAP | 1.54e-05 | -3.18e-01 | 0.2786 |
| 80012 | PHC3 | A001-C-119 | Human | Colorectum | FAP | 6.63e-07 | -4.71e-01 | -0.1557 |
| 80012 | PHC3 | A001-C-108 | Human | Colorectum | FAP | 2.15e-22 | -4.17e-01 | -0.0272 |
| 80012 | PHC3 | A002-C-205 | Human | Colorectum | FAP | 3.19e-25 | -6.15e-01 | -0.1236 |
| 80012 | PHC3 | A001-C-104 | Human | Colorectum | FAP | 4.88e-07 | -3.66e-01 | 0.0184 |
| Page: 1 2 3 4 5 6 7 8 |
| Tissue | Expression Dynamics | Abbreviation |
| Cervix |  | CC: Cervix cancer |
| HSIL_HPV: HPV-infected high-grade squamous intraepithelial lesions | ||
| N_HPV: HPV-infected normal cervix | ||
| Colorectum (GSE201348) |  | FAP: Familial adenomatous polyposis |
| CRC: Colorectal cancer | ||
| Colorectum (HTA11) |  | AD: Adenomas |
| SER: Sessile serrated lesions | ||
| MSI-H: Microsatellite-high colorectal cancer | ||
| MSS: Microsatellite stable colorectal cancer | ||
| Esophagus | 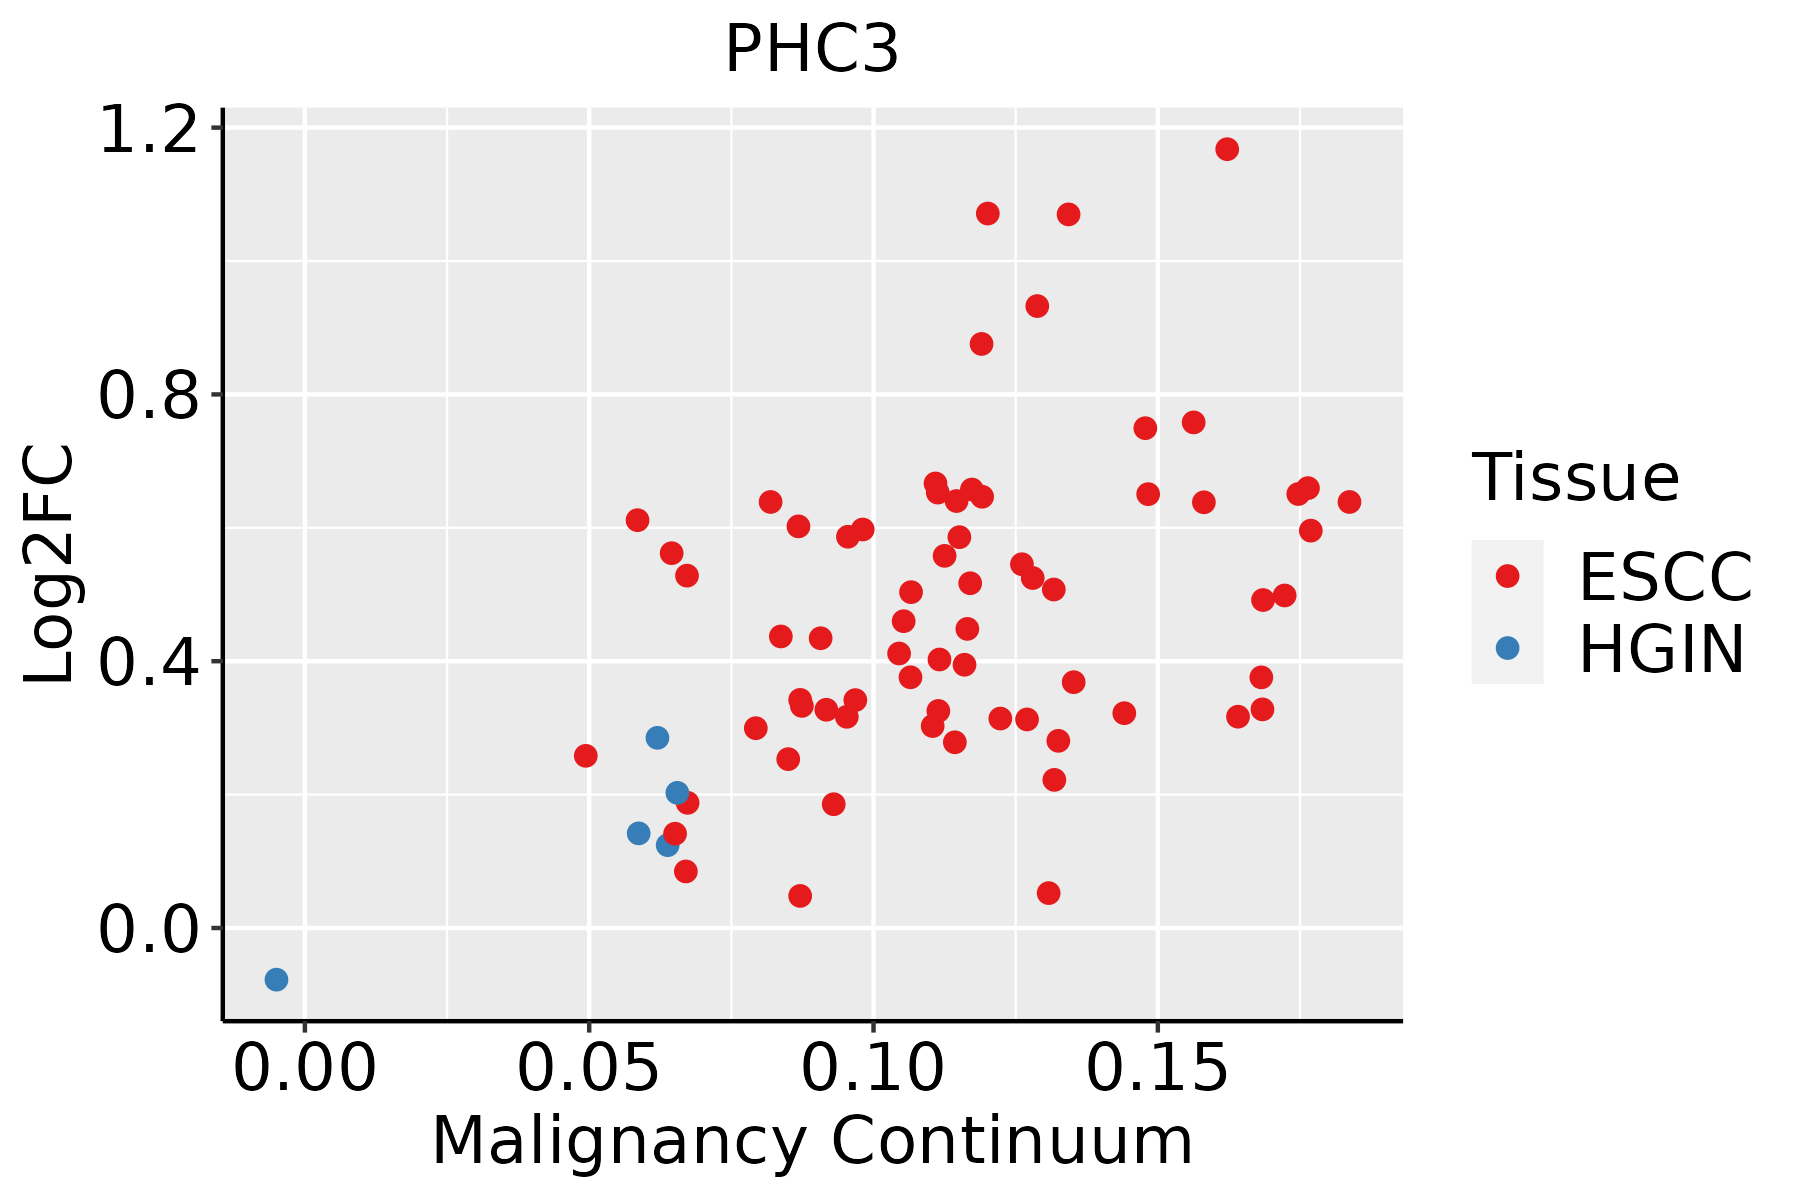 | ESCC: Esophageal squamous cell carcinoma |
| HGIN: High-grade intraepithelial neoplasias | ||
| LGIN: Low-grade intraepithelial neoplasias | ||
| Liver |  | HCC: Hepatocellular carcinoma |
| NAFLD: Non-alcoholic fatty liver disease | ||
| Lung |  | AAH: Atypical adenomatous hyperplasia |
| AIS: Adenocarcinoma in situ | ||
| IAC: Invasive lung adenocarcinoma | ||
| MIA: Minimally invasive adenocarcinoma | ||
| Prostate | 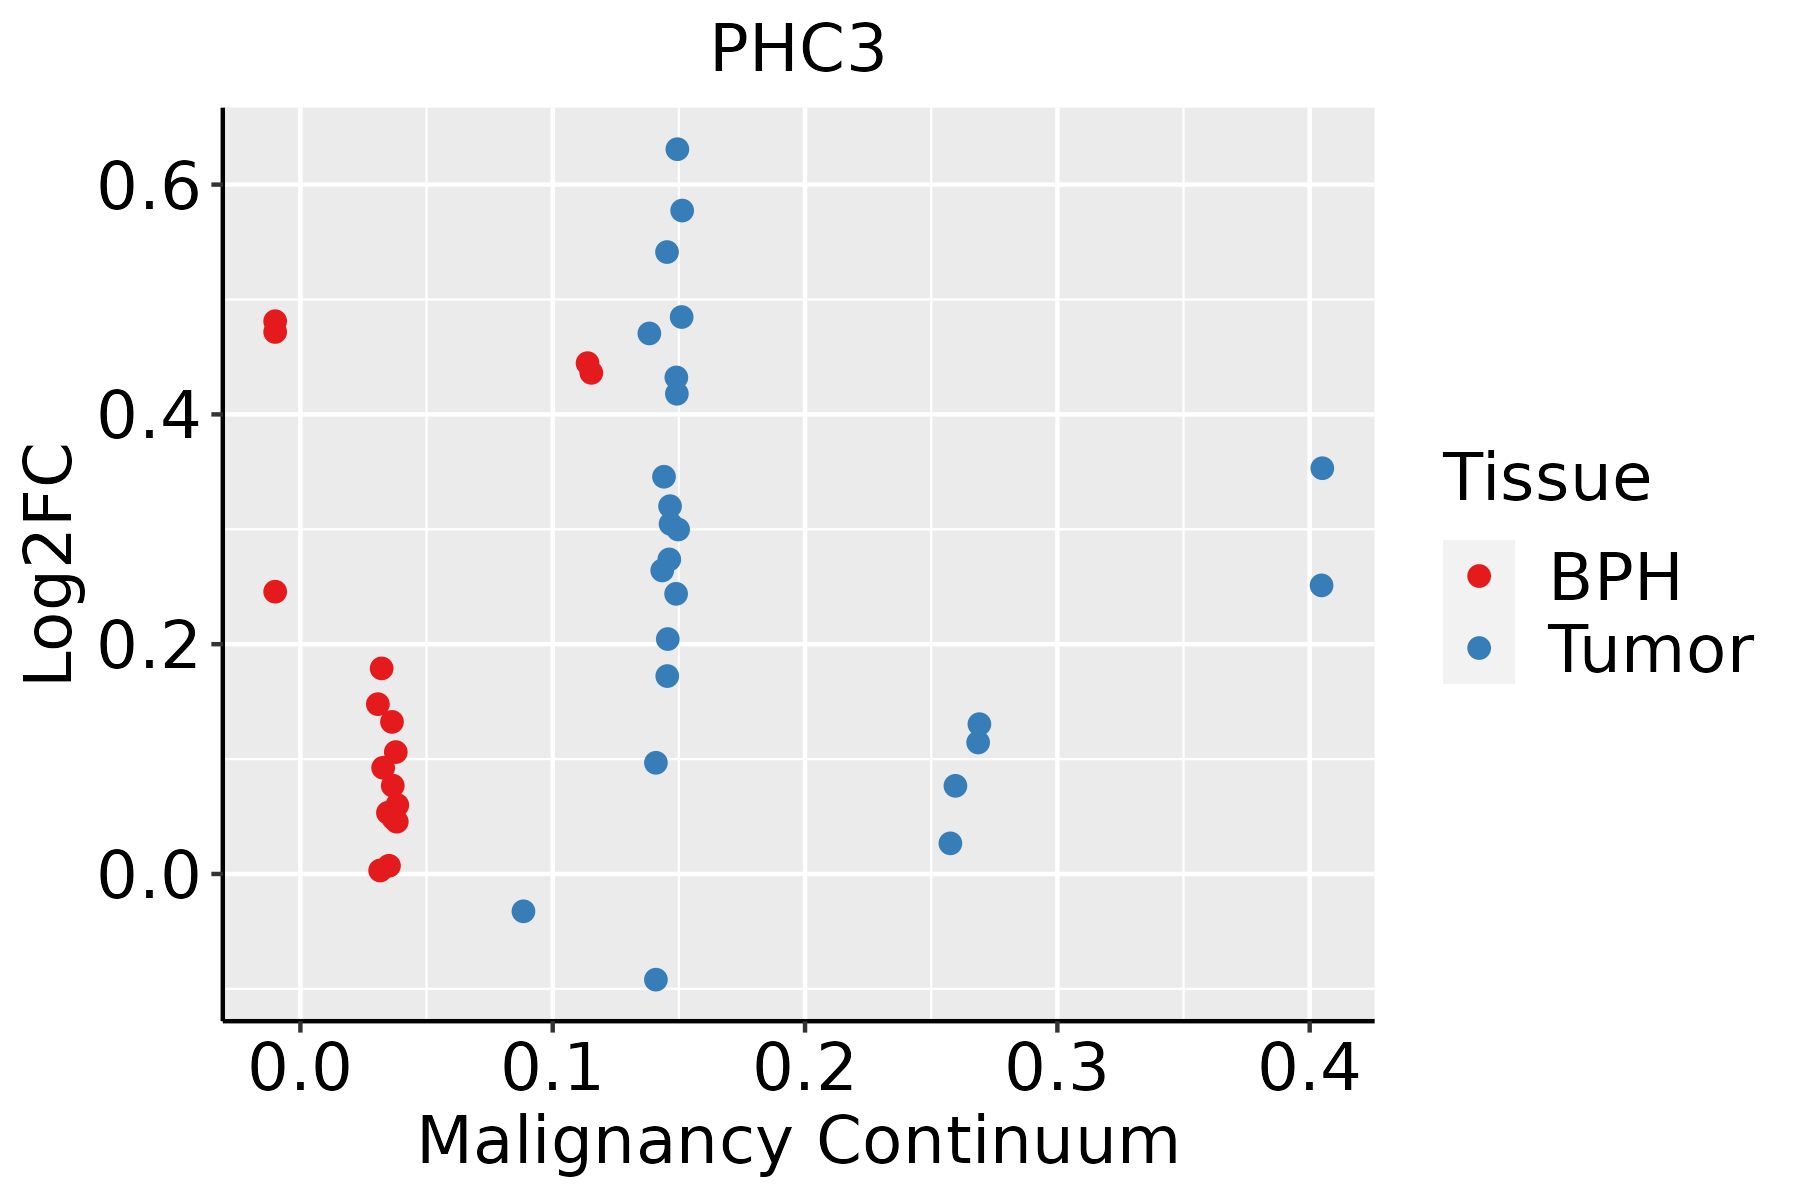 | BPH: Benign Prostatic Hyperplasia |
| Thyroid | 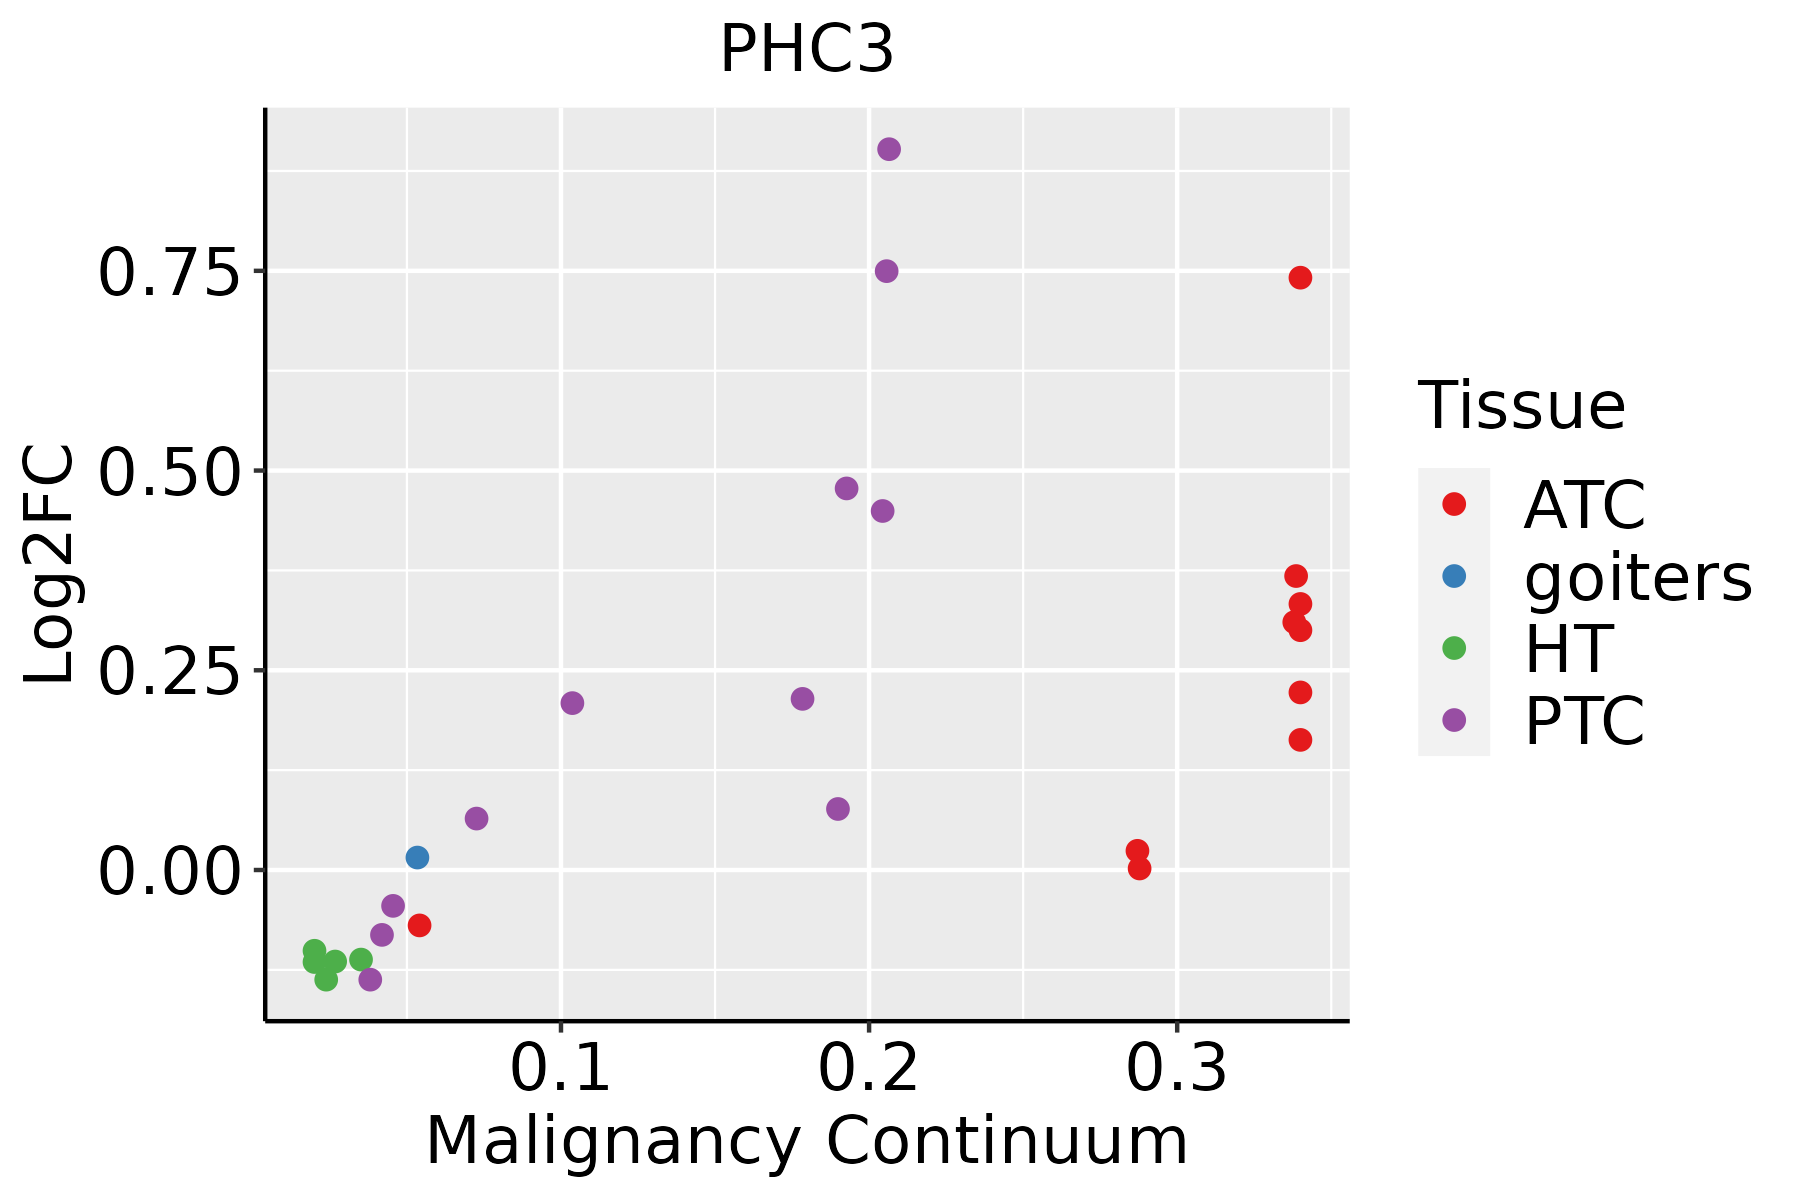 | ATC: Anaplastic thyroid cancer |
| HT: Hashimoto's thyroiditis | ||
| PTC: Papillary thyroid cancer |
| ∗log2FC in expression of this searched gene in stem-like cells from each diseased tissue sample relative to stem-like cells in normal samples in each tissue plotted against the malignancy continuum. Samples are colored based on if they are from different disease stage. |
Top |
Malignant transformation related pathway analysis |
| Find out the enriched GO biological processes and KEGG pathways involved in transition from healthy to precancer to cancer |
| Tissue | Disease Stage | Enriched GO biological Processes |
| Colorectum | AD |  |
| Colorectum | SER |  |
| Colorectum | MSS |  |
| Colorectum | MSI-H |  |
| Colorectum | FAP |  |
| ∗Top 15 enriched GO BP terms are showed in the bar plot of each disease state in each tissue. Each row represents a significant GO biological process which is colored according to the -log10(p.adjust). |
| Page: 1 2 3 4 5 6 7 8 9 |
| GO ID | Tissue | Disease Stage | Description | Gene Ratio | Bg Ratio | pvalue | p.adjust | Count |
| Page: 1 |
| Pathway ID | Tissue | Disease Stage | Description | Gene Ratio | Bg Ratio | pvalue | p.adjust | qvalue | Count |
| Page: 1 |
Top |
Cell-cell communication analysis |
| Identification of potential cell-cell interactions between two cell types and their ligand-receptor pairs for different disease states |
| Ligand | Receptor | LRpair | Pathway | Tissue | Disease Stage |
| Page: 1 |
Top |
Single-cell gene regulatory network inference analysis |
| Find out the significant the regulons (TFs) and the target genes of each regulon across cell types for different disease states |
| TF | Cell Type | Tissue | Disease Stage | Target Gene | RSS | Regulon Activity |
| ∗The dot plots of a searched regulon are shown for all cell subpopulations in each disease state of each tissue based on the regulon specific score inferred using pySCENIC and by calculating the average expression. |
| Page: 1 |
Top |
Somatic mutation of malignant transformation related genes |
| Annotation of somatic variants for genes involved in malignant transformation |
| Hugo Symbol | Variant Class | Variant Classification | dbSNP RS | HGVSc | HGVSp | HGVSp Short | SWISSPROT | BIOTYPE | SIFT | PolyPhen | Tumor Sample Barcode | Tissue | Histology | Sex | Age | Stage | Therapy Types | Drugs | Outcome |
| PHC3 | SNV | Missense_Mutation | c.638N>T | p.Ser213Leu | p.S213L | Q8NDX5 | protein_coding | deleterious(0.02) | probably_damaging(0.978) | TCGA-A8-A0A7-01 | Breast | breast invasive carcinoma | Female | <65 | I/II | Unknown | Unknown | SD | |
| PHC3 | SNV | Missense_Mutation | c.720C>G | p.Ser240Arg | p.S240R | Q8NDX5 | protein_coding | deleterious(0.01) | possibly_damaging(0.696) | TCGA-AN-A04D-01 | Breast | breast invasive carcinoma | Female | <65 | I/II | Unknown | Unknown | SD | |
| PHC3 | SNV | Missense_Mutation | c.947C>G | p.Ser316Cys | p.S316C | Q8NDX5 | protein_coding | deleterious(0.02) | possibly_damaging(0.473) | TCGA-C8-A1HM-01 | Breast | breast invasive carcinoma | Female | >=65 | I/II | Chemotherapy | doxorubicin | CR | |
| PHC3 | SNV | Missense_Mutation | rs780757485 | c.1045N>G | p.Ile349Val | p.I349V | Q8NDX5 | protein_coding | tolerated(0.12) | benign(0) | TCGA-D8-A1XU-01 | Breast | breast invasive carcinoma | Female | <65 | I/II | Unknown | Unknown | SD |
| PHC3 | SNV | Missense_Mutation | c.203G>A | p.Arg68Gln | p.R68Q | Q8NDX5 | protein_coding | deleterious(0) | probably_damaging(0.995) | TCGA-2W-A8YY-01 | Cervix | cervical & endocervical cancer | Female | <65 | I/II | Chemotherapy | cisplatin | CR | |
| PHC3 | SNV | Missense_Mutation | rs368703405 | c.56N>T | p.Pro19Leu | p.P19L | Q8NDX5 | protein_coding | tolerated_low_confidence(0.08) | benign(0) | TCGA-EK-A2PI-01 | Cervix | cervical & endocervical cancer | Female | <65 | III/IV | Unknown | Unknown | SD |
| PHC3 | SNV | Missense_Mutation | novel | c.742N>G | p.Ser248Gly | p.S248G | Q8NDX5 | protein_coding | tolerated(0.14) | benign(0) | TCGA-A6-2672-01 | Colorectum | colon adenocarcinoma | Female | >=65 | III/IV | Unknown | Unknown | SD |
| PHC3 | SNV | Missense_Mutation | c.1910N>A | p.Gly637Glu | p.G637E | Q8NDX5 | protein_coding | deleterious(0.03) | possibly_damaging(0.774) | TCGA-AA-3492-01 | Colorectum | colon adenocarcinoma | Female | >=65 | I/II | Unknown | Unknown | SD | |
| PHC3 | SNV | Missense_Mutation | c.1469N>A | p.Gly490Asp | p.G490D | Q8NDX5 | protein_coding | deleterious(0.01) | benign(0.158) | TCGA-AA-3663-01 | Colorectum | colon adenocarcinoma | Male | <65 | I/II | Unknown | Unknown | SD | |
| PHC3 | SNV | Missense_Mutation | c.2945C>T | p.Ala982Val | p.A982V | Q8NDX5 | protein_coding | deleterious(0) | probably_damaging(0.999) | TCGA-AA-3672-01 | Colorectum | colon adenocarcinoma | Female | >=65 | III/IV | Unknown | Unknown | SD |
| Page: 1 2 3 4 5 6 7 8 9 |
Top |
Related drugs of malignant transformation related genes |
| Identification of chemicals and drugs interact with genes involved in malignant transfromation |
| (DGIdb 4.0) |
| Entrez ID | Symbol | Category | Interaction Types | Drug Claim Name | Drug Name | PMIDs |
| Page: 1 |

Copyright 2023-Present -The University of Texas Health Science Center at Houston |