
|
|||||
|
 | |
| |
| |
| |
| |
| |
|
Gene: PHC2 |
Gene summary for PHC2 |
| Gene information | Species | Human | Gene symbol | PHC2 | Gene ID | 1912 |
| Gene name | polyhomeotic homolog 2 | |
| Gene Alias | EDR2 | |
| Cytomap | 1p35.1 | |
| Gene Type | protein-coding | GO ID | GO:0006139 | UniProtAcc | A0A0A0MSI2 |
Top |
Malignant transformation analysis |
| Identification of the aberrant gene expression in precancerous and cancerous lesions by comparing the gene expression of stem-like cells in diseased tissues with normal stem cells |
| Entrez ID | Symbol | Replicates | Species | Organ | Tissue | Adj P-value | Log2FC | Malignancy |
| 1912 | PHC2 | AEH-subject4 | Human | Endometrium | AEH | 1.22e-03 | 1.93e-01 | -0.2657 |
| 1912 | PHC2 | EEC-subject1 | Human | Endometrium | EEC | 4.88e-02 | -5.55e-03 | -0.2682 |
| 1912 | PHC2 | EEC-subject3 | Human | Endometrium | EEC | 9.38e-06 | -2.84e-02 | -0.2525 |
| 1912 | PHC2 | GSM5276934 | Human | Endometrium | EEC | 2.53e-12 | 4.34e-01 | -0.0913 |
| 1912 | PHC2 | GSM5276937 | Human | Endometrium | EEC | 1.94e-17 | 5.42e-01 | -0.0897 |
| 1912 | PHC2 | GSM6177620_NYU_UCEC1_lib1_lib1 | Human | Endometrium | EEC | 3.39e-13 | 1.84e-01 | -0.1869 |
| 1912 | PHC2 | GSM6177620_NYU_UCEC1_lib2_lib2 | Human | Endometrium | EEC | 1.61e-10 | 6.50e-02 | -0.1875 |
| 1912 | PHC2 | GSM6177620_NYU_UCEC1_lib3_lib3 | Human | Endometrium | EEC | 4.64e-16 | 7.38e-02 | -0.1883 |
| 1912 | PHC2 | GSM6177621_NYU_UCEC2_lib1_lib1 | Human | Endometrium | EEC | 2.62e-11 | -2.28e-02 | -0.1934 |
| 1912 | PHC2 | GSM6177622_NYU_UCEC3_lib1_lib1 | Human | Endometrium | EEC | 1.75e-18 | 1.18e-02 | -0.1917 |
| 1912 | PHC2 | GSM6177622_NYU_UCEC3_lib2_lib2 | Human | Endometrium | EEC | 2.18e-15 | 1.09e-01 | -0.1916 |
| 1912 | PHC2 | GSM6177623_NYU_UCEC3_Vis | Human | Endometrium | EEC | 7.84e-14 | 4.59e-01 | -0.1269 |
| 1912 | PHC2 | S43 | Human | Liver | Cirrhotic | 2.65e-02 | 1.54e-01 | -0.0187 |
| 1912 | PHC2 | HCC1_Meng | Human | Liver | HCC | 1.45e-50 | 1.97e-02 | 0.0246 |
| 1912 | PHC2 | HCC2_Meng | Human | Liver | HCC | 1.20e-11 | 1.29e-02 | 0.0107 |
| 1912 | PHC2 | cirrhotic3 | Human | Liver | Cirrhotic | 2.15e-02 | 1.16e-01 | 0.0215 |
| 1912 | PHC2 | HCC1 | Human | Liver | HCC | 1.13e-03 | 2.45e+00 | 0.5336 |
| 1912 | PHC2 | HCC2 | Human | Liver | HCC | 4.97e-13 | 3.54e+00 | 0.5341 |
| 1912 | PHC2 | Pt13.b | Human | Liver | HCC | 3.34e-03 | 5.75e-02 | 0.0251 |
| 1912 | PHC2 | S014 | Human | Liver | HCC | 1.16e-10 | 7.56e-01 | 0.2254 |
| Page: 1 2 3 |
| Tissue | Expression Dynamics | Abbreviation |
| Endometrium |  | AEH: Atypical endometrial hyperplasia |
| EEC: Endometrioid Cancer | ||
| Liver |  | HCC: Hepatocellular carcinoma |
| NAFLD: Non-alcoholic fatty liver disease | ||
| Lung | 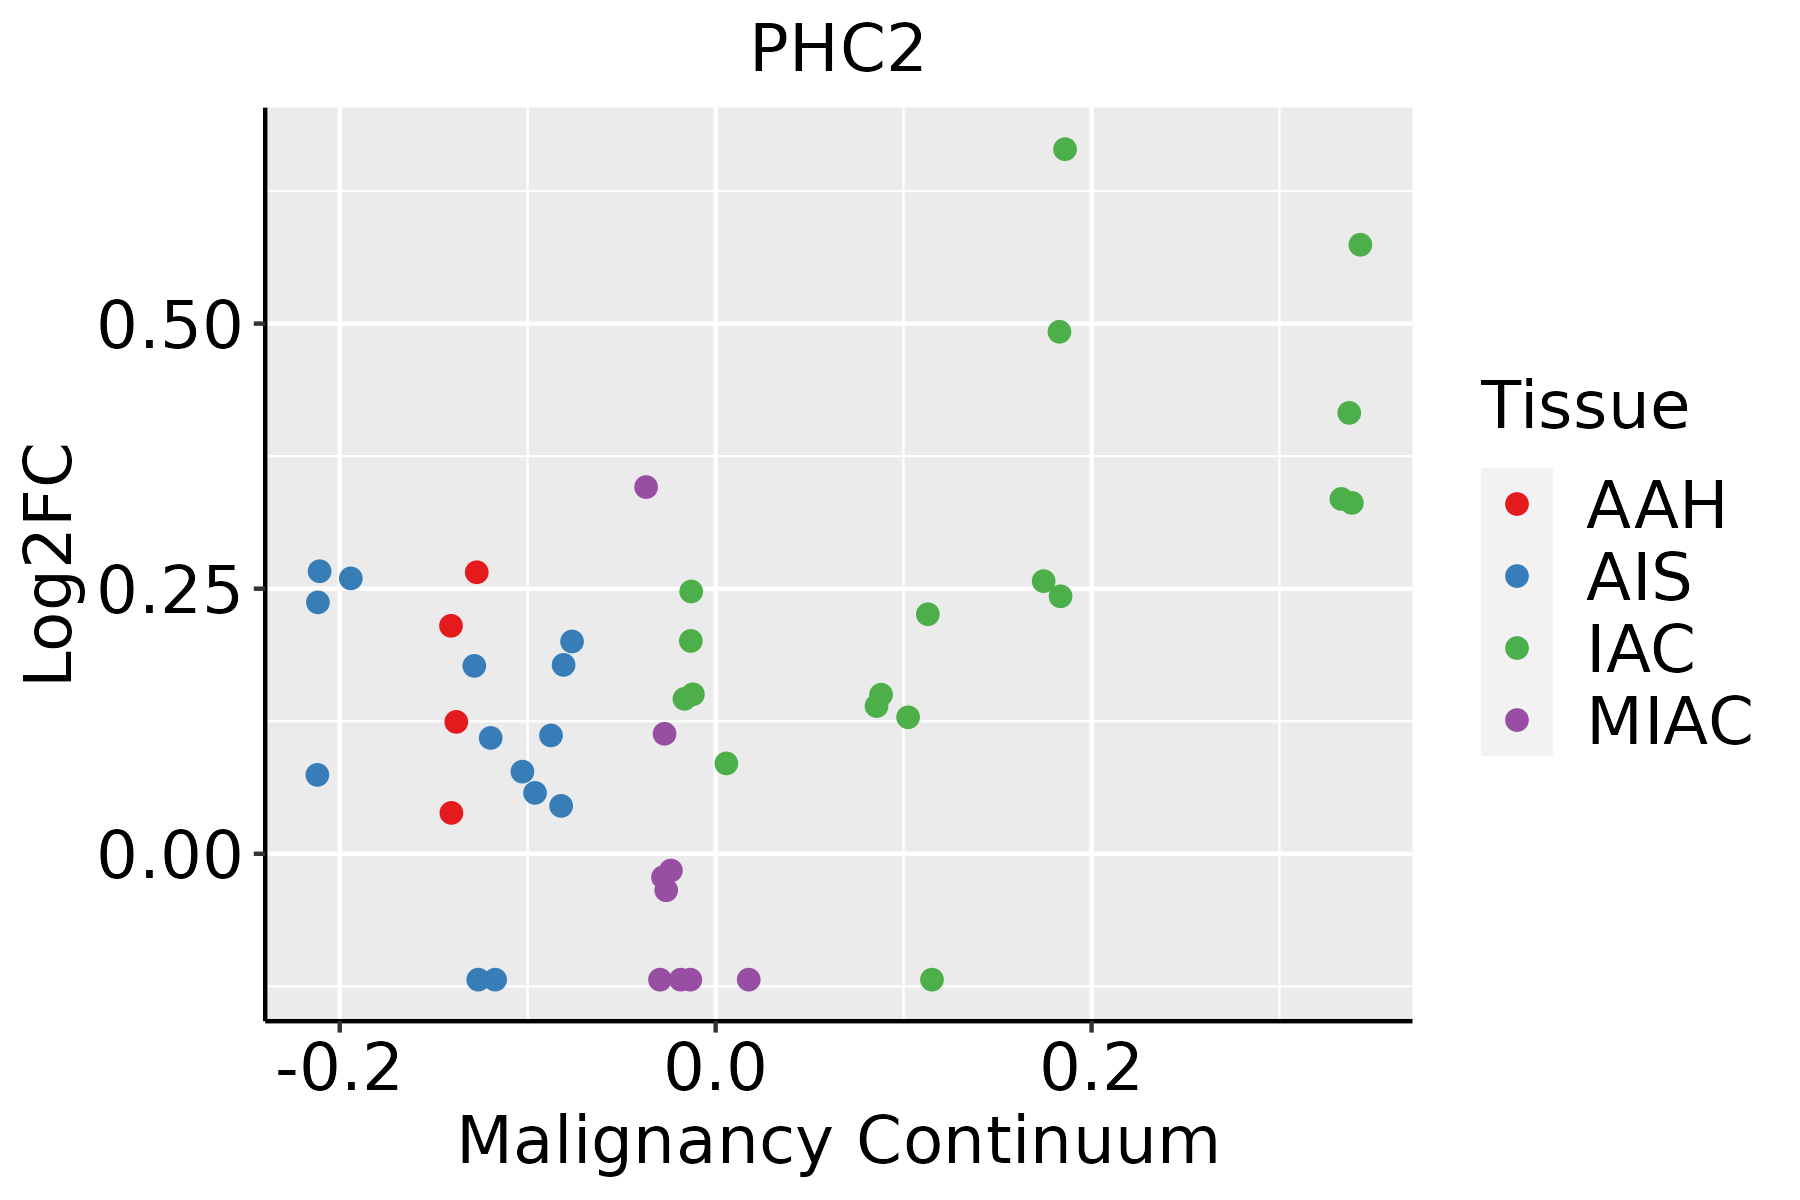 | AAH: Atypical adenomatous hyperplasia |
| AIS: Adenocarcinoma in situ | ||
| IAC: Invasive lung adenocarcinoma | ||
| MIA: Minimally invasive adenocarcinoma | ||
| Oral Cavity |  | EOLP: Erosive Oral lichen planus |
| LP: leukoplakia | ||
| NEOLP: Non-erosive oral lichen planus | ||
| OSCC: Oral squamous cell carcinoma | ||
| Thyroid | 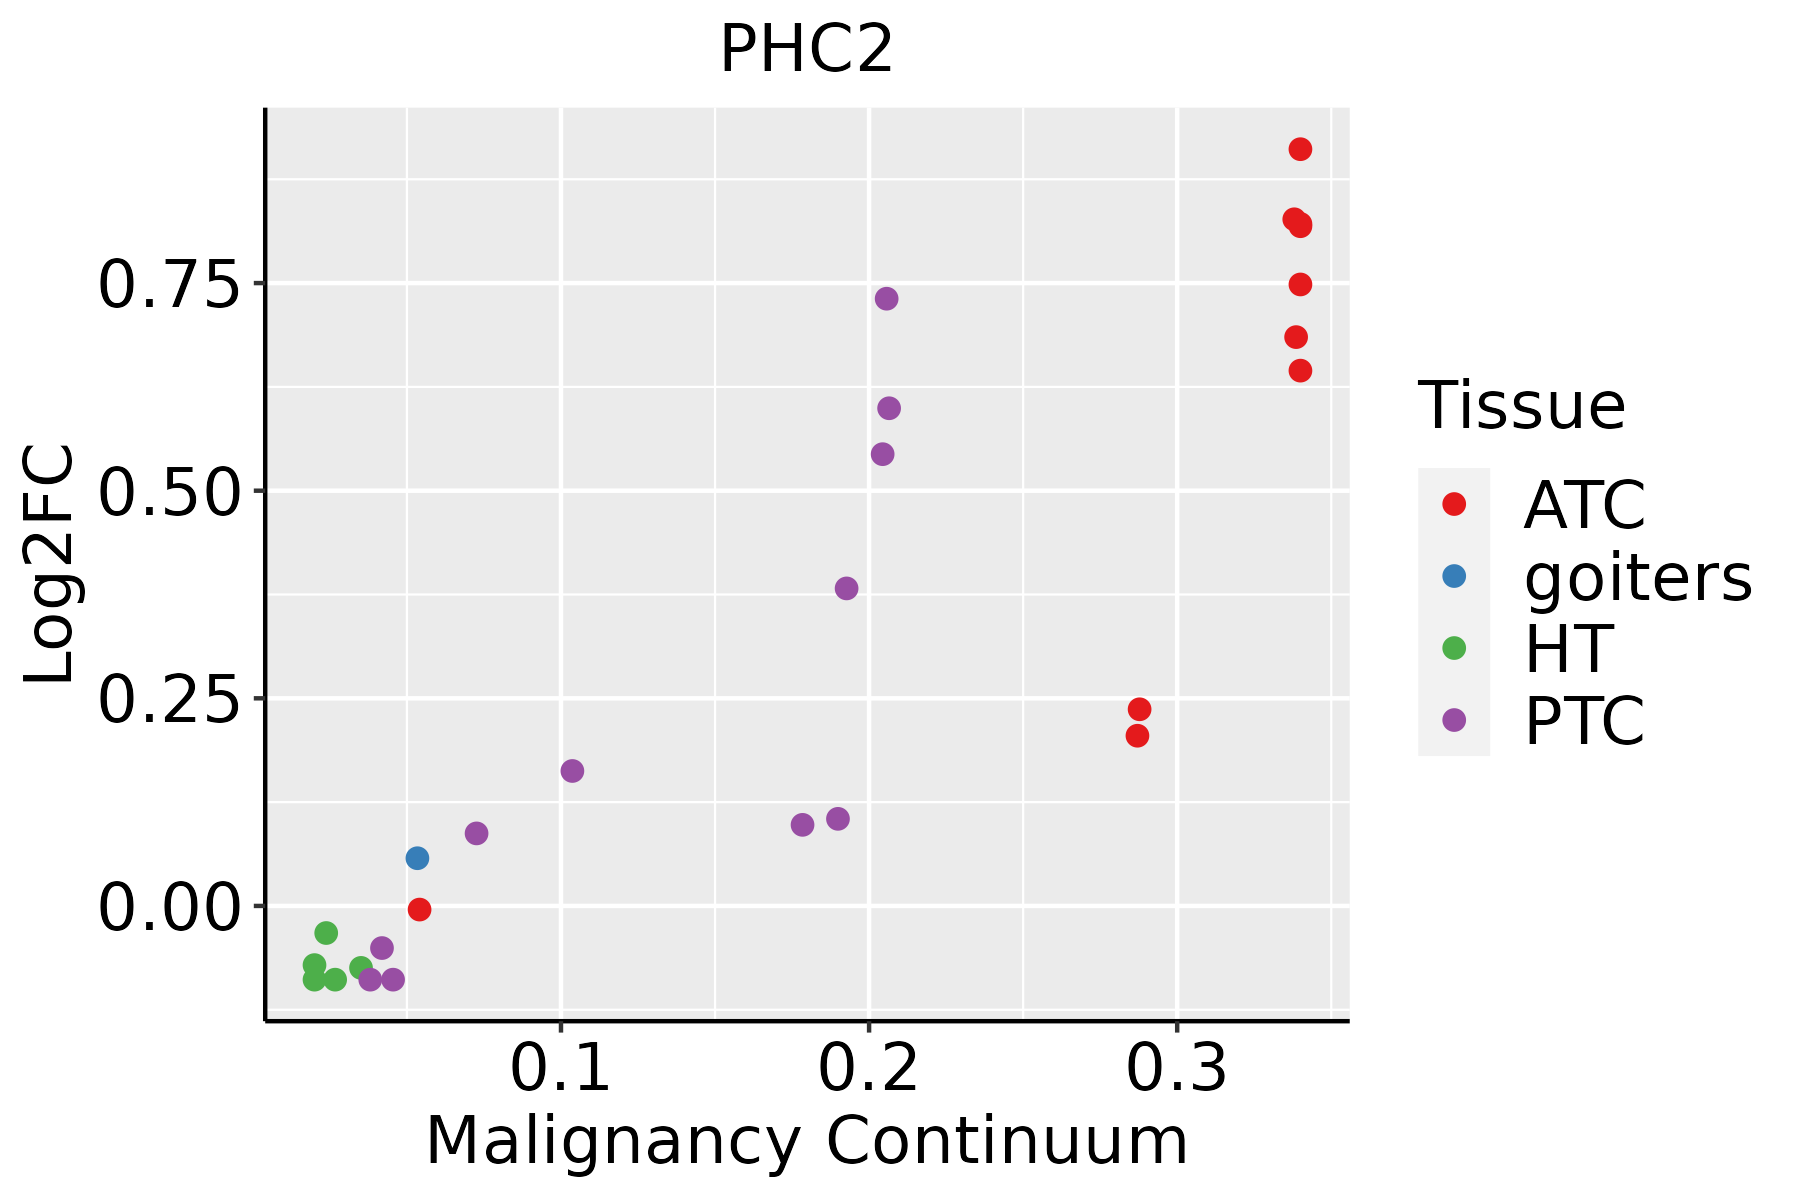 | ATC: Anaplastic thyroid cancer |
| HT: Hashimoto's thyroiditis | ||
| PTC: Papillary thyroid cancer |
| ∗log2FC in expression of this searched gene in stem-like cells from each diseased tissue sample relative to stem-like cells in normal samples in each tissue plotted against the malignancy continuum. Samples are colored based on if they are from different disease stage. |
Top |
Malignant transformation related pathway analysis |
| Find out the enriched GO biological processes and KEGG pathways involved in transition from healthy to precancer to cancer |
| Tissue | Disease Stage | Enriched GO biological Processes |
| Colorectum | AD |  |
| Colorectum | SER |  |
| Colorectum | MSS |  |
| Colorectum | MSI-H |  |
| Colorectum | FAP |  |
| ∗Top 15 enriched GO BP terms are showed in the bar plot of each disease state in each tissue. Each row represents a significant GO biological process which is colored according to the -log10(p.adjust). |
| Page: 1 2 3 4 5 6 7 8 9 |
| GO ID | Tissue | Disease Stage | Description | Gene Ratio | Bg Ratio | pvalue | p.adjust | Count |
| Page: 1 |
| Pathway ID | Tissue | Disease Stage | Description | Gene Ratio | Bg Ratio | pvalue | p.adjust | qvalue | Count |
| Page: 1 |
Top |
Cell-cell communication analysis |
| Identification of potential cell-cell interactions between two cell types and their ligand-receptor pairs for different disease states |
| Ligand | Receptor | LRpair | Pathway | Tissue | Disease Stage |
| Page: 1 |
Top |
Single-cell gene regulatory network inference analysis |
| Find out the significant the regulons (TFs) and the target genes of each regulon across cell types for different disease states |
| TF | Cell Type | Tissue | Disease Stage | Target Gene | RSS | Regulon Activity |
| ∗The dot plots of a searched regulon are shown for all cell subpopulations in each disease state of each tissue based on the regulon specific score inferred using pySCENIC and by calculating the average expression. |
| Page: 1 |
Top |
Somatic mutation of malignant transformation related genes |
| Annotation of somatic variants for genes involved in malignant transformation |
| Hugo Symbol | Variant Class | Variant Classification | dbSNP RS | HGVSc | HGVSp | HGVSp Short | SWISSPROT | BIOTYPE | SIFT | PolyPhen | Tumor Sample Barcode | Tissue | Histology | Sex | Age | Stage | Therapy Types | Drugs | Outcome |
| PHC2 | SNV | Missense_Mutation | c.1928N>C | p.Glu643Ala | p.E643A | Q8IXK0 | protein_coding | deleterious(0) | probably_damaging(0.989) | TCGA-BH-A0BW-01 | Breast | breast invasive carcinoma | Female | >=65 | I/II | Chemotherapy | adriamycin | CR | |
| PHC2 | SNV | Missense_Mutation | c.1927N>A | p.Glu643Lys | p.E643K | Q8IXK0 | protein_coding | deleterious(0.01) | probably_damaging(0.985) | TCGA-BH-A0BW-01 | Breast | breast invasive carcinoma | Female | >=65 | I/II | Chemotherapy | adriamycin | CR | |
| PHC2 | SNV | Missense_Mutation | c.610N>C | p.Val204Leu | p.V204L | Q8IXK0 | protein_coding | tolerated(0.09) | benign(0.273) | TCGA-BH-A18P-01 | Breast | breast invasive carcinoma | Female | <65 | I/II | Unknown | Unknown | PD | |
| PHC2 | SNV | Missense_Mutation | rs773965245 | c.2095N>T | p.Arg699Trp | p.R699W | Q8IXK0 | protein_coding | deleterious(0) | probably_damaging(0.998) | TCGA-C8-A1HI-01 | Breast | breast invasive carcinoma | Female | <65 | III/IV | Unknown | Unknown | SD |
| PHC2 | SNV | Missense_Mutation | c.2011N>T | p.Val671Leu | p.V671L | Q8IXK0 | protein_coding | deleterious(0) | probably_damaging(0.988) | TCGA-C8-A26V-01 | Breast | breast invasive carcinoma | Female | <65 | III/IV | Hormone Therapy | tamoxiphen | CR | |
| PHC2 | SNV | Missense_Mutation | c.1862N>T | p.Ser621Leu | p.S621L | Q8IXK0 | protein_coding | deleterious(0.02) | probably_damaging(0.992) | TCGA-C8-A278-01 | Breast | breast invasive carcinoma | Female | <65 | III/IV | Hormone Therapy | tamoxiphen | SD | |
| PHC2 | insertion | Frame_Shift_Ins | novel | c.199_200insTCCAGCTCATGTCTGCAAATTCTCTGTGGGGGGCGGTGGCTGGG | p.Gln67LeufsTer105 | p.Q67Lfs*105 | Q8IXK0 | protein_coding | TCGA-BH-A0HF-01 | Breast | breast invasive carcinoma | Female | >=65 | I/II | Hormone Therapy | arimidex | SD | ||
| PHC2 | deletion | Frame_Shift_Del | novel | c.2332delG | p.Asp778ThrfsTer19 | p.D778Tfs*19 | Q8IXK0 | protein_coding | TCGA-D8-A27V-01 | Breast | breast invasive carcinoma | Female | <65 | I/II | Hormone Therapy | tamoxiphen | SD | ||
| PHC2 | deletion | Frame_Shift_Del | novel | c.2009delA | p.Asn670ThrfsTer61 | p.N670Tfs*61 | Q8IXK0 | protein_coding | TCGA-D8-A27V-01 | Breast | breast invasive carcinoma | Female | <65 | I/II | Hormone Therapy | tamoxiphen | SD | ||
| PHC2 | SNV | Missense_Mutation | rs371688704 | c.2410C>T | p.Arg804Cys | p.R804C | Q8IXK0 | protein_coding | tolerated(0.14) | benign(0.391) | TCGA-2W-A8YY-01 | Cervix | cervical & endocervical cancer | Female | <65 | I/II | Chemotherapy | cisplatin | CR |
| Page: 1 2 3 4 5 6 7 8 9 |
Top |
Related drugs of malignant transformation related genes |
| Identification of chemicals and drugs interact with genes involved in malignant transfromation |
| (DGIdb 4.0) |
| Entrez ID | Symbol | Category | Interaction Types | Drug Claim Name | Drug Name | PMIDs |
| Page: 1 |

Copyright 2023-Present -The University of Texas Health Science Center at Houston |