
|
|||||
|
 | |
| |
| |
| |
| |
| |
|
Gene: PHACTR2 |
Gene summary for PHACTR2 |
| Gene information | Species | Human | Gene symbol | PHACTR2 | Gene ID | 9749 |
| Gene name | phosphatase and actin regulator 2 | |
| Gene Alias | C6orf56 | |
| Cytomap | 6q24.2 | |
| Gene Type | protein-coding | GO ID | GO:0006996 | UniProtAcc | O75167 |
Top |
Malignant transformation analysis |
| Identification of the aberrant gene expression in precancerous and cancerous lesions by comparing the gene expression of stem-like cells in diseased tissues with normal stem cells |
| Entrez ID | Symbol | Replicates | Species | Organ | Tissue | Adj P-value | Log2FC | Malignancy |
| 9749 | PHACTR2 | HTA11_3410_2000001011 | Human | Colorectum | AD | 2.40e-14 | -5.02e-01 | 0.0155 |
| 9749 | PHACTR2 | HTA11_347_2000001011 | Human | Colorectum | AD | 1.45e-15 | 7.45e-01 | -0.1954 |
| 9749 | PHACTR2 | HTA11_411_2000001011 | Human | Colorectum | SER | 3.95e-04 | 5.51e-01 | -0.2602 |
| 9749 | PHACTR2 | HTA11_7696_3000711011 | Human | Colorectum | AD | 8.32e-09 | -4.48e-01 | 0.0674 |
| 9749 | PHACTR2 | HTA11_6818_2000001021 | Human | Colorectum | AD | 1.83e-03 | -4.11e-01 | 0.0588 |
| 9749 | PHACTR2 | HTA11_99999970781_79442 | Human | Colorectum | MSS | 1.53e-14 | -5.88e-01 | 0.294 |
| 9749 | PHACTR2 | HTA11_99999965104_69814 | Human | Colorectum | MSS | 7.11e-09 | 7.54e-01 | 0.281 |
| 9749 | PHACTR2 | HTA11_99999974143_84620 | Human | Colorectum | MSS | 2.41e-17 | -5.90e-01 | 0.3005 |
| 9749 | PHACTR2 | A001-C-207 | Human | Colorectum | FAP | 1.30e-02 | -1.98e-01 | 0.1278 |
| 9749 | PHACTR2 | A015-C-203 | Human | Colorectum | FAP | 5.70e-32 | -6.53e-01 | -0.1294 |
| 9749 | PHACTR2 | A015-C-204 | Human | Colorectum | FAP | 5.05e-08 | -5.33e-01 | -0.0228 |
| 9749 | PHACTR2 | A014-C-040 | Human | Colorectum | FAP | 2.57e-05 | -5.47e-01 | -0.1184 |
| 9749 | PHACTR2 | A002-C-201 | Human | Colorectum | FAP | 6.72e-16 | -5.77e-01 | 0.0324 |
| 9749 | PHACTR2 | A001-C-119 | Human | Colorectum | FAP | 1.52e-12 | -6.73e-01 | -0.1557 |
| 9749 | PHACTR2 | A001-C-108 | Human | Colorectum | FAP | 1.85e-16 | -4.58e-01 | -0.0272 |
| 9749 | PHACTR2 | A002-C-205 | Human | Colorectum | FAP | 1.76e-27 | -6.41e-01 | -0.1236 |
| 9749 | PHACTR2 | A014-C-108 | Human | Colorectum | FAP | 8.31e-03 | -4.56e-01 | -0.124 |
| 9749 | PHACTR2 | A001-C-104 | Human | Colorectum | FAP | 1.17e-02 | -2.62e-01 | 0.0184 |
| 9749 | PHACTR2 | A015-C-005 | Human | Colorectum | FAP | 5.71e-03 | -3.13e-01 | -0.0336 |
| 9749 | PHACTR2 | A015-C-006 | Human | Colorectum | FAP | 3.91e-25 | -8.64e-01 | -0.0994 |
| Page: 1 2 3 4 5 6 7 8 9 |
| Tissue | Expression Dynamics | Abbreviation |
| Colorectum (GSE201348) |  | FAP: Familial adenomatous polyposis |
| CRC: Colorectal cancer | ||
| Colorectum (HTA11) |  | AD: Adenomas |
| SER: Sessile serrated lesions | ||
| MSI-H: Microsatellite-high colorectal cancer | ||
| MSS: Microsatellite stable colorectal cancer | ||
| Esophagus | 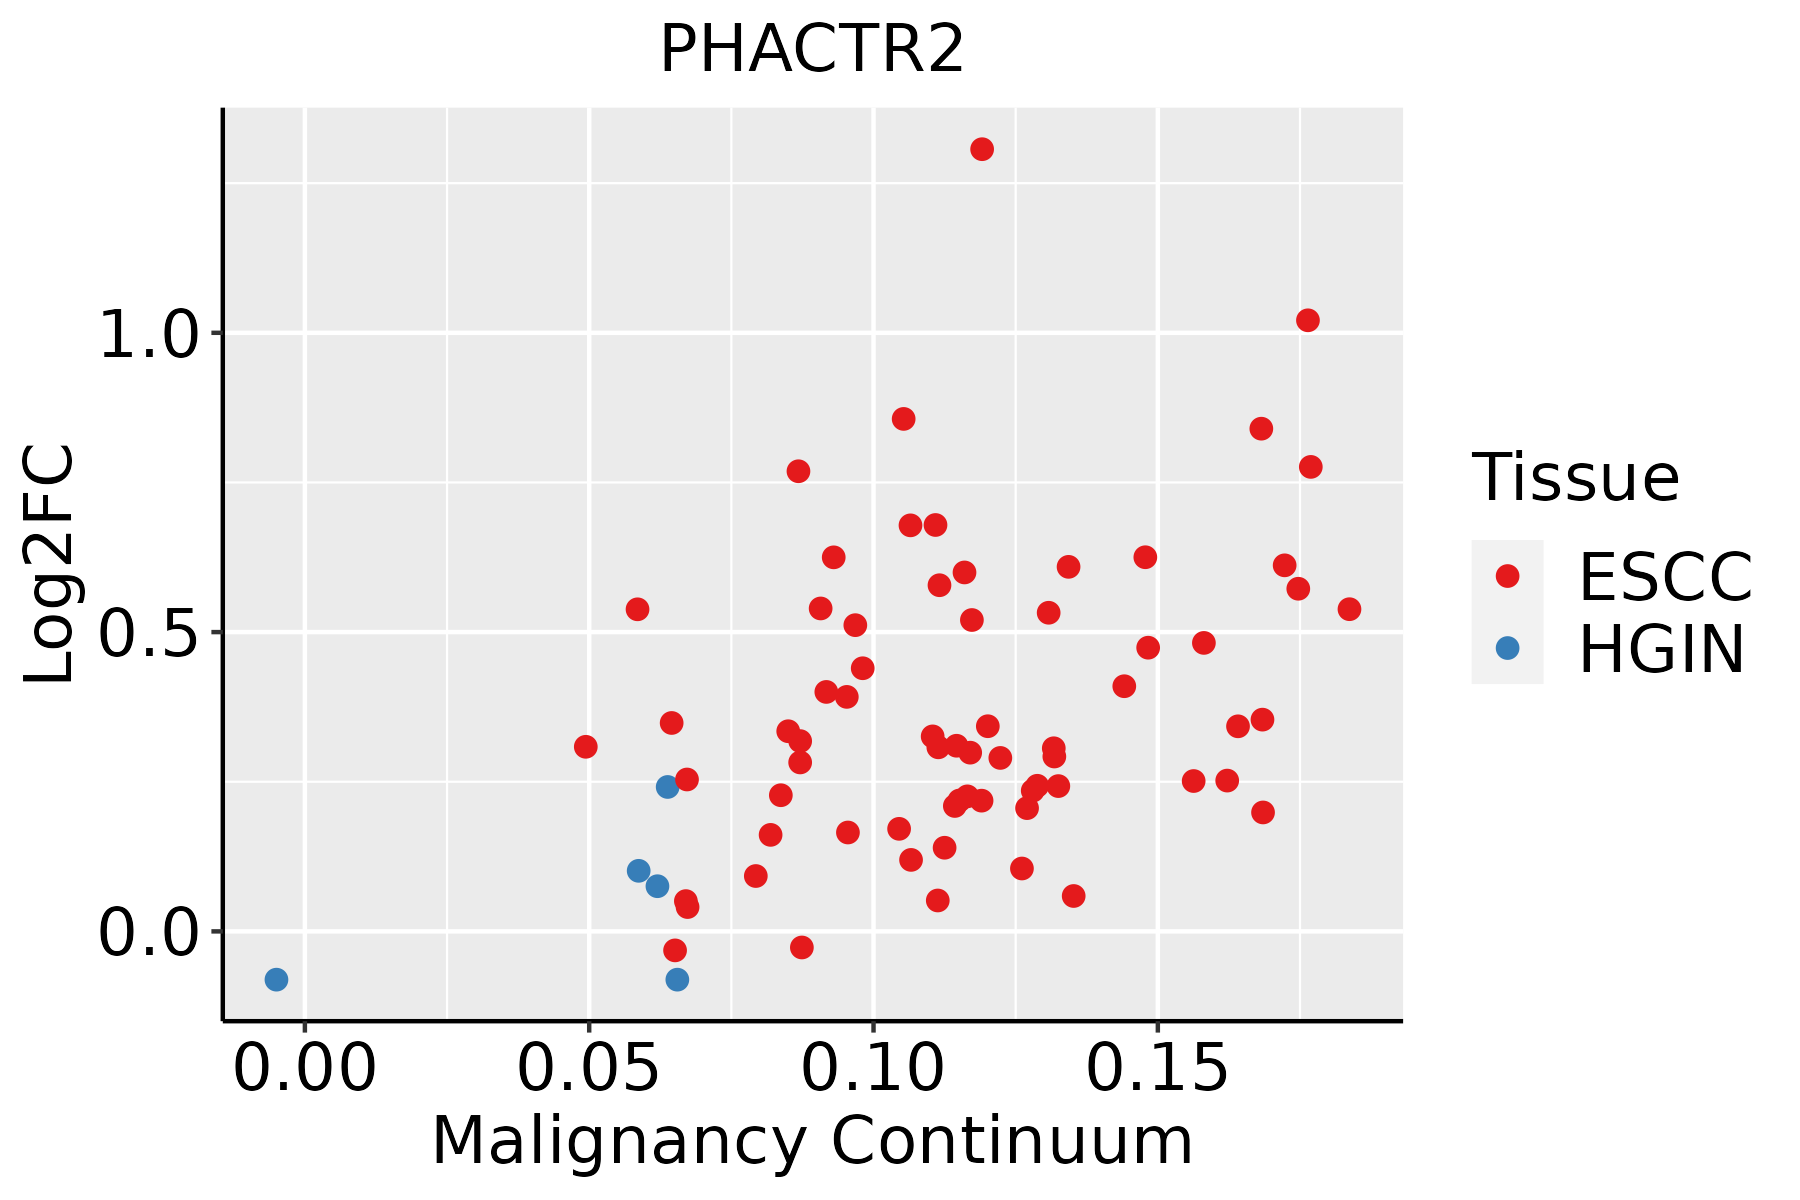 | ESCC: Esophageal squamous cell carcinoma |
| HGIN: High-grade intraepithelial neoplasias | ||
| LGIN: Low-grade intraepithelial neoplasias | ||
| GC | 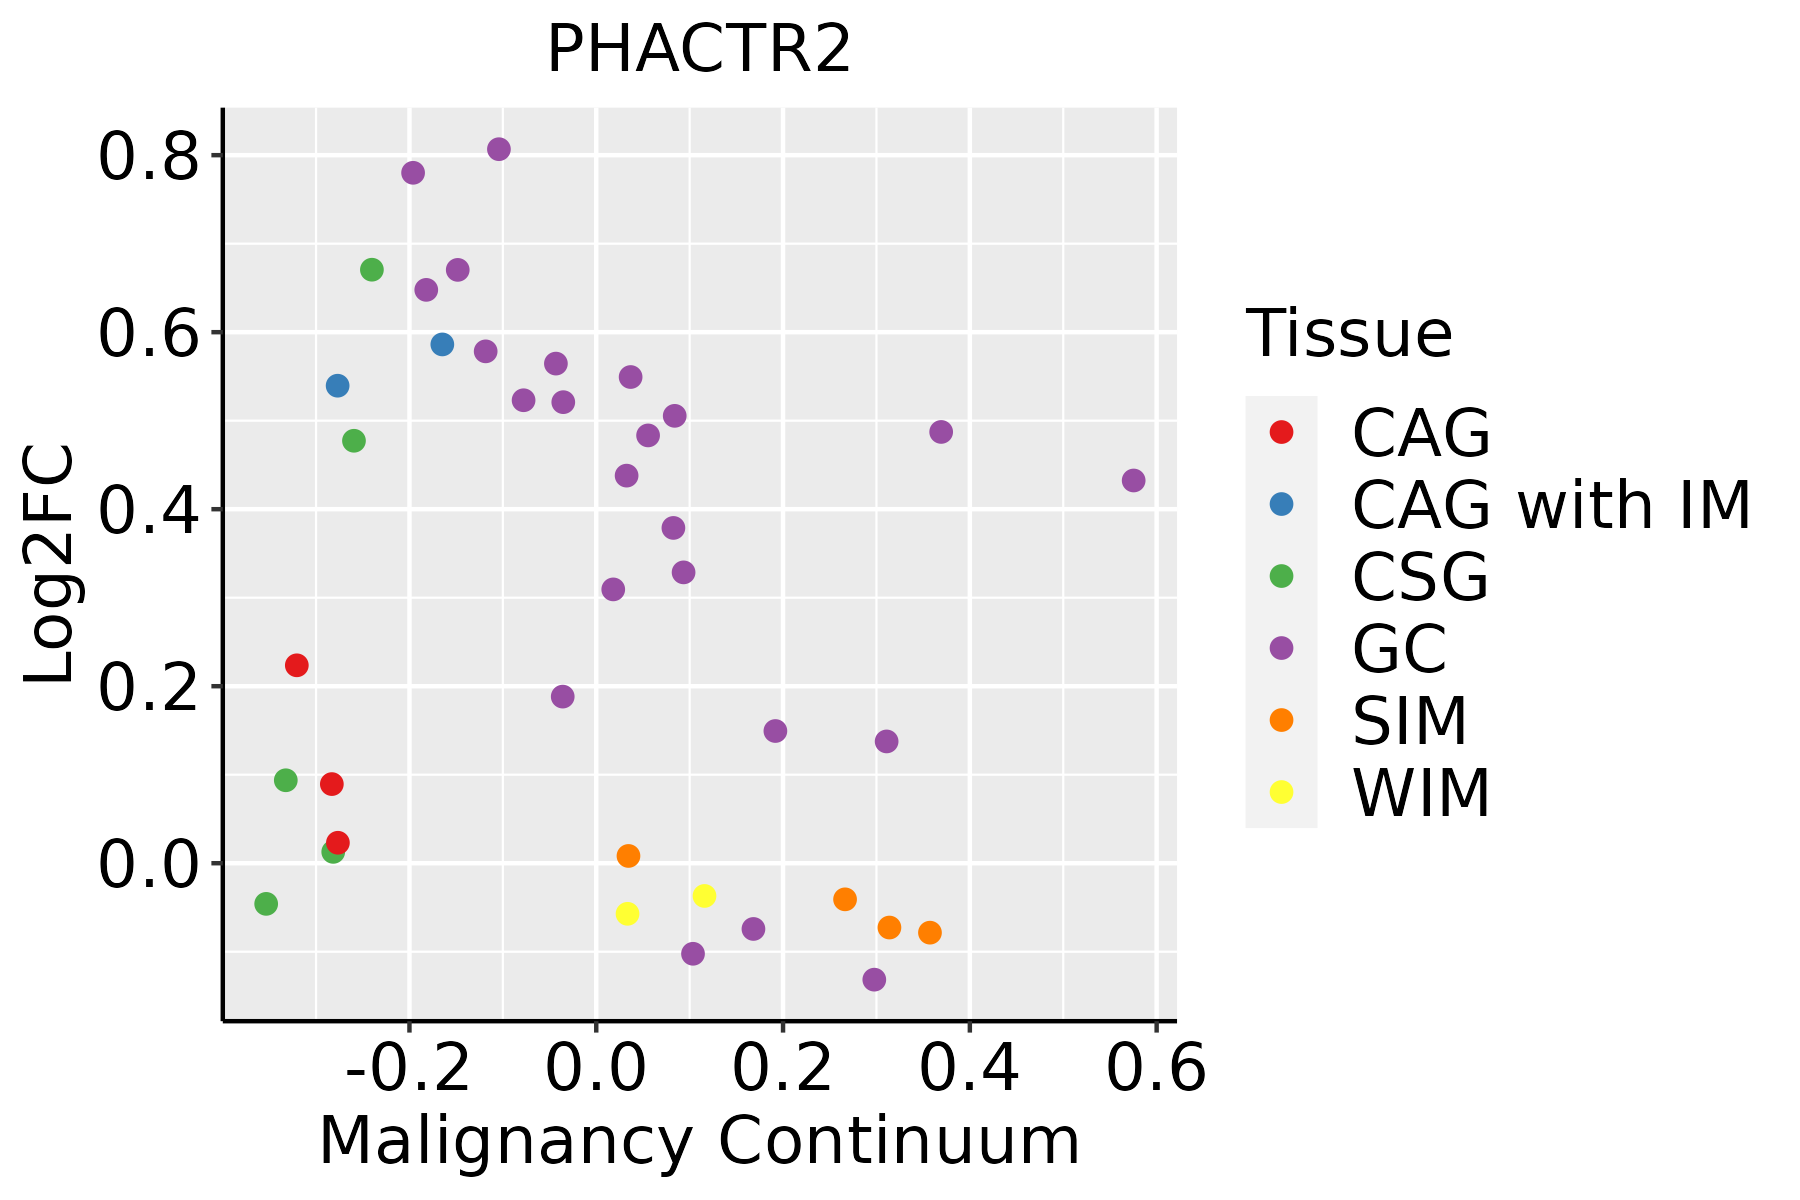 | CAG: Chronic atrophic gastritis |
| CAG with IM: Chronic atrophic gastritis with intestinal metaplasia | ||
| CSG: Chronic superficial gastritis | ||
| GC: Gastric cancer | ||
| SIM: Severe intestinal metaplasia | ||
| WIM: Wild intestinal metaplasia | ||
| Liver |  | HCC: Hepatocellular carcinoma |
| NAFLD: Non-alcoholic fatty liver disease | ||
| Lung | 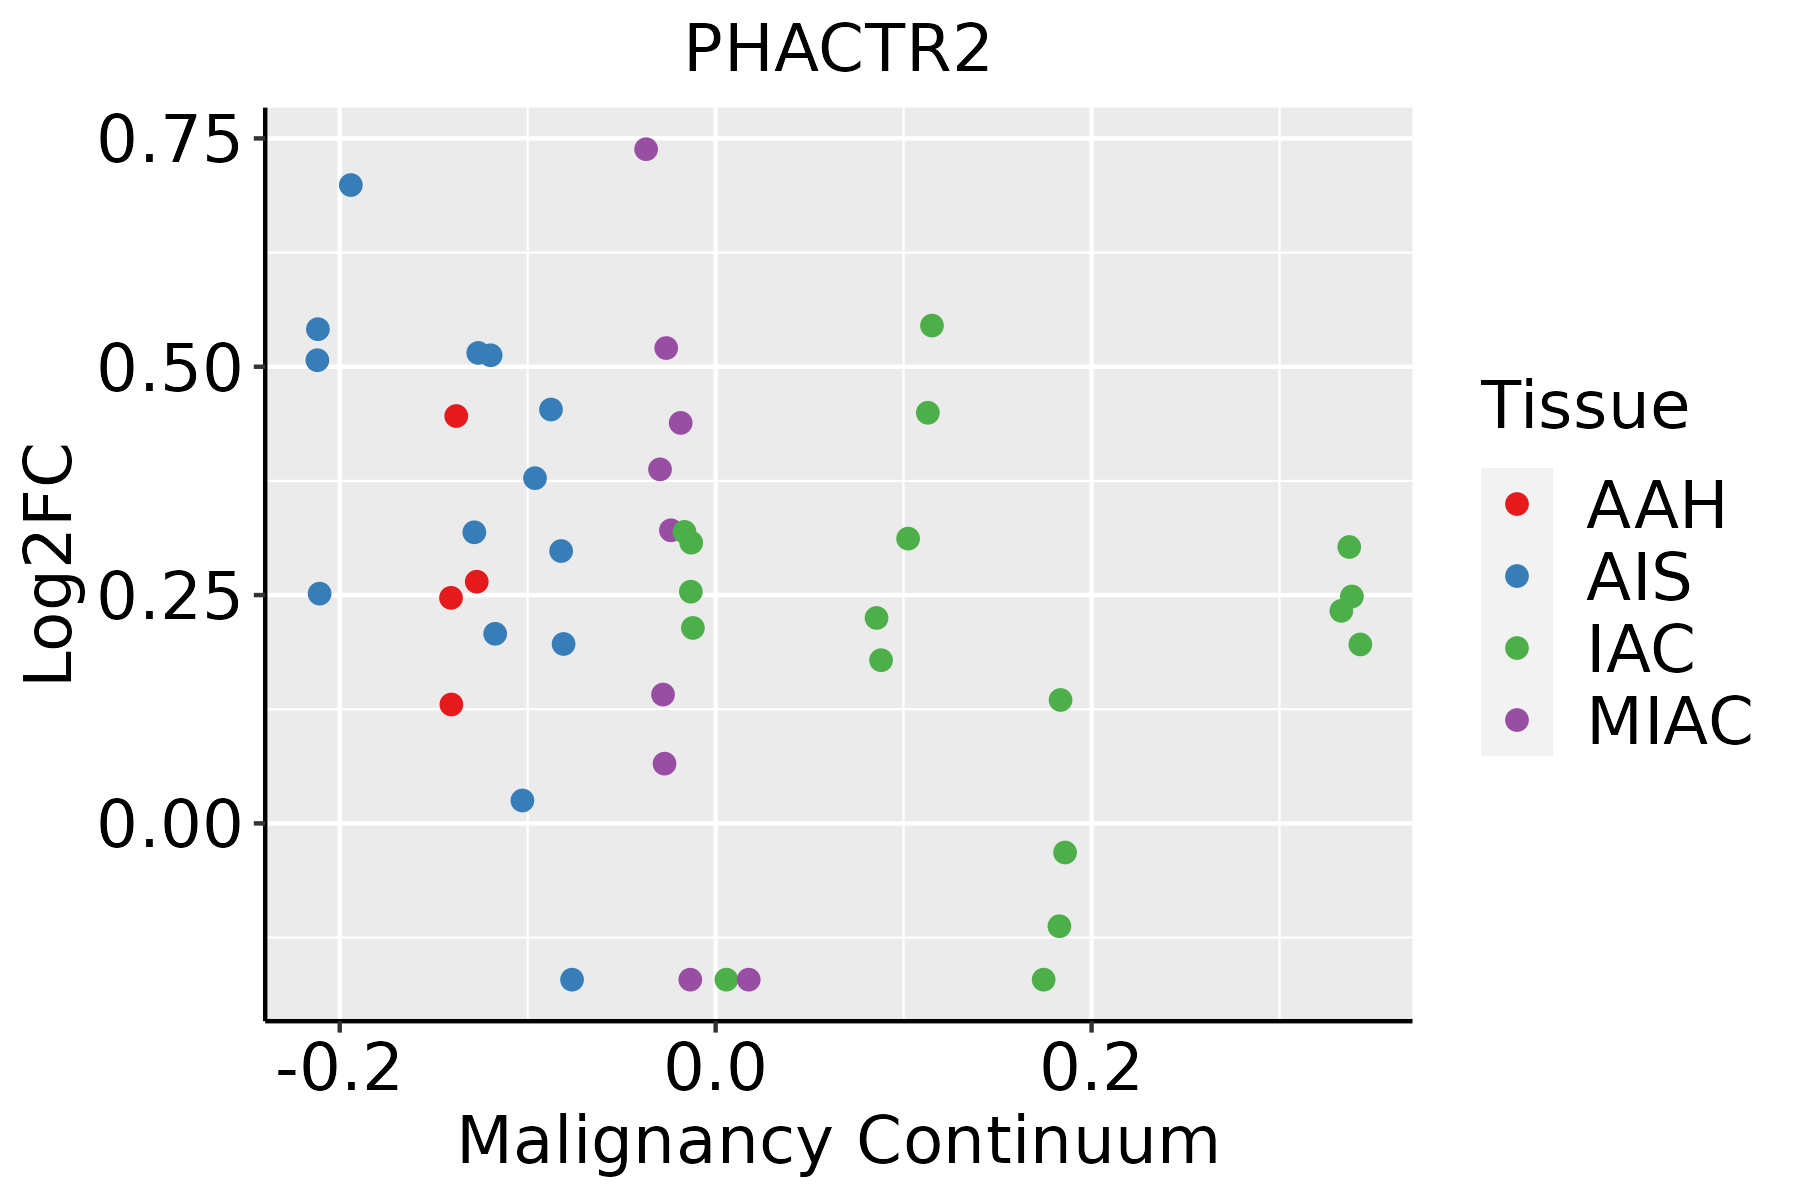 | AAH: Atypical adenomatous hyperplasia |
| AIS: Adenocarcinoma in situ | ||
| IAC: Invasive lung adenocarcinoma | ||
| MIA: Minimally invasive adenocarcinoma | ||
| Oral Cavity |  | EOLP: Erosive Oral lichen planus |
| LP: leukoplakia | ||
| NEOLP: Non-erosive oral lichen planus | ||
| OSCC: Oral squamous cell carcinoma | ||
| Thyroid | 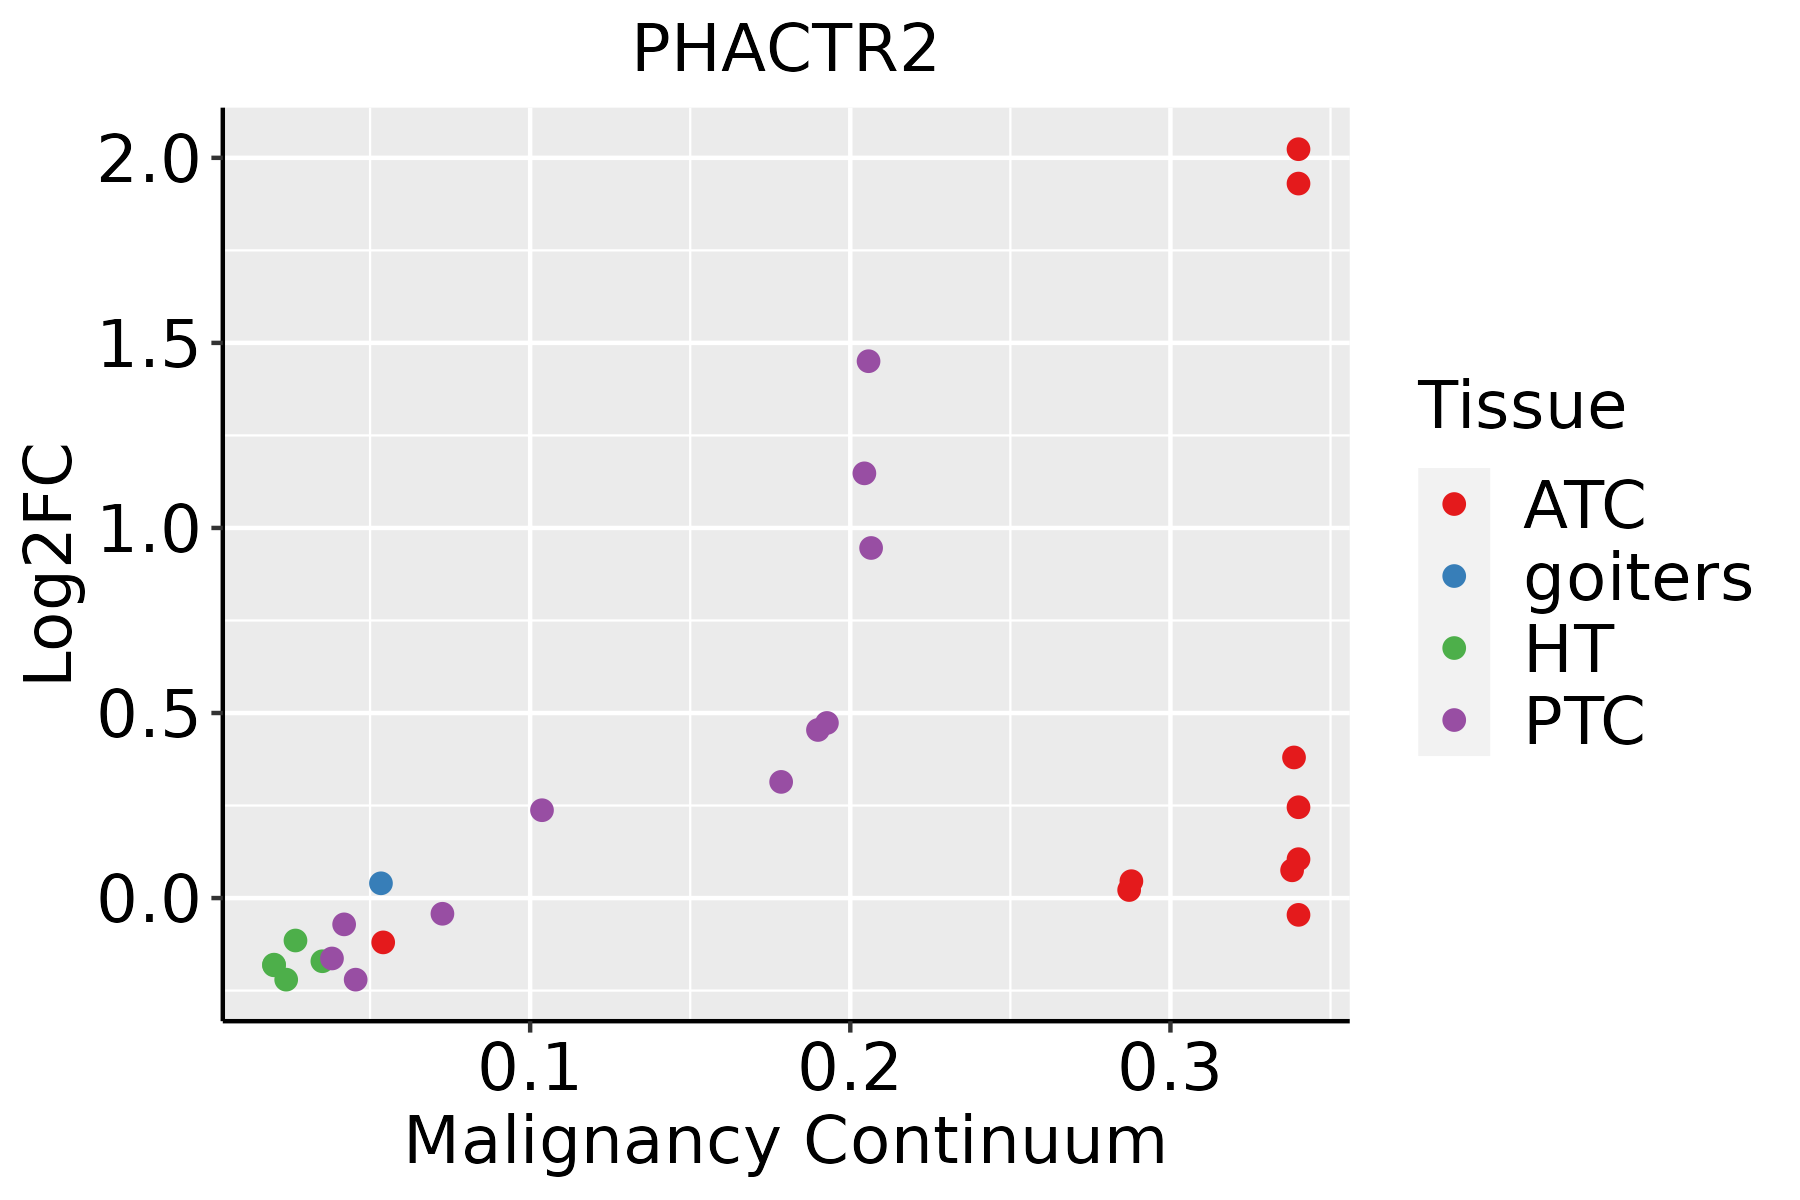 | ATC: Anaplastic thyroid cancer |
| HT: Hashimoto's thyroiditis | ||
| PTC: Papillary thyroid cancer |
| ∗log2FC in expression of this searched gene in stem-like cells from each diseased tissue sample relative to stem-like cells in normal samples in each tissue plotted against the malignancy continuum. Samples are colored based on if they are from different disease stage. |
Top |
Malignant transformation related pathway analysis |
| Find out the enriched GO biological processes and KEGG pathways involved in transition from healthy to precancer to cancer |
| Tissue | Disease Stage | Enriched GO biological Processes |
| Colorectum | AD |  |
| Colorectum | SER |  |
| Colorectum | MSS |  |
| Colorectum | MSI-H |  |
| Colorectum | FAP |  |
| ∗Top 15 enriched GO BP terms are showed in the bar plot of each disease state in each tissue. Each row represents a significant GO biological process which is colored according to the -log10(p.adjust). |
| Page: 1 2 3 4 5 6 7 8 9 |
| GO ID | Tissue | Disease Stage | Description | Gene Ratio | Bg Ratio | pvalue | p.adjust | Count |
| Page: 1 |
| Pathway ID | Tissue | Disease Stage | Description | Gene Ratio | Bg Ratio | pvalue | p.adjust | qvalue | Count |
| Page: 1 |
Top |
Cell-cell communication analysis |
| Identification of potential cell-cell interactions between two cell types and their ligand-receptor pairs for different disease states |
| Ligand | Receptor | LRpair | Pathway | Tissue | Disease Stage |
| Page: 1 |
Top |
Single-cell gene regulatory network inference analysis |
| Find out the significant the regulons (TFs) and the target genes of each regulon across cell types for different disease states |
| TF | Cell Type | Tissue | Disease Stage | Target Gene | RSS | Regulon Activity |
| ∗The dot plots of a searched regulon are shown for all cell subpopulations in each disease state of each tissue based on the regulon specific score inferred using pySCENIC and by calculating the average expression. |
| Page: 1 |
Top |
Somatic mutation of malignant transformation related genes |
| Annotation of somatic variants for genes involved in malignant transformation |
| Hugo Symbol | Variant Class | Variant Classification | dbSNP RS | HGVSc | HGVSp | HGVSp Short | SWISSPROT | BIOTYPE | SIFT | PolyPhen | Tumor Sample Barcode | Tissue | Histology | Sex | Age | Stage | Therapy Types | Drugs | Outcome |
| PHACTR2 | SNV | Missense_Mutation | novel | c.1454G>T | p.Arg485Leu | p.R485L | O75167 | protein_coding | tolerated(0.16) | benign(0.135) | TCGA-A2-A3XY-01 | Breast | breast invasive carcinoma | Female | <65 | I/II | Chemotherapy | adriamycin | PD |
| PHACTR2 | SNV | Missense_Mutation | rs766386038 | c.482N>T | p.Pro161Leu | p.P161L | O75167 | protein_coding | deleterious(0.01) | benign(0.09) | TCGA-A8-A06X-01 | Breast | breast invasive carcinoma | Female | >=65 | I/II | Unknown | Unknown | SD |
| PHACTR2 | SNV | Missense_Mutation | c.954G>T | p.Gln318His | p.Q318H | O75167 | protein_coding | deleterious_low_confidence(0) | possibly_damaging(0.465) | TCGA-AC-A23H-01 | Breast | breast invasive carcinoma | Female | >=65 | I/II | Unknown | Unknown | PD | |
| PHACTR2 | SNV | Missense_Mutation | c.122N>C | p.Arg41Thr | p.R41T | O75167 | protein_coding | deleterious(0) | probably_damaging(0.993) | TCGA-E2-A1LG-01 | Breast | breast invasive carcinoma | Female | <65 | I/II | Chemotherapy | doxorubicin | SD | |
| PHACTR2 | SNV | Missense_Mutation | c.122G>T | p.Arg41Ile | p.R41I | O75167 | protein_coding | deleterious(0) | probably_damaging(0.997) | TCGA-E9-A295-01 | Breast | breast invasive carcinoma | Female | >=65 | I/II | Hormone Therapy | tamoxiphen | SD | |
| PHACTR2 | SNV | Missense_Mutation | c.1162G>A | p.Glu388Lys | p.E388K | O75167 | protein_coding | deleterious_low_confidence(0.01) | probably_damaging(0.991) | TCGA-DR-A0ZM-01 | Cervix | cervical & endocervical cancer | Female | <65 | III/IV | Unspecific | Cisplatin | SD | |
| PHACTR2 | SNV | Missense_Mutation | rs770231609 | c.1690N>T | p.Arg564Cys | p.R564C | O75167 | protein_coding | deleterious(0) | probably_damaging(0.988) | TCGA-AA-3821-01 | Colorectum | colon adenocarcinoma | Female | >=65 | I/II | Unknown | Unknown | SD |
| PHACTR2 | SNV | Missense_Mutation | novel | c.641A>C | p.Gln214Pro | p.Q214P | O75167 | protein_coding | deleterious(0.02) | probably_damaging(0.994) | TCGA-AA-A01R-01 | Colorectum | colon adenocarcinoma | Male | <65 | III/IV | Chemotherapy | 5-fluorouracil | PD |
| PHACTR2 | SNV | Missense_Mutation | c.949N>A | p.Glu317Lys | p.E317K | O75167 | protein_coding | deleterious_low_confidence(0.03) | benign(0.003) | TCGA-AD-5900-01 | Colorectum | colon adenocarcinoma | Male | >=65 | I/II | Unknown | Unknown | SD | |
| PHACTR2 | SNV | Missense_Mutation | rs754968655 | c.743N>T | p.Ser248Leu | p.S248L | O75167 | protein_coding | tolerated(0.07) | probably_damaging(0.995) | TCGA-EI-6917-01 | Colorectum | rectum adenocarcinoma | Male | <65 | III/IV | Chemotherapy | 5fluorouracil+oxaciplatina+l-folinian | SD |
| Page: 1 2 3 4 5 6 7 8 9 |
Top |
Related drugs of malignant transformation related genes |
| Identification of chemicals and drugs interact with genes involved in malignant transfromation |
| (DGIdb 4.0) |
| Entrez ID | Symbol | Category | Interaction Types | Drug Claim Name | Drug Name | PMIDs |
| Page: 1 |

Copyright 2023-Present -The University of Texas Health Science Center at Houston |