
|
|||||
|
 | |
| |
| |
| |
| |
| |
|
Gene: PHACTR1 |
Gene summary for PHACTR1 |
| Gene information | Species | Human | Gene symbol | PHACTR1 | Gene ID | 221692 |
| Gene name | phosphatase and actin regulator 1 | |
| Gene Alias | DEE70 | |
| Cytomap | 6p24.1 | |
| Gene Type | protein-coding | GO ID | GO:0000902 | UniProtAcc | B4DHU0 |
Top |
Malignant transformation analysis |
| Identification of the aberrant gene expression in precancerous and cancerous lesions by comparing the gene expression of stem-like cells in diseased tissues with normal stem cells |
| Entrez ID | Symbol | Replicates | Species | Organ | Tissue | Adj P-value | Log2FC | Malignancy |
| 221692 | PHACTR1 | AEH-subject1 | Human | Endometrium | AEH | 3.15e-05 | 2.83e-01 | -0.3059 |
| 221692 | PHACTR1 | AEH-subject2 | Human | Endometrium | AEH | 2.96e-05 | 2.89e-01 | -0.2525 |
| 221692 | PHACTR1 | AEH-subject5 | Human | Endometrium | AEH | 5.78e-03 | 2.52e-01 | -0.2953 |
| 221692 | PHACTR1 | EEC-subject1 | Human | Endometrium | EEC | 1.04e-02 | 2.29e-01 | -0.2682 |
| 221692 | PHACTR1 | EEC-subject2 | Human | Endometrium | EEC | 7.00e-03 | 2.06e-01 | -0.2607 |
| 221692 | PHACTR1 | TD9 | Human | Lung | IAC | 2.76e-03 | 6.29e-01 | 0.088 |
| 221692 | PHACTR1 | RNA-P10T2-P10T2-1 | Human | Lung | AAH | 1.04e-02 | 9.62e-01 | -0.1271 |
| 221692 | PHACTR1 | RNA-P10T2-P10T2-2 | Human | Lung | AAH | 1.77e-03 | 8.46e-01 | -0.1406 |
| 221692 | PHACTR1 | RNA-P10T2-P10T2-3 | Human | Lung | AAH | 1.89e-02 | 8.42e-01 | -0.1408 |
| 221692 | PHACTR1 | RNA-P25T1-P25T1-1 | Human | Lung | AIS | 1.65e-31 | 1.43e+00 | -0.2116 |
| 221692 | PHACTR1 | RNA-P25T1-P25T1-2 | Human | Lung | AIS | 1.11e-12 | 1.30e+00 | -0.1941 |
| 221692 | PHACTR1 | RNA-P25T1-P25T1-3 | Human | Lung | AIS | 2.15e-22 | 1.41e+00 | -0.2107 |
| 221692 | PHACTR1 | RNA-P25T1-P25T1-4 | Human | Lung | AIS | 2.65e-32 | 1.54e+00 | -0.2119 |
| 221692 | PHACTR1 | RNA-P6T2-P6T2-1 | Human | Lung | IAC | 1.34e-17 | 6.07e-01 | -0.0166 |
| 221692 | PHACTR1 | RNA-P6T2-P6T2-2 | Human | Lung | IAC | 2.68e-18 | 6.03e-01 | -0.0132 |
| 221692 | PHACTR1 | RNA-P6T2-P6T2-3 | Human | Lung | IAC | 3.53e-23 | 6.44e-01 | -0.013 |
| 221692 | PHACTR1 | RNA-P6T2-P6T2-4 | Human | Lung | IAC | 3.49e-15 | 5.85e-01 | -0.0121 |
| 221692 | PHACTR1 | RNA-P7T1-P7T1-1 | Human | Lung | AIS | 2.78e-02 | 6.18e-01 | -0.0961 |
| 221692 | PHACTR1 | RNA-P7T1-P7T1-2 | Human | Lung | AIS | 5.23e-07 | 7.45e-01 | -0.0876 |
| 221692 | PHACTR1 | RNA-P7T1-P7T1-3 | Human | Lung | AIS | 3.02e-08 | 8.31e-01 | -0.0822 |
| Page: 1 2 |
| Tissue | Expression Dynamics | Abbreviation |
| Endometrium | 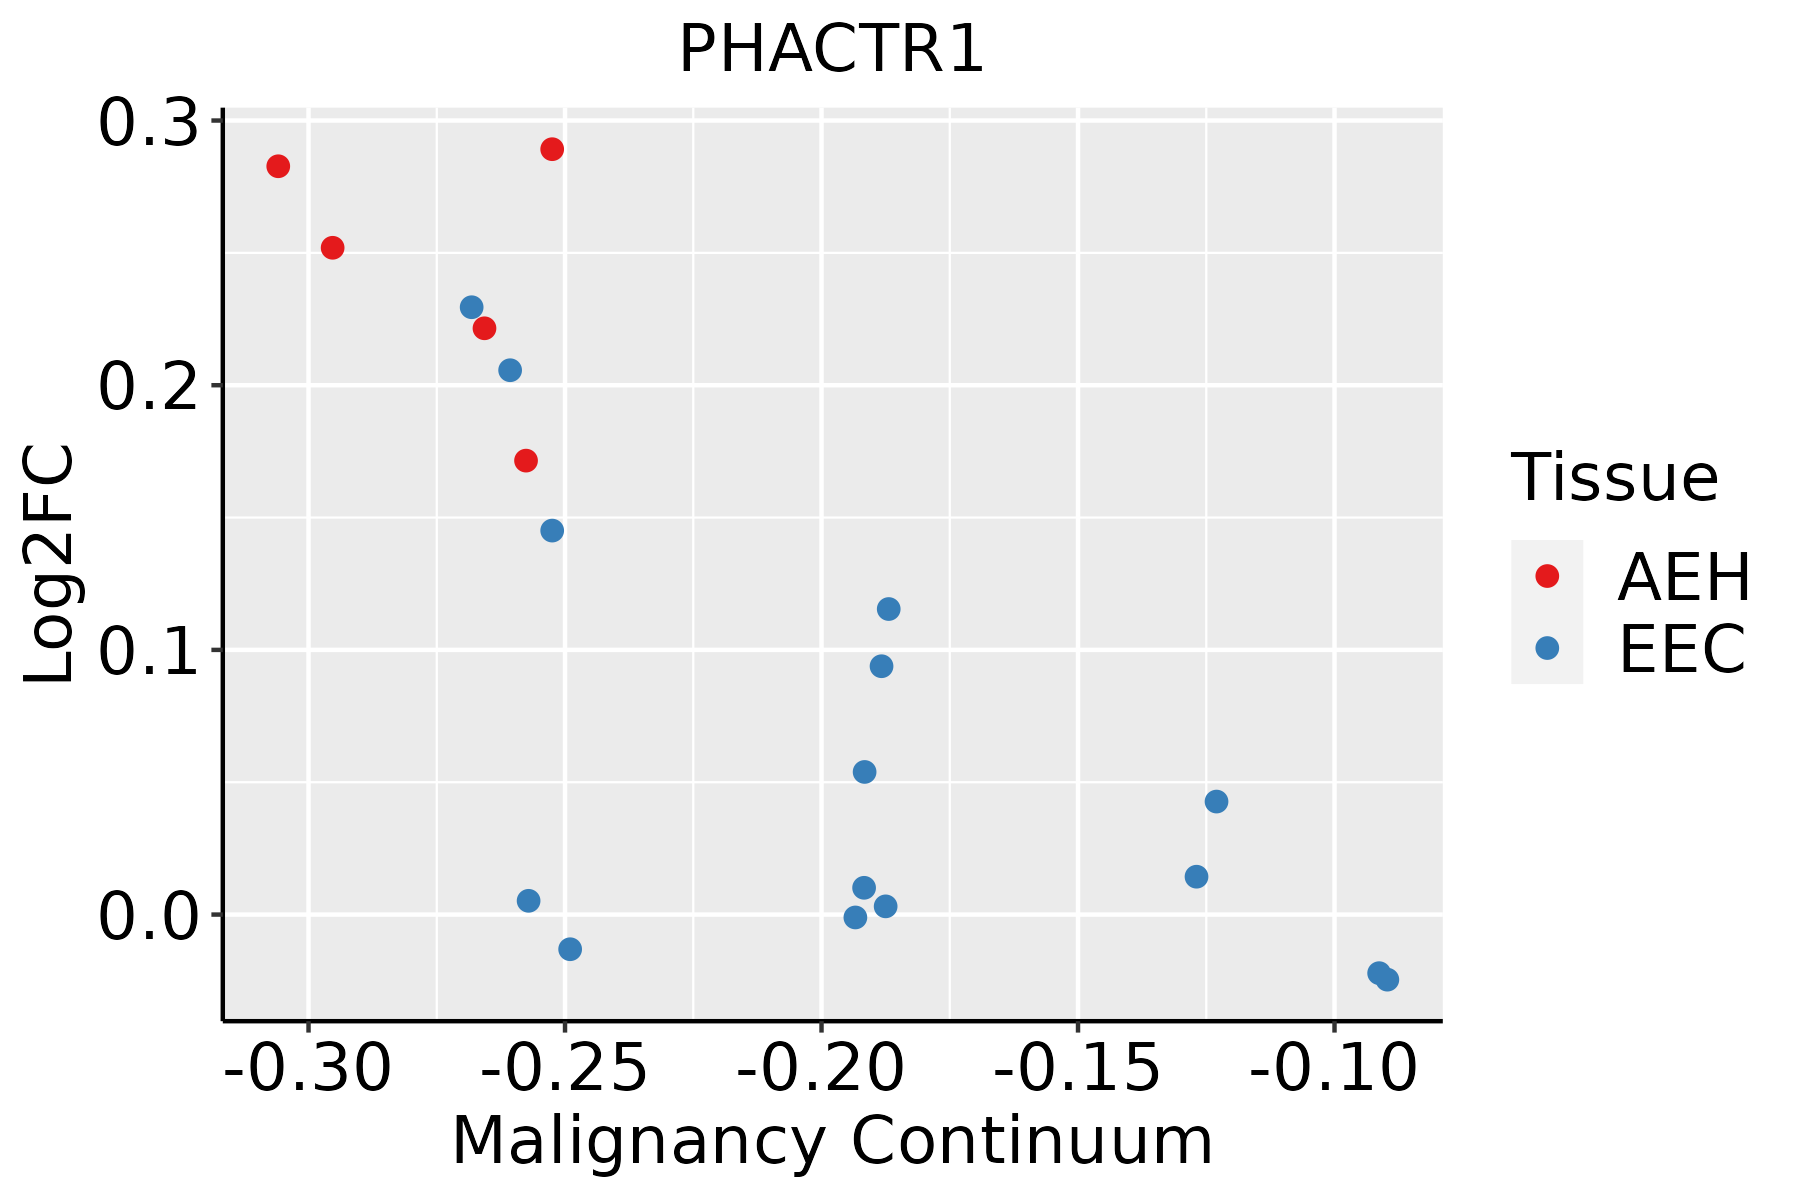 | AEH: Atypical endometrial hyperplasia |
| EEC: Endometrioid Cancer | ||
| Lung |  | AAH: Atypical adenomatous hyperplasia |
| AIS: Adenocarcinoma in situ | ||
| IAC: Invasive lung adenocarcinoma | ||
| MIA: Minimally invasive adenocarcinoma |
| ∗log2FC in expression of this searched gene in stem-like cells from each diseased tissue sample relative to stem-like cells in normal samples in each tissue plotted against the malignancy continuum. Samples are colored based on if they are from different disease stage. |
Top |
Malignant transformation related pathway analysis |
| Find out the enriched GO biological processes and KEGG pathways involved in transition from healthy to precancer to cancer |
| Tissue | Disease Stage | Enriched GO biological Processes |
| Colorectum | AD |  |
| Colorectum | SER |  |
| Colorectum | MSS |  |
| Colorectum | MSI-H |  |
| Colorectum | FAP |  |
| ∗Top 15 enriched GO BP terms are showed in the bar plot of each disease state in each tissue. Each row represents a significant GO biological process which is colored according to the -log10(p.adjust). |
| Page: 1 2 3 4 5 6 7 8 9 |
| GO ID | Tissue | Disease Stage | Description | Gene Ratio | Bg Ratio | pvalue | p.adjust | Count |
| GO:000701516 | Endometrium | AEH | actin filament organization | 98/2100 | 442/18723 | 1.99e-11 | 2.98e-09 | 98 |
| GO:00315329 | Endometrium | AEH | actin cytoskeleton reorganization | 32/2100 | 107/18723 | 1.24e-07 | 5.80e-06 | 32 |
| GO:003103210 | Endometrium | AEH | actomyosin structure organization | 46/2100 | 196/18723 | 8.00e-07 | 2.91e-05 | 46 |
| GO:005101716 | Endometrium | AEH | actin filament bundle assembly | 39/2100 | 157/18723 | 1.21e-06 | 3.91e-05 | 39 |
| GO:006157216 | Endometrium | AEH | actin filament bundle organization | 39/2100 | 161/18723 | 2.36e-06 | 6.86e-05 | 39 |
| GO:003003815 | Endometrium | AEH | contractile actin filament bundle assembly | 28/2100 | 106/18723 | 1.08e-05 | 2.45e-04 | 28 |
| GO:004314915 | Endometrium | AEH | stress fiber assembly | 28/2100 | 106/18723 | 1.08e-05 | 2.45e-04 | 28 |
| GO:00163588 | Endometrium | AEH | dendrite development | 46/2100 | 243/18723 | 2.56e-04 | 3.03e-03 | 46 |
| GO:00017642 | Endometrium | AEH | neuron migration | 31/2100 | 156/18723 | 1.08e-03 | 9.46e-03 | 31 |
| GO:000701517 | Endometrium | EEC | actin filament organization | 95/2168 | 442/18723 | 1.31e-09 | 1.09e-07 | 95 |
| GO:003153214 | Endometrium | EEC | actin cytoskeleton reorganization | 33/2168 | 107/18723 | 7.46e-08 | 3.89e-06 | 33 |
| GO:003103214 | Endometrium | EEC | actomyosin structure organization | 46/2168 | 196/18723 | 1.94e-06 | 5.80e-05 | 46 |
| GO:005101717 | Endometrium | EEC | actin filament bundle assembly | 37/2168 | 157/18723 | 1.71e-05 | 3.26e-04 | 37 |
| GO:006157217 | Endometrium | EEC | actin filament bundle organization | 37/2168 | 161/18723 | 3.09e-05 | 5.34e-04 | 37 |
| GO:003003816 | Endometrium | EEC | contractile actin filament bundle assembly | 27/2168 | 106/18723 | 5.47e-05 | 8.64e-04 | 27 |
| GO:004314916 | Endometrium | EEC | stress fiber assembly | 27/2168 | 106/18723 | 5.47e-05 | 8.64e-04 | 27 |
| GO:00017641 | Endometrium | EEC | neuron migration | 33/2168 | 156/18723 | 4.17e-04 | 4.38e-03 | 33 |
| GO:001635813 | Endometrium | EEC | dendrite development | 44/2168 | 243/18723 | 1.72e-03 | 1.34e-02 | 44 |
| GO:00219874 | Endometrium | EEC | cerebral cortex development | 23/2168 | 114/18723 | 5.41e-03 | 3.32e-02 | 23 |
| GO:00070158 | Lung | IAC | actin filament organization | 92/2061 | 442/18723 | 1.01e-09 | 1.93e-07 | 92 |
| Page: 1 2 3 |
| Pathway ID | Tissue | Disease Stage | Description | Gene Ratio | Bg Ratio | pvalue | p.adjust | qvalue | Count |
| Page: 1 |
Top |
Cell-cell communication analysis |
| Identification of potential cell-cell interactions between two cell types and their ligand-receptor pairs for different disease states |
| Ligand | Receptor | LRpair | Pathway | Tissue | Disease Stage |
| Page: 1 |
Top |
Single-cell gene regulatory network inference analysis |
| Find out the significant the regulons (TFs) and the target genes of each regulon across cell types for different disease states |
| TF | Cell Type | Tissue | Disease Stage | Target Gene | RSS | Regulon Activity |
| ∗The dot plots of a searched regulon are shown for all cell subpopulations in each disease state of each tissue based on the regulon specific score inferred using pySCENIC and by calculating the average expression. |
| Page: 1 |
Top |
Somatic mutation of malignant transformation related genes |
| Annotation of somatic variants for genes involved in malignant transformation |
| Hugo Symbol | Variant Class | Variant Classification | dbSNP RS | HGVSc | HGVSp | HGVSp Short | SWISSPROT | BIOTYPE | SIFT | PolyPhen | Tumor Sample Barcode | Tissue | Histology | Sex | Age | Stage | Therapy Types | Drugs | Outcome |
| PHACTR1 | SNV | Missense_Mutation | rs749322966 | c.323G>A | p.Arg108His | p.R108H | Q9C0D0 | protein_coding | deleterious(0) | probably_damaging(0.987) | TCGA-A8-A081-01 | Breast | breast invasive carcinoma | Female | >=65 | I/II | Unknown | Unknown | SD |
| PHACTR1 | SNV | Missense_Mutation | c.217N>A | p.Ala73Thr | p.A73T | Q9C0D0 | protein_coding | tolerated(1) | benign(0.013) | TCGA-AN-A041-01 | Breast | breast invasive carcinoma | Female | <65 | I/II | Unknown | Unknown | SD | |
| PHACTR1 | SNV | Missense_Mutation | rs867956571 | c.1736G>A | p.Arg579Gln | p.R579Q | Q9C0D0 | protein_coding | deleterious(0.01) | benign(0.294) | TCGA-AN-A046-01 | Breast | breast invasive carcinoma | Female | >=65 | I/II | Unknown | Unknown | SD |
| PHACTR1 | SNV | Missense_Mutation | novel | c.1736N>T | p.Arg579Leu | p.R579L | Q9C0D0 | protein_coding | deleterious(0) | benign(0.302) | TCGA-AN-A0G0-01 | Breast | breast invasive carcinoma | Female | <65 | I/II | Unknown | Unknown | SD |
| PHACTR1 | SNV | Missense_Mutation | novel | c.116C>T | p.Thr39Ile | p.T39I | Q9C0D0 | protein_coding | deleterious_low_confidence(0.01) | benign(0.118) | TCGA-BH-A0HB-01 | Breast | breast invasive carcinoma | Female | <65 | I/II | Chemotherapy | docetaxel | SD |
| PHACTR1 | SNV | Missense_Mutation | rs751014962 | c.1732N>T | p.His578Tyr | p.H578Y | Q9C0D0 | protein_coding | deleterious(0) | probably_damaging(0.946) | TCGA-C8-A26Y-01 | Breast | breast invasive carcinoma | Female | >=65 | I/II | Unknown | Unknown | SD |
| PHACTR1 | SNV | Missense_Mutation | c.1681N>G | p.Lys561Glu | p.K561E | Q9C0D0 | protein_coding | deleterious(0) | possibly_damaging(0.81) | TCGA-D8-A1J8-01 | Breast | breast invasive carcinoma | Female | >=65 | I/II | Hormone Therapy | nolvadex | SD | |
| PHACTR1 | SNV | Missense_Mutation | c.1531G>A | p.Glu511Lys | p.E511K | Q9C0D0 | protein_coding | deleterious(0.02) | probably_damaging(0.952) | TCGA-E2-A159-01 | Breast | breast invasive carcinoma | Female | <65 | I/II | Chemotherapy | cyclophosphamide | SD | |
| PHACTR1 | SNV | Missense_Mutation | novel | c.983N>T | p.Glu328Val | p.E328V | Q9C0D0 | protein_coding | deleterious(0) | probably_damaging(0.981) | TCGA-UU-A93S-01 | Breast | breast invasive carcinoma | Female | <65 | III/IV | Unknown | Unknown | PD |
| PHACTR1 | deletion | In_Frame_Del | c.1250_1252delNNN | p.Lys417_Val418delinsIle | p.K417_V418delinsI | Q9C0D0 | protein_coding | TCGA-A2-A0SV-01 | Breast | breast invasive carcinoma | Female | <65 | III/IV | Other, specify in notesBisphosphonate therapy | zometa | PD |
| Page: 1 2 3 4 5 6 7 8 |
Top |
Related drugs of malignant transformation related genes |
| Identification of chemicals and drugs interact with genes involved in malignant transfromation |
| (DGIdb 4.0) |
| Entrez ID | Symbol | Category | Interaction Types | Drug Claim Name | Drug Name | PMIDs |
| Page: 1 |

Copyright 2023-Present -The University of Texas Health Science Center at Houston |