
|
|||||
|
 | |
| |
| |
| |
| |
| |
|
Gene: PGS1 |
Gene summary for PGS1 |
| Gene information | Species | Human | Gene symbol | PGS1 | Gene ID | 9489 |
| Gene name | phosphatidylglycerophosphate synthase 1 | |
| Gene Alias | PGS1 | |
| Cytomap | 17q25.3 | |
| Gene Type | protein-coding | GO ID | GO:0006629 | UniProtAcc | A0A024R8V5 |
Top |
Malignant transformation analysis |
| Identification of the aberrant gene expression in precancerous and cancerous lesions by comparing the gene expression of stem-like cells in diseased tissues with normal stem cells |
| Entrez ID | Symbol | Replicates | Species | Organ | Tissue | Adj P-value | Log2FC | Malignancy |
| 9489 | PGS1 | LZE4T | Human | Esophagus | ESCC | 1.67e-08 | 1.58e-01 | 0.0811 |
| 9489 | PGS1 | LZE7T | Human | Esophagus | ESCC | 8.43e-05 | 3.45e-01 | 0.0667 |
| 9489 | PGS1 | LZE8T | Human | Esophagus | ESCC | 8.39e-03 | 4.34e-02 | 0.067 |
| 9489 | PGS1 | LZE22T | Human | Esophagus | ESCC | 5.68e-03 | 1.97e-01 | 0.068 |
| 9489 | PGS1 | LZE24T | Human | Esophagus | ESCC | 3.71e-12 | 3.43e-01 | 0.0596 |
| 9489 | PGS1 | LZE22D3 | Human | Esophagus | HGIN | 1.42e-03 | 3.86e-01 | 0.0653 |
| 9489 | PGS1 | LZE21T | Human | Esophagus | ESCC | 1.81e-02 | 2.45e-01 | 0.0655 |
| 9489 | PGS1 | P1T-E | Human | Esophagus | ESCC | 1.89e-08 | 2.94e-01 | 0.0875 |
| 9489 | PGS1 | P2T-E | Human | Esophagus | ESCC | 3.31e-16 | 2.69e-01 | 0.1177 |
| 9489 | PGS1 | P4T-E | Human | Esophagus | ESCC | 5.24e-09 | 1.68e-01 | 0.1323 |
| 9489 | PGS1 | P5T-E | Human | Esophagus | ESCC | 5.77e-10 | 4.92e-02 | 0.1327 |
| 9489 | PGS1 | P8T-E | Human | Esophagus | ESCC | 1.73e-19 | 3.18e-01 | 0.0889 |
| 9489 | PGS1 | P9T-E | Human | Esophagus | ESCC | 3.35e-08 | 1.73e-01 | 0.1131 |
| 9489 | PGS1 | P10T-E | Human | Esophagus | ESCC | 7.45e-17 | 2.71e-01 | 0.116 |
| 9489 | PGS1 | P11T-E | Human | Esophagus | ESCC | 2.40e-12 | 5.64e-01 | 0.1426 |
| 9489 | PGS1 | P12T-E | Human | Esophagus | ESCC | 5.49e-21 | 4.23e-01 | 0.1122 |
| 9489 | PGS1 | P15T-E | Human | Esophagus | ESCC | 3.08e-27 | 3.65e-01 | 0.1149 |
| 9489 | PGS1 | P16T-E | Human | Esophagus | ESCC | 4.79e-17 | 2.77e-01 | 0.1153 |
| 9489 | PGS1 | P17T-E | Human | Esophagus | ESCC | 1.39e-04 | 1.68e-01 | 0.1278 |
| 9489 | PGS1 | P19T-E | Human | Esophagus | ESCC | 1.94e-06 | 3.51e-01 | 0.1662 |
| Page: 1 2 3 4 |
| Tissue | Expression Dynamics | Abbreviation |
| Esophagus | 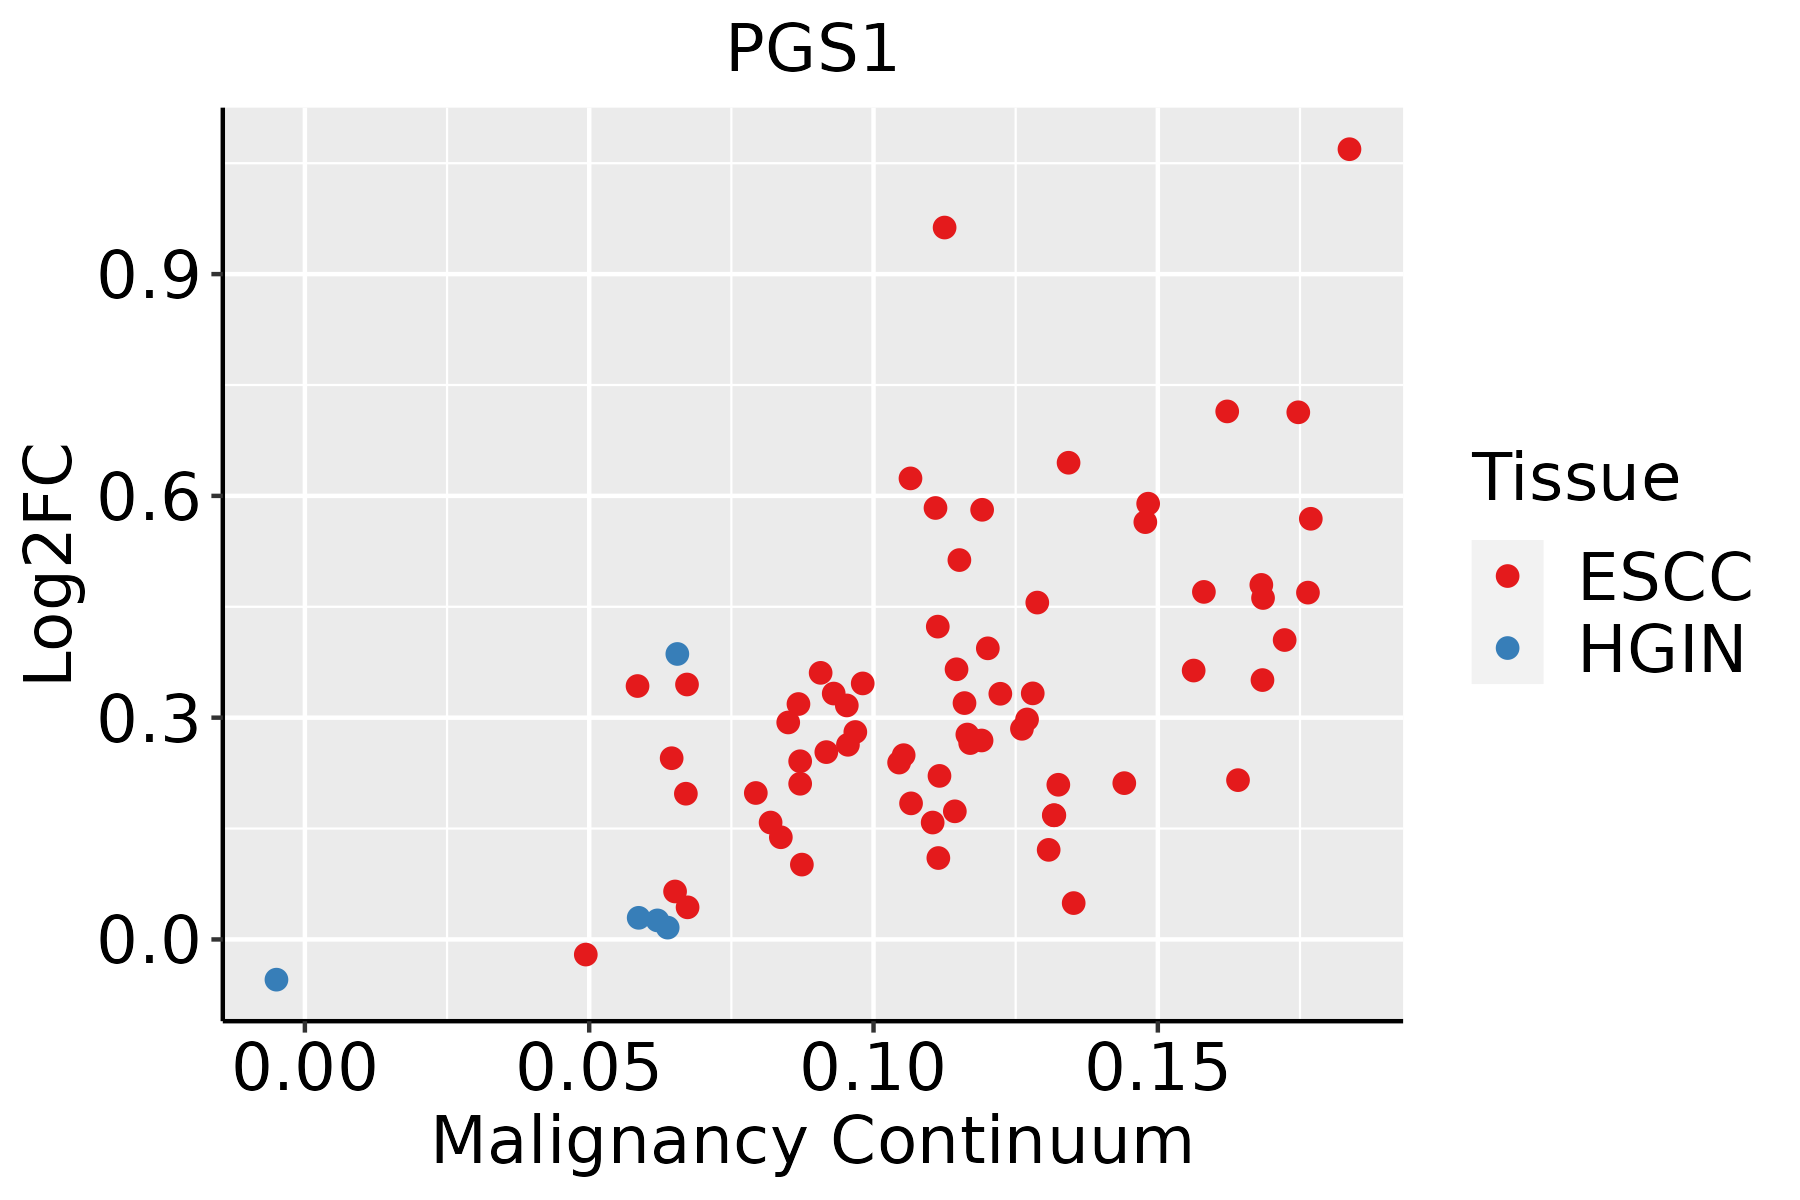 | ESCC: Esophageal squamous cell carcinoma |
| HGIN: High-grade intraepithelial neoplasias | ||
| LGIN: Low-grade intraepithelial neoplasias | ||
| Oral Cavity | 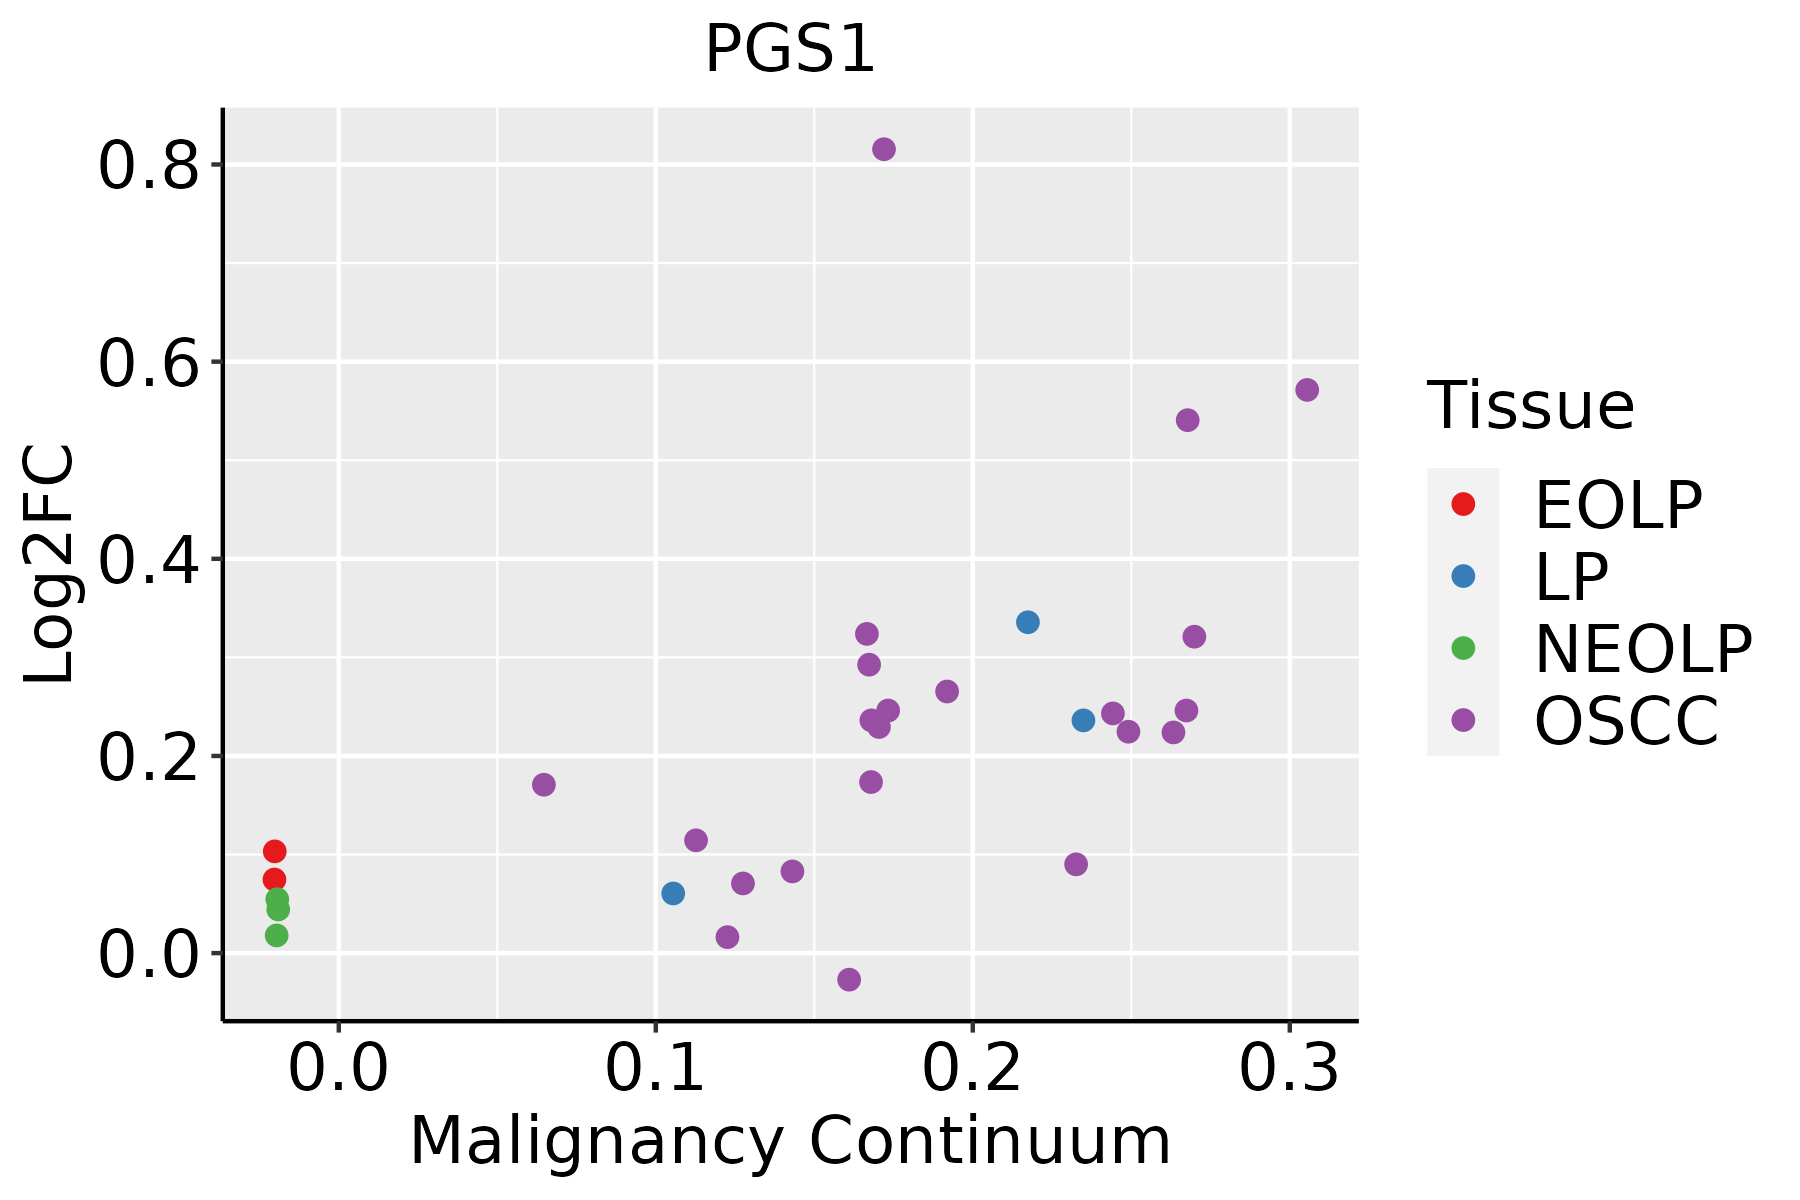 | EOLP: Erosive Oral lichen planus |
| LP: leukoplakia | ||
| NEOLP: Non-erosive oral lichen planus | ||
| OSCC: Oral squamous cell carcinoma |
| ∗log2FC in expression of this searched gene in stem-like cells from each diseased tissue sample relative to stem-like cells in normal samples in each tissue plotted against the malignancy continuum. Samples are colored based on if they are from different disease stage. |
Top |
Malignant transformation related pathway analysis |
| Find out the enriched GO biological processes and KEGG pathways involved in transition from healthy to precancer to cancer |
| Tissue | Disease Stage | Enriched GO biological Processes |
| Colorectum | AD |  |
| Colorectum | SER |  |
| Colorectum | MSS |  |
| Colorectum | MSI-H |  |
| Colorectum | FAP |  |
| ∗Top 15 enriched GO BP terms are showed in the bar plot of each disease state in each tissue. Each row represents a significant GO biological process which is colored according to the -log10(p.adjust). |
| Page: 1 2 3 4 5 6 7 8 9 |
| GO ID | Tissue | Disease Stage | Description | Gene Ratio | Bg Ratio | pvalue | p.adjust | Count |
| GO:005164810 | Esophagus | HGIN | vesicle localization | 37/2587 | 177/18723 | 6.03e-03 | 4.87e-02 | 37 |
| GO:00086544 | Esophagus | ESCC | phospholipid biosynthetic process | 162/8552 | 253/18723 | 2.59e-09 | 5.73e-08 | 162 |
| GO:005164815 | Esophagus | ESCC | vesicle localization | 119/8552 | 177/18723 | 5.16e-09 | 1.08e-07 | 119 |
| GO:00464744 | Esophagus | ESCC | glycerophospholipid biosynthetic process | 135/8552 | 211/18723 | 5.75e-08 | 1.02e-06 | 135 |
| GO:00450175 | Esophagus | ESCC | glycerolipid biosynthetic process | 154/8552 | 252/18723 | 5.20e-07 | 6.96e-06 | 154 |
| GO:00066446 | Esophagus | ESCC | phospholipid metabolic process | 218/8552 | 383/18723 | 5.37e-06 | 5.59e-05 | 218 |
| GO:00066505 | Esophagus | ESCC | glycerophospholipid metabolic process | 174/8552 | 306/18723 | 4.92e-05 | 3.85e-04 | 174 |
| GO:00464864 | Esophagus | ESCC | glycerolipid metabolic process | 211/8552 | 392/18723 | 6.51e-04 | 3.46e-03 | 211 |
| GO:005164811 | Liver | Cirrhotic | vesicle localization | 62/4634 | 177/18723 | 1.37e-03 | 9.18e-03 | 62 |
| GO:005164821 | Liver | HCC | vesicle localization | 107/7958 | 177/18723 | 1.05e-06 | 1.57e-05 | 107 |
| GO:00516489 | Oral cavity | OSCC | vesicle localization | 105/7305 | 177/18723 | 3.30e-08 | 6.30e-07 | 105 |
| GO:00086543 | Oral cavity | OSCC | phospholipid biosynthetic process | 130/7305 | 253/18723 | 3.96e-05 | 3.46e-04 | 130 |
| GO:00464743 | Oral cavity | OSCC | glycerophospholipid biosynthetic process | 102/7305 | 211/18723 | 3.50e-03 | 1.48e-02 | 102 |
| GO:00066445 | Oral cavity | OSCC | phospholipid metabolic process | 175/7305 | 383/18723 | 4.21e-03 | 1.71e-02 | 175 |
| GO:005164814 | Oral cavity | LP | vesicle localization | 66/4623 | 177/18723 | 1.25e-04 | 1.46e-03 | 66 |
| GO:005164816 | Skin | cSCC | vesicle localization | 73/4864 | 177/18723 | 6.36e-06 | 8.92e-05 | 73 |
| GO:005164817 | Thyroid | PTC | vesicle localization | 94/5968 | 177/18723 | 3.54e-09 | 9.45e-08 | 94 |
| GO:005164818 | Thyroid | ATC | vesicle localization | 91/6293 | 177/18723 | 7.21e-07 | 9.64e-06 | 91 |
| Page: 1 |
| Pathway ID | Tissue | Disease Stage | Description | Gene Ratio | Bg Ratio | pvalue | p.adjust | qvalue | Count |
| Page: 1 |
Top |
Cell-cell communication analysis |
| Identification of potential cell-cell interactions between two cell types and their ligand-receptor pairs for different disease states |
| Ligand | Receptor | LRpair | Pathway | Tissue | Disease Stage |
| Page: 1 |
Top |
Single-cell gene regulatory network inference analysis |
| Find out the significant the regulons (TFs) and the target genes of each regulon across cell types for different disease states |
| TF | Cell Type | Tissue | Disease Stage | Target Gene | RSS | Regulon Activity |
| ∗The dot plots of a searched regulon are shown for all cell subpopulations in each disease state of each tissue based on the regulon specific score inferred using pySCENIC and by calculating the average expression. |
| Page: 1 |
Top |
Somatic mutation of malignant transformation related genes |
| Annotation of somatic variants for genes involved in malignant transformation |
| Hugo Symbol | Variant Class | Variant Classification | dbSNP RS | HGVSc | HGVSp | HGVSp Short | SWISSPROT | BIOTYPE | SIFT | PolyPhen | Tumor Sample Barcode | Tissue | Histology | Sex | Age | Stage | Therapy Types | Drugs | Outcome |
| PGS1 | SNV | Missense_Mutation | novel | c.667N>T | p.Val223Leu | p.V223L | Q32NB8 | protein_coding | tolerated(0.34) | benign(0.27) | TCGA-AN-A0FN-01 | Breast | breast invasive carcinoma | Female | <65 | I/II | Unknown | Unknown | SD |
| PGS1 | SNV | Missense_Mutation | rs752824213 | c.295N>A | p.Val99Met | p.V99M | Q32NB8 | protein_coding | deleterious(0) | probably_damaging(0.946) | TCGA-BH-A0HF-01 | Breast | breast invasive carcinoma | Female | >=65 | I/II | Hormone Therapy | arimidex | SD |
| PGS1 | SNV | Missense_Mutation | novel | c.394C>G | p.Pro132Ala | p.P132A | Q32NB8 | protein_coding | tolerated(0.35) | benign(0.258) | TCGA-E2-A573-01 | Breast | breast invasive carcinoma | Female | <65 | I/II | Chemotherapy | taxotere | CR |
| PGS1 | SNV | Missense_Mutation | novel | c.595C>T | p.His199Tyr | p.H199Y | Q32NB8 | protein_coding | deleterious(0.02) | benign(0.284) | TCGA-GM-A2DH-01 | Breast | breast invasive carcinoma | Female | <65 | I/II | Chemotherapy | taxol | CR |
| PGS1 | SNV | Missense_Mutation | novel | c.700N>T | p.Gly234Cys | p.G234C | Q32NB8 | protein_coding | deleterious(0) | probably_damaging(0.991) | TCGA-OL-A5RY-01 | Breast | breast invasive carcinoma | Female | <65 | I/II | Unknown | Unknown | SD |
| PGS1 | insertion | Frame_Shift_Ins | novel | c.1615_1616insTCCAAAA | p.Arg539LeufsTer70 | p.R539Lfs*70 | Q32NB8 | protein_coding | TCGA-A2-A0CT-01 | Breast | breast invasive carcinoma | Female | >=65 | I/II | Chemotherapy | cytoxan | SD | ||
| PGS1 | insertion | In_Frame_Ins | novel | c.1616_1617insTGTTGGGATTATAGGCTTTAGCCACTGTGC | p.Arg539_Gln540insValGlyIleIleGlyPheSerHisCysAla | p.R539_Q540insVGIIGFSHCA | Q32NB8 | protein_coding | TCGA-A2-A0CT-01 | Breast | breast invasive carcinoma | Female | >=65 | I/II | Chemotherapy | cytoxan | SD | ||
| PGS1 | insertion | In_Frame_Ins | novel | c.1638_1639insTCTTTAGGAACACGGCTTCTT | p.Lys546_Met547insSerLeuGlyThrArgLeuLeu | p.K546_M547insSLGTRLL | Q32NB8 | protein_coding | TCGA-A8-A08H-01 | Breast | breast invasive carcinoma | Female | >=65 | I/II | Unknown | Unknown | SD | ||
| PGS1 | deletion | Frame_Shift_Del | novel | c.1551+1delG | Q32NB8 | protein_coding | TCGA-EW-A2FV-01 | Breast | breast invasive carcinoma | Female | <65 | III/IV | Chemotherapy | docetaxel | SD | ||||
| PGS1 | insertion | Frame_Shift_Ins | novel | c.1378_1379insT | p.Arg460MetfsTer29 | p.R460Mfs*29 | Q32NB8 | protein_coding | TCGA-2W-A8YY-01 | Cervix | cervical & endocervical cancer | Female | <65 | I/II | Chemotherapy | cisplatin | CR |
| Page: 1 2 3 4 5 6 7 |
Top |
Related drugs of malignant transformation related genes |
| Identification of chemicals and drugs interact with genes involved in malignant transfromation |
| (DGIdb 4.0) |
| Entrez ID | Symbol | Category | Interaction Types | Drug Claim Name | Drug Name | PMIDs |
| Page: 1 |

Copyright 2023-Present -The University of Texas Health Science Center at Houston |