
|
|||||
|
 | |
| |
| |
| |
| |
| |
|
Gene: PGRMC2 |
Gene summary for PGRMC2 |
| Gene information | Species | Human | Gene symbol | PGRMC2 | Gene ID | 10424 |
| Gene name | progesterone receptor membrane component 2 | |
| Gene Alias | DG6 | |
| Cytomap | 4q28.2 | |
| Gene Type | protein-coding | GO ID | GO:0000041 | UniProtAcc | O15173 |
Top |
Malignant transformation analysis |
| Identification of the aberrant gene expression in precancerous and cancerous lesions by comparing the gene expression of stem-like cells in diseased tissues with normal stem cells |
| Entrez ID | Symbol | Replicates | Species | Organ | Tissue | Adj P-value | Log2FC | Malignancy |
| 10424 | PGRMC2 | HTA11_1938_2000001011 | Human | Colorectum | AD | 4.72e-05 | 4.13e-01 | -0.0811 |
| 10424 | PGRMC2 | HTA11_78_2000001011 | Human | Colorectum | AD | 8.52e-05 | 3.23e-01 | -0.1088 |
| 10424 | PGRMC2 | HTA11_347_2000001011 | Human | Colorectum | AD | 1.03e-19 | 5.73e-01 | -0.1954 |
| 10424 | PGRMC2 | HTA11_1391_2000001011 | Human | Colorectum | AD | 3.79e-06 | 3.76e-01 | -0.059 |
| 10424 | PGRMC2 | A015-C-203 | Human | Colorectum | FAP | 2.86e-05 | -1.63e-01 | -0.1294 |
| 10424 | PGRMC2 | A001-C-108 | Human | Colorectum | FAP | 1.06e-03 | -1.76e-01 | -0.0272 |
| 10424 | PGRMC2 | A015-C-106 | Human | Colorectum | FAP | 4.51e-04 | -1.44e-01 | -0.0511 |
| 10424 | PGRMC2 | A015-C-104 | Human | Colorectum | FAP | 1.60e-04 | -1.11e-01 | -0.1899 |
| 10424 | PGRMC2 | A002-C-016 | Human | Colorectum | FAP | 1.23e-05 | -1.39e-01 | 0.0521 |
| 10424 | PGRMC2 | A002-C-116 | Human | Colorectum | FAP | 4.00e-05 | -1.42e-01 | -0.0452 |
| 10424 | PGRMC2 | LZE2T | Human | Esophagus | ESCC | 1.28e-05 | 4.49e-01 | 0.082 |
| 10424 | PGRMC2 | LZE4T | Human | Esophagus | ESCC | 6.81e-05 | 9.14e-03 | 0.0811 |
| 10424 | PGRMC2 | LZE8T | Human | Esophagus | ESCC | 1.27e-02 | -9.38e-02 | 0.067 |
| 10424 | PGRMC2 | LZE20T | Human | Esophagus | ESCC | 1.50e-02 | 2.61e-02 | 0.0662 |
| 10424 | PGRMC2 | LZE24T | Human | Esophagus | ESCC | 5.44e-09 | 2.91e-02 | 0.0596 |
| 10424 | PGRMC2 | P2T-E | Human | Esophagus | ESCC | 7.34e-22 | 4.01e-01 | 0.1177 |
| 10424 | PGRMC2 | P4T-E | Human | Esophagus | ESCC | 5.15e-17 | 4.88e-01 | 0.1323 |
| 10424 | PGRMC2 | P5T-E | Human | Esophagus | ESCC | 2.83e-16 | 2.27e-01 | 0.1327 |
| 10424 | PGRMC2 | P8T-E | Human | Esophagus | ESCC | 2.08e-13 | 3.54e-03 | 0.0889 |
| 10424 | PGRMC2 | P9T-E | Human | Esophagus | ESCC | 1.83e-09 | 1.41e-01 | 0.1131 |
| Page: 1 2 3 4 5 6 |
| Tissue | Expression Dynamics | Abbreviation |
| Colorectum (GSE201348) |  | FAP: Familial adenomatous polyposis |
| CRC: Colorectal cancer | ||
| Colorectum (HTA11) |  | AD: Adenomas |
| SER: Sessile serrated lesions | ||
| MSI-H: Microsatellite-high colorectal cancer | ||
| MSS: Microsatellite stable colorectal cancer | ||
| Esophagus | 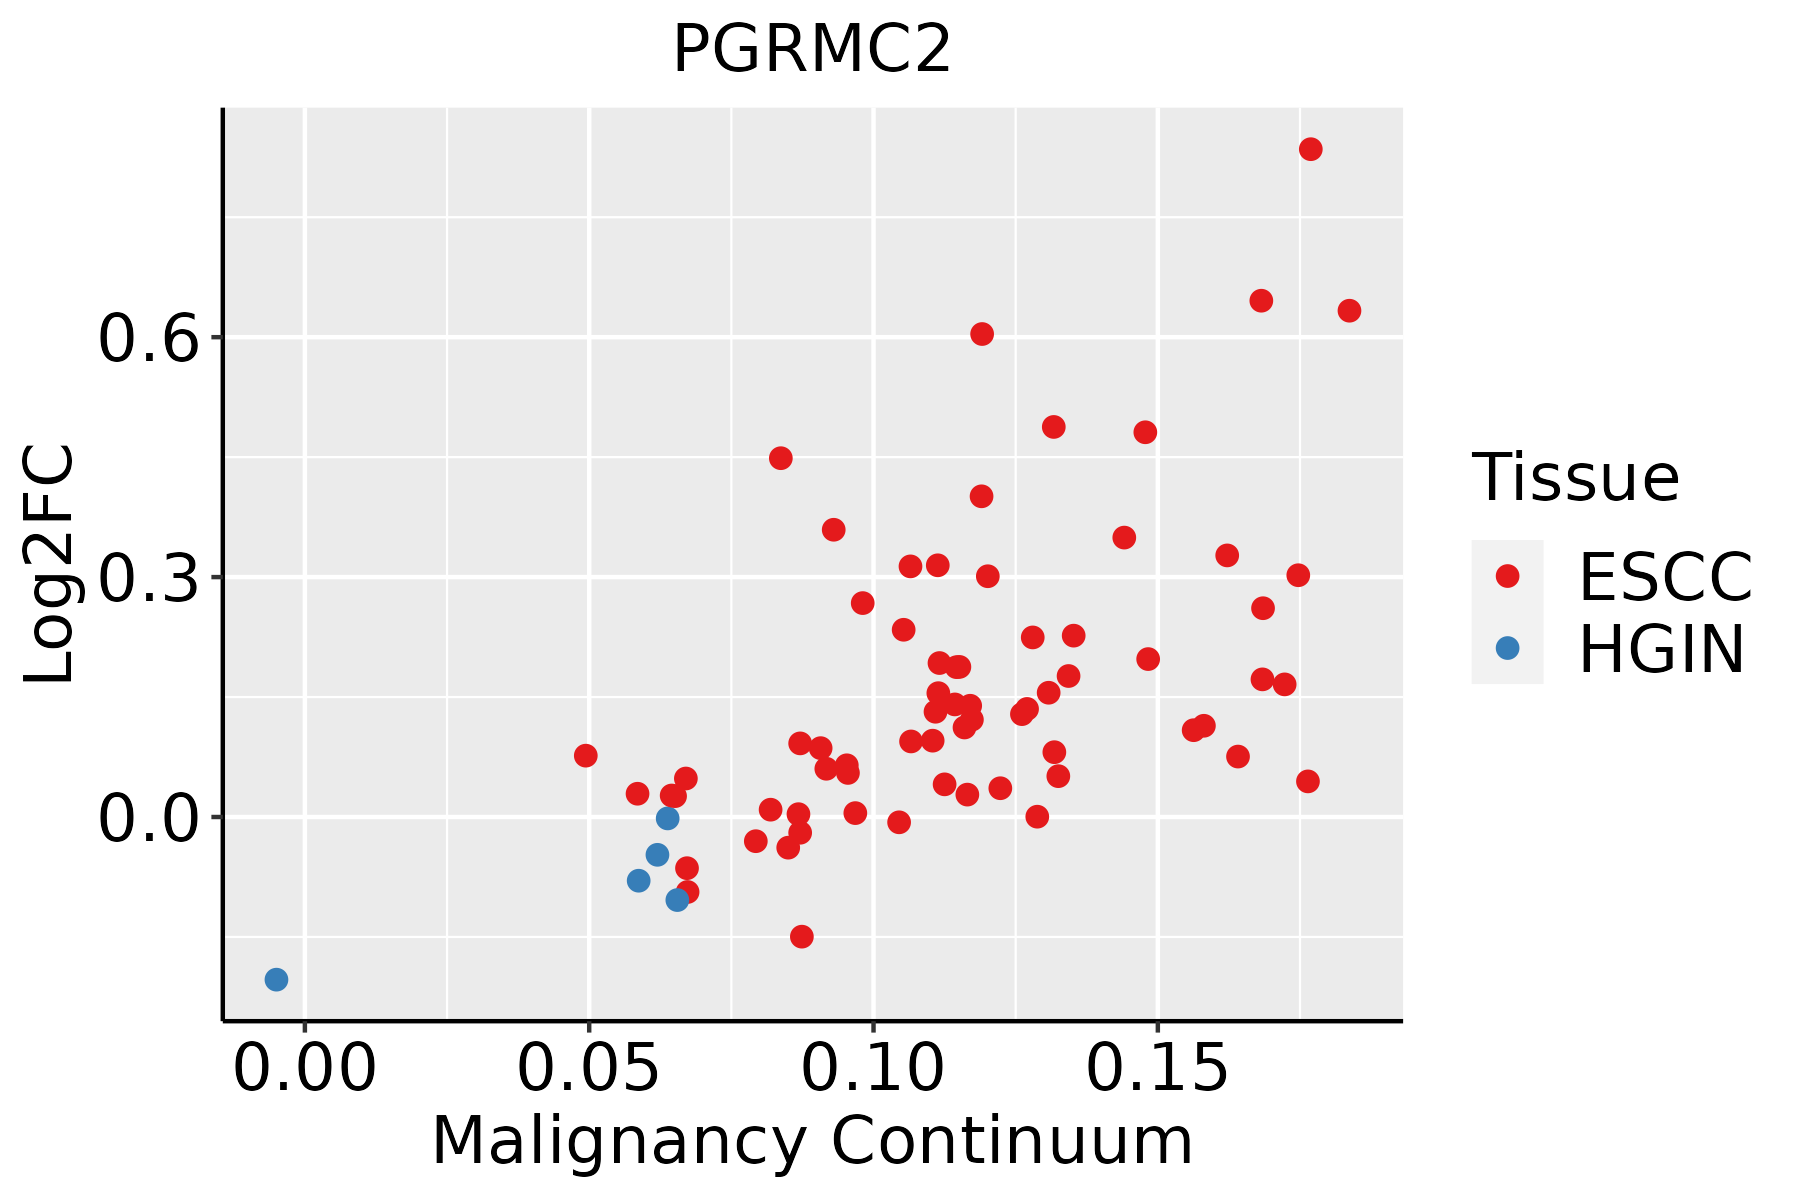 | ESCC: Esophageal squamous cell carcinoma |
| HGIN: High-grade intraepithelial neoplasias | ||
| LGIN: Low-grade intraepithelial neoplasias | ||
| Liver | 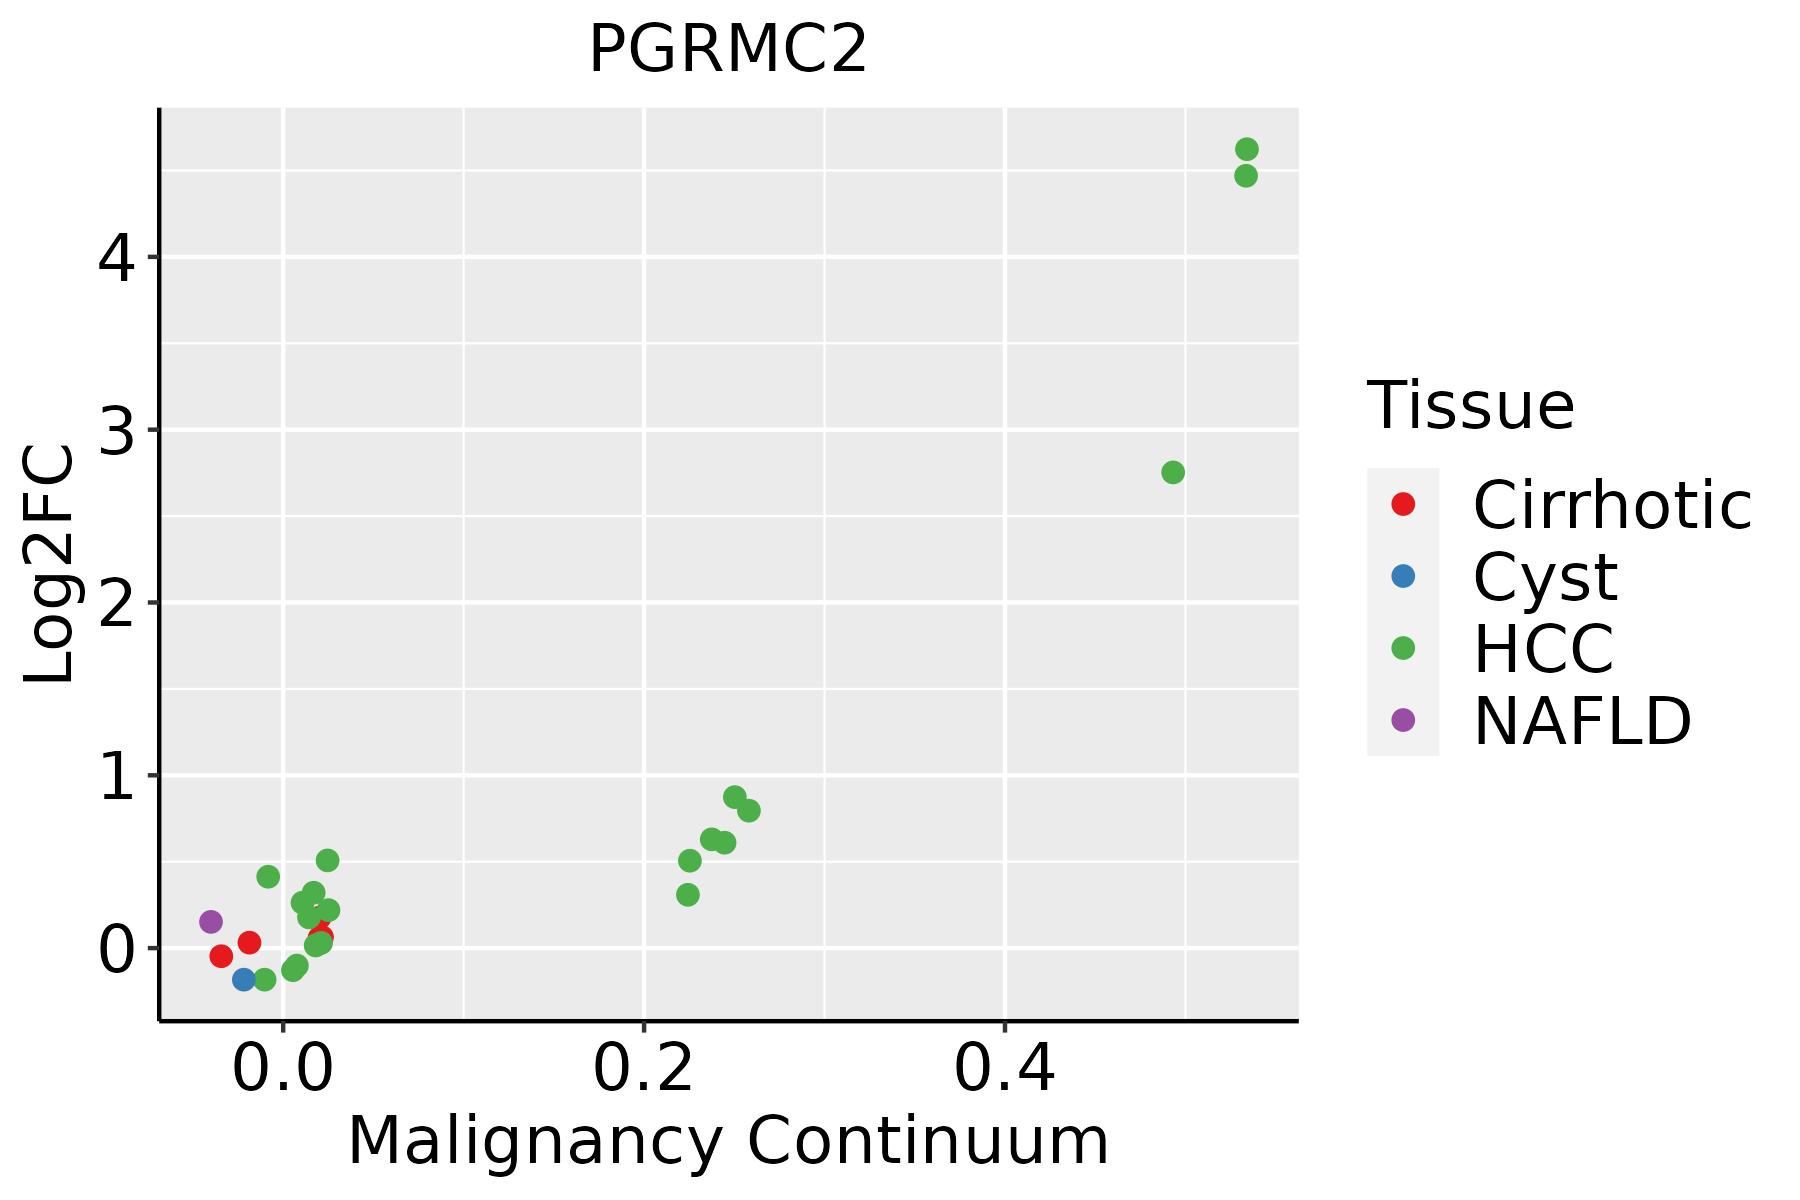 | HCC: Hepatocellular carcinoma |
| NAFLD: Non-alcoholic fatty liver disease | ||
| Oral Cavity | 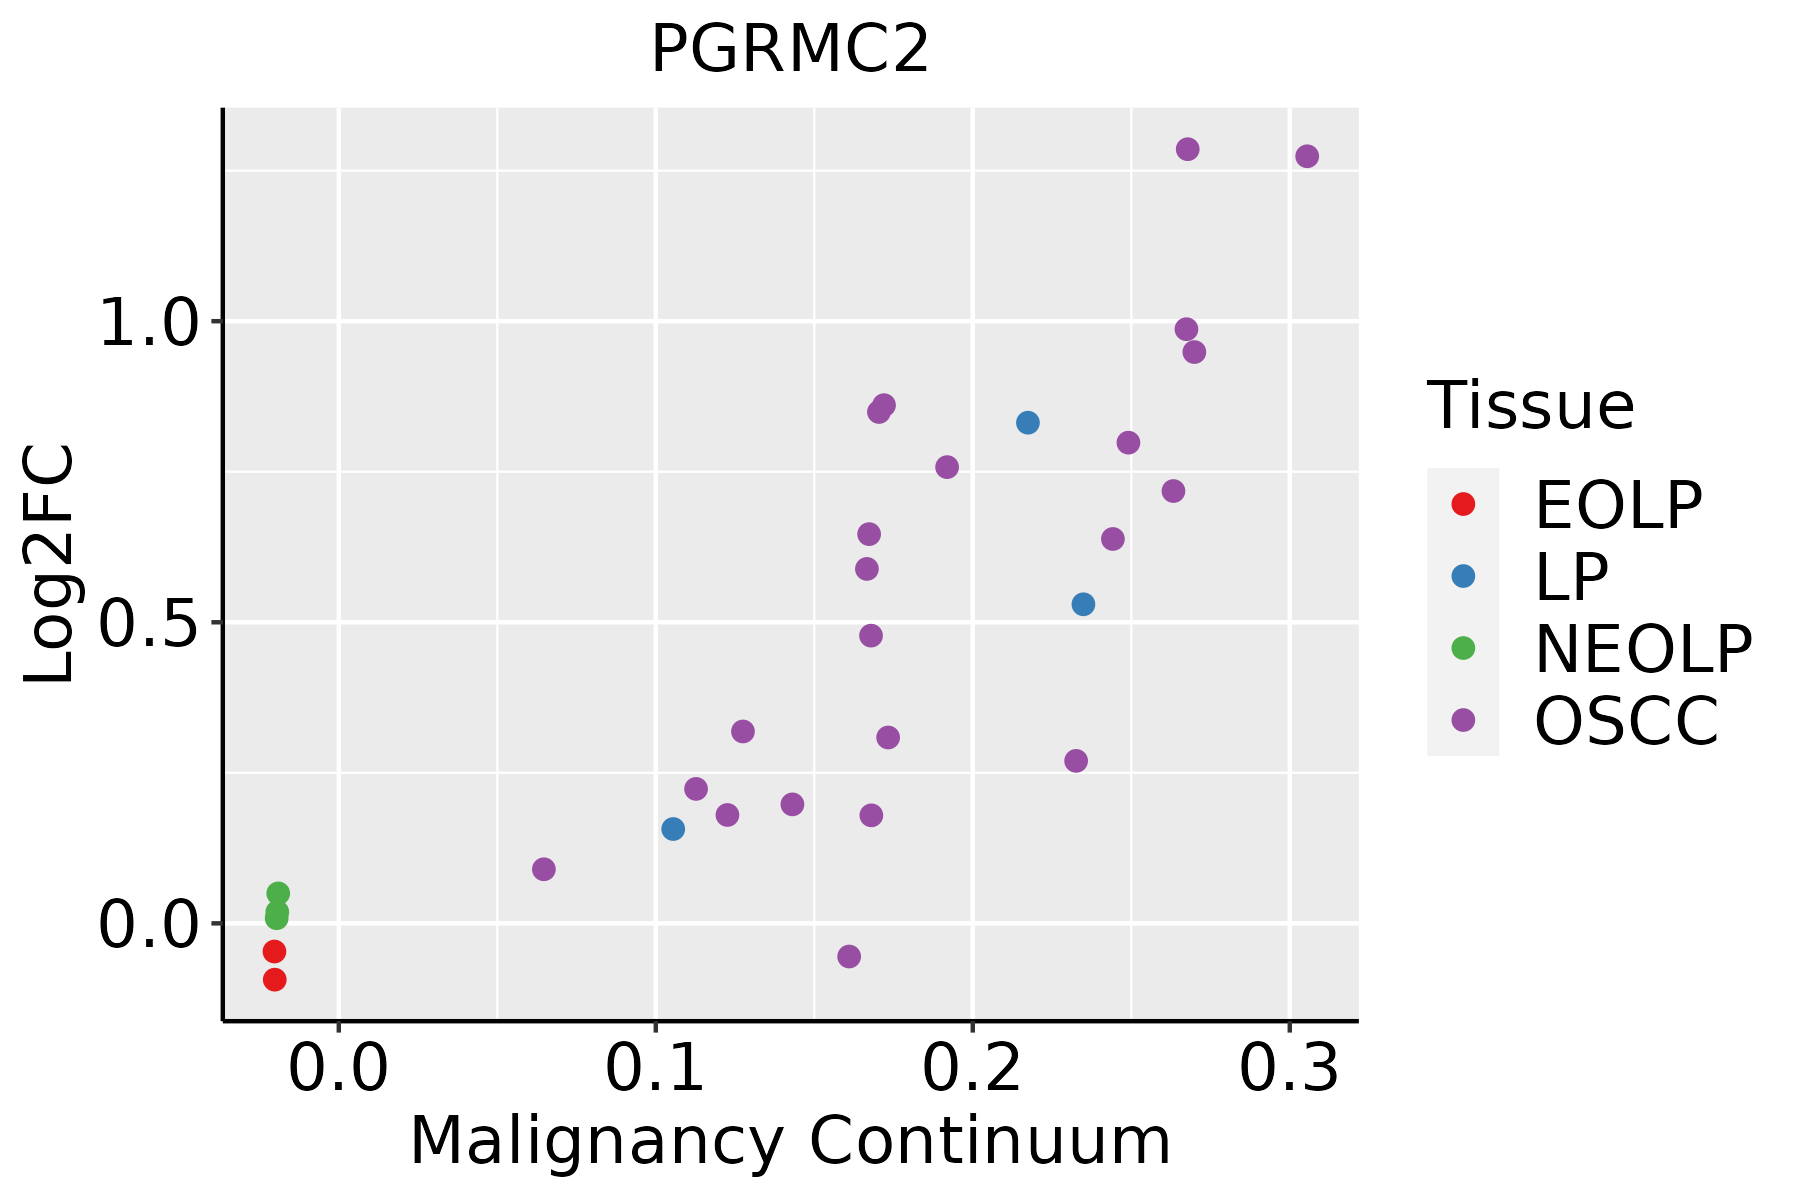 | EOLP: Erosive Oral lichen planus |
| LP: leukoplakia | ||
| NEOLP: Non-erosive oral lichen planus | ||
| OSCC: Oral squamous cell carcinoma | ||
| Skin |  | AK: Actinic keratosis |
| cSCC: Cutaneous squamous cell carcinoma | ||
| SCCIS:squamous cell carcinoma in situ | ||
| Thyroid |  | ATC: Anaplastic thyroid cancer |
| HT: Hashimoto's thyroiditis | ||
| PTC: Papillary thyroid cancer |
| ∗log2FC in expression of this searched gene in stem-like cells from each diseased tissue sample relative to stem-like cells in normal samples in each tissue plotted against the malignancy continuum. Samples are colored based on if they are from different disease stage. |
Top |
Malignant transformation related pathway analysis |
| Find out the enriched GO biological processes and KEGG pathways involved in transition from healthy to precancer to cancer |
| Tissue | Disease Stage | Enriched GO biological Processes |
| Colorectum | AD |  |
| Colorectum | SER |  |
| Colorectum | MSS |  |
| Colorectum | MSI-H |  |
| Colorectum | FAP |  |
| ∗Top 15 enriched GO BP terms are showed in the bar plot of each disease state in each tissue. Each row represents a significant GO biological process which is colored according to the -log10(p.adjust). |
| Page: 1 2 3 4 5 6 7 8 9 |
| GO ID | Tissue | Disease Stage | Description | Gene Ratio | Bg Ratio | pvalue | p.adjust | Count |
| GO:0071383 | Colorectum | AD | cellular response to steroid hormone stimulus | 73/3918 | 204/18723 | 6.31e-07 | 2.24e-05 | 73 |
| GO:0043401 | Colorectum | AD | steroid hormone mediated signaling pathway | 51/3918 | 136/18723 | 6.52e-06 | 1.63e-04 | 51 |
| GO:0048545 | Colorectum | AD | response to steroid hormone | 104/3918 | 339/18723 | 1.33e-05 | 2.90e-04 | 104 |
| GO:0009755 | Colorectum | AD | hormone-mediated signaling pathway | 64/3918 | 190/18723 | 2.78e-05 | 5.24e-04 | 64 |
| GO:00713833 | Colorectum | FAP | cellular response to steroid hormone stimulus | 59/2622 | 204/18723 | 2.12e-08 | 2.06e-06 | 59 |
| GO:00485454 | Colorectum | FAP | response to steroid hormone | 81/2622 | 339/18723 | 6.22e-07 | 3.08e-05 | 81 |
| GO:00434014 | Colorectum | FAP | steroid hormone mediated signaling pathway | 41/2622 | 136/18723 | 8.82e-07 | 4.03e-05 | 41 |
| GO:00097554 | Colorectum | FAP | hormone-mediated signaling pathway | 51/2622 | 190/18723 | 2.23e-06 | 8.87e-05 | 51 |
| GO:0048545111 | Esophagus | ESCC | response to steroid hormone | 204/8552 | 339/18723 | 4.47e-08 | 8.11e-07 | 204 |
| GO:0071383110 | Esophagus | ESCC | cellular response to steroid hormone stimulus | 127/8552 | 204/18723 | 1.26e-06 | 1.55e-05 | 127 |
| GO:004340119 | Esophagus | ESCC | steroid hormone mediated signaling pathway | 87/8552 | 136/18723 | 1.25e-05 | 1.15e-04 | 87 |
| GO:000975516 | Esophagus | ESCC | hormone-mediated signaling pathway | 106/8552 | 190/18723 | 3.13e-03 | 1.30e-02 | 106 |
| GO:004854512 | Liver | Cirrhotic | response to steroid hormone | 146/4634 | 339/18723 | 7.87e-14 | 6.76e-12 | 146 |
| GO:007138312 | Liver | Cirrhotic | cellular response to steroid hormone stimulus | 90/4634 | 204/18723 | 1.04e-09 | 4.70e-08 | 90 |
| GO:004340111 | Liver | Cirrhotic | steroid hormone mediated signaling pathway | 58/4634 | 136/18723 | 3.44e-06 | 5.95e-05 | 58 |
| GO:000975511 | Liver | Cirrhotic | hormone-mediated signaling pathway | 71/4634 | 190/18723 | 7.09e-05 | 7.98e-04 | 71 |
| GO:004854522 | Liver | HCC | response to steroid hormone | 206/7958 | 339/18723 | 6.81e-12 | 2.92e-10 | 206 |
| GO:007138322 | Liver | HCC | cellular response to steroid hormone stimulus | 128/7958 | 204/18723 | 3.92e-09 | 1.04e-07 | 128 |
| GO:004340121 | Liver | HCC | steroid hormone mediated signaling pathway | 84/7958 | 136/18723 | 4.42e-06 | 5.62e-05 | 84 |
| GO:000975521 | Liver | HCC | hormone-mediated signaling pathway | 106/7958 | 190/18723 | 1.45e-04 | 1.17e-03 | 106 |
| Page: 1 2 3 |
| Pathway ID | Tissue | Disease Stage | Description | Gene Ratio | Bg Ratio | pvalue | p.adjust | qvalue | Count |
| Page: 1 |
Top |
Cell-cell communication analysis |
| Identification of potential cell-cell interactions between two cell types and their ligand-receptor pairs for different disease states |
| Ligand | Receptor | LRpair | Pathway | Tissue | Disease Stage |
| Page: 1 |
Top |
Single-cell gene regulatory network inference analysis |
| Find out the significant the regulons (TFs) and the target genes of each regulon across cell types for different disease states |
| TF | Cell Type | Tissue | Disease Stage | Target Gene | RSS | Regulon Activity |
| ∗The dot plots of a searched regulon are shown for all cell subpopulations in each disease state of each tissue based on the regulon specific score inferred using pySCENIC and by calculating the average expression. |
| Page: 1 |
Top |
Somatic mutation of malignant transformation related genes |
| Annotation of somatic variants for genes involved in malignant transformation |
| Hugo Symbol | Variant Class | Variant Classification | dbSNP RS | HGVSc | HGVSp | HGVSp Short | SWISSPROT | BIOTYPE | SIFT | PolyPhen | Tumor Sample Barcode | Tissue | Histology | Sex | Age | Stage | Therapy Types | Drugs | Outcome |
| PGRMC2 | SNV | Missense_Mutation | rs759473544 | c.410G>A | p.Gly137Asp | p.G137D | O15173 | protein_coding | deleterious(0) | probably_damaging(0.998) | TCGA-F4-6856-01 | Colorectum | colon adenocarcinoma | Male | <65 | I/II | Ancillary | leucovorin | CR |
| PGRMC2 | SNV | Missense_Mutation | novel | c.592N>A | p.Asp198Asn | p.D198N | O15173 | protein_coding | deleterious(0.01) | probably_damaging(0.994) | TCGA-AX-A2HC-01 | Endometrium | uterine corpus endometrioid carcinoma | Female | <65 | III/IV | Chemotherapy | paclitaxel | PD |
| PGRMC2 | SNV | Missense_Mutation | c.623N>A | p.Arg208Gln | p.R208Q | O15173 | protein_coding | tolerated(0.16) | probably_damaging(0.98) | TCGA-B5-A0JY-01 | Endometrium | uterine corpus endometrioid carcinoma | Female | <65 | III/IV | Chemotherapy | doxorubicin | SD | |
| PGRMC2 | SNV | Missense_Mutation | c.491N>T | p.Ala164Val | p.A164V | O15173 | protein_coding | deleterious(0.01) | benign(0.108) | TCGA-D1-A103-01 | Endometrium | uterine corpus endometrioid carcinoma | Female | >=65 | I/II | Unknown | Unknown | SD | |
| PGRMC2 | SNV | Missense_Mutation | rs751047875 | c.473N>T | p.Ser158Ile | p.S158I | O15173 | protein_coding | tolerated(0.08) | possibly_damaging(0.749) | TCGA-NJ-A4YI-01 | Lung | lung adenocarcinoma | Female | >=65 | III/IV | Unknown | Unknown | SD |
| PGRMC2 | SNV | Missense_Mutation | rs768420882 | c.470N>A | p.Gly157Asp | p.G157D | O15173 | protein_coding | deleterious(0) | probably_damaging(0.972) | TCGA-CV-7568-01 | Oral cavity | head & neck squamous cell carcinoma | Female | <65 | I/II | Unknown | Unknown | SD |
| PGRMC2 | deletion | In_Frame_Del | novel | c.364_399delNNNNNNNNNNNNNNNNNNNNNNNNNNNNNNNNNNNN | p.Met122_Arg133del | p.M122_R133del | O15173 | protein_coding | TCGA-CV-6937-01 | Oral cavity | head & neck squamous cell carcinoma | Male | >=65 | I/II | Unknown | Unknown | SD | ||
| PGRMC2 | SNV | Missense_Mutation | rs200116082 | c.572N>G | p.Asp191Gly | p.D191G | O15173 | protein_coding | deleterious(0.02) | probably_damaging(0.991) | TCGA-BR-4361-01 | Stomach | stomach adenocarcinoma | Female | >=65 | III/IV | Unknown | Unknown | SD |
| Page: 1 |
Top |
Related drugs of malignant transformation related genes |
| Identification of chemicals and drugs interact with genes involved in malignant transfromation |
| (DGIdb 4.0) |
| Entrez ID | Symbol | Category | Interaction Types | Drug Claim Name | Drug Name | PMIDs |
| Page: 1 |

Copyright 2023-Present -The University of Texas Health Science Center at Houston |