| Tissue | Expression Dynamics | Abbreviation |
| Cervix | 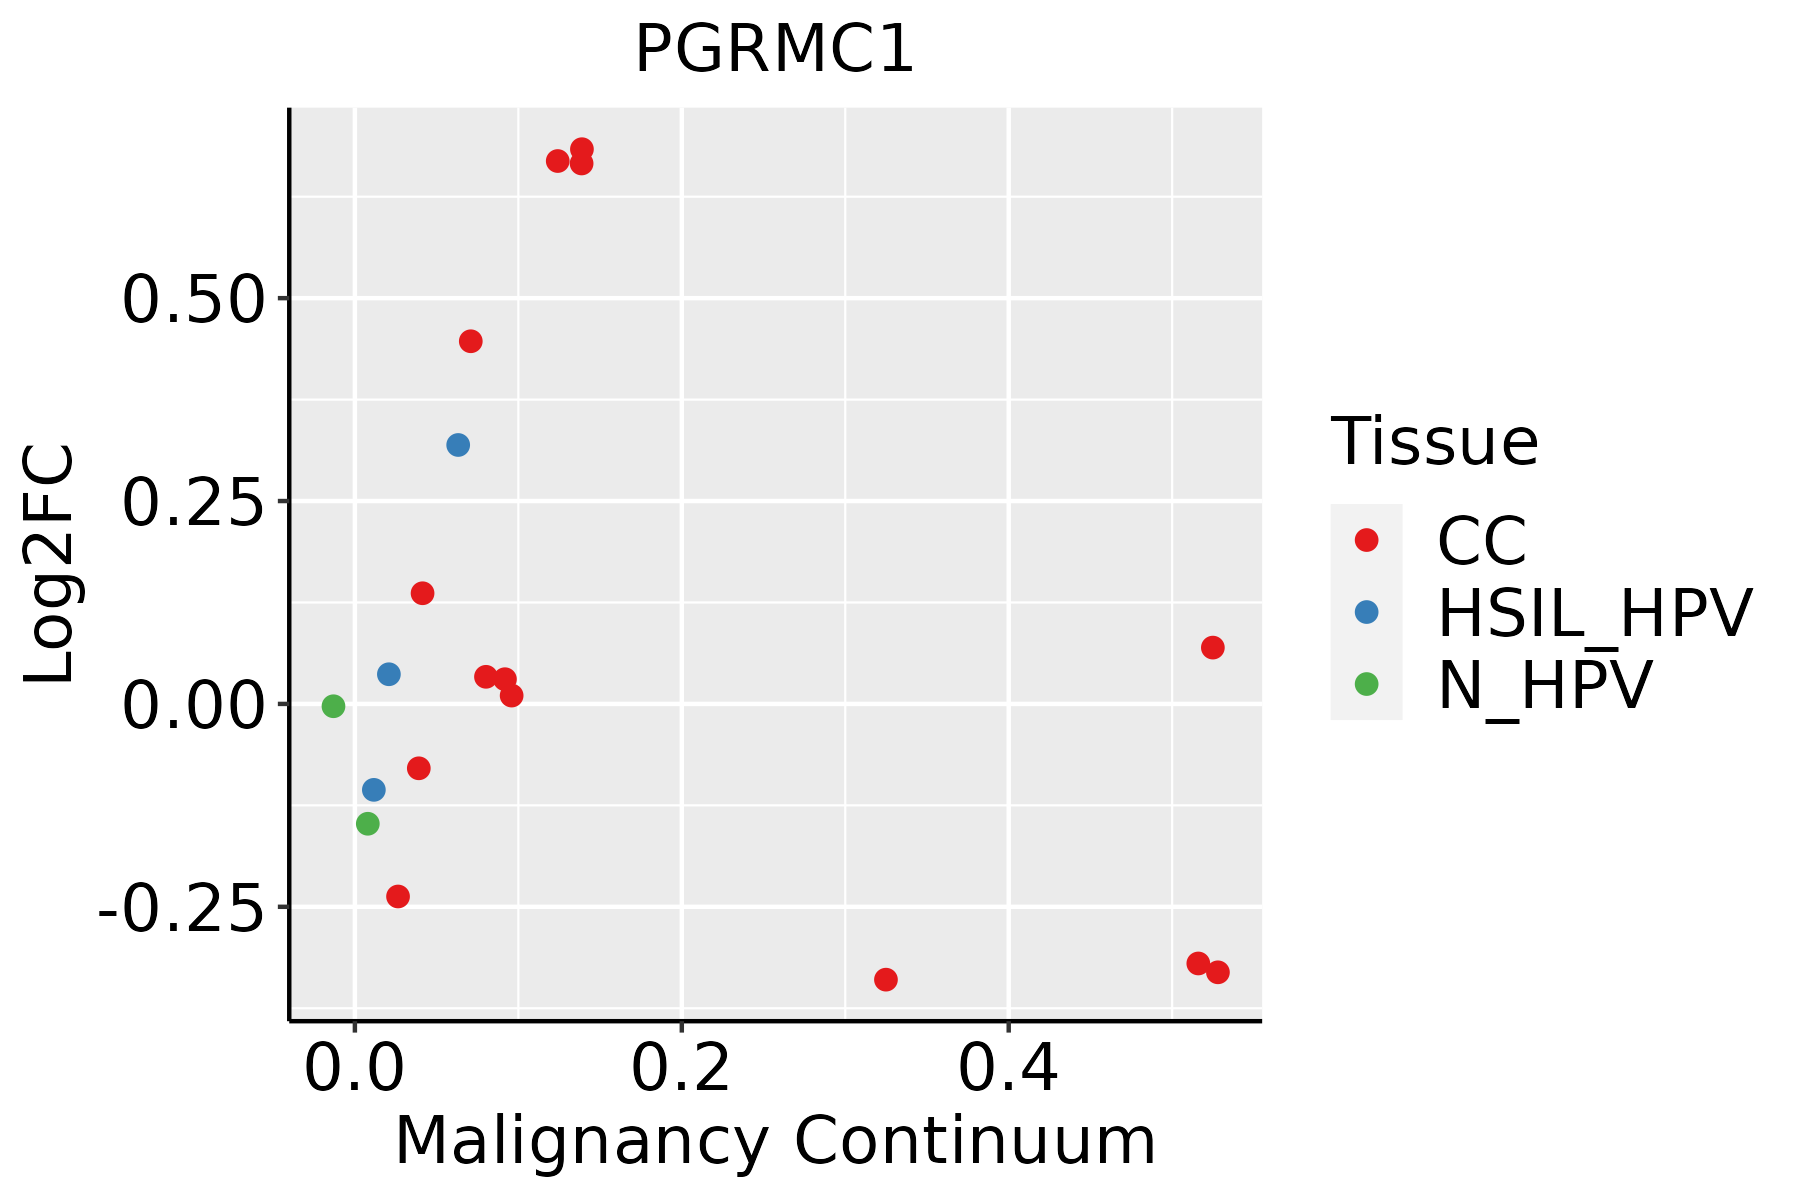 | CC: Cervix cancer |
| HSIL_HPV: HPV-infected high-grade squamous intraepithelial lesions |
| N_HPV: HPV-infected normal cervix |
| Colorectum (GSE201348) |  | FAP: Familial adenomatous polyposis |
| CRC: Colorectal cancer |
| Colorectum (HTA11) |  | AD: Adenomas |
| SER: Sessile serrated lesions |
| MSI-H: Microsatellite-high colorectal cancer |
| MSS: Microsatellite stable colorectal cancer |
| Endometrium |  | AEH: Atypical endometrial hyperplasia |
| EEC: Endometrioid Cancer |
| Esophagus | 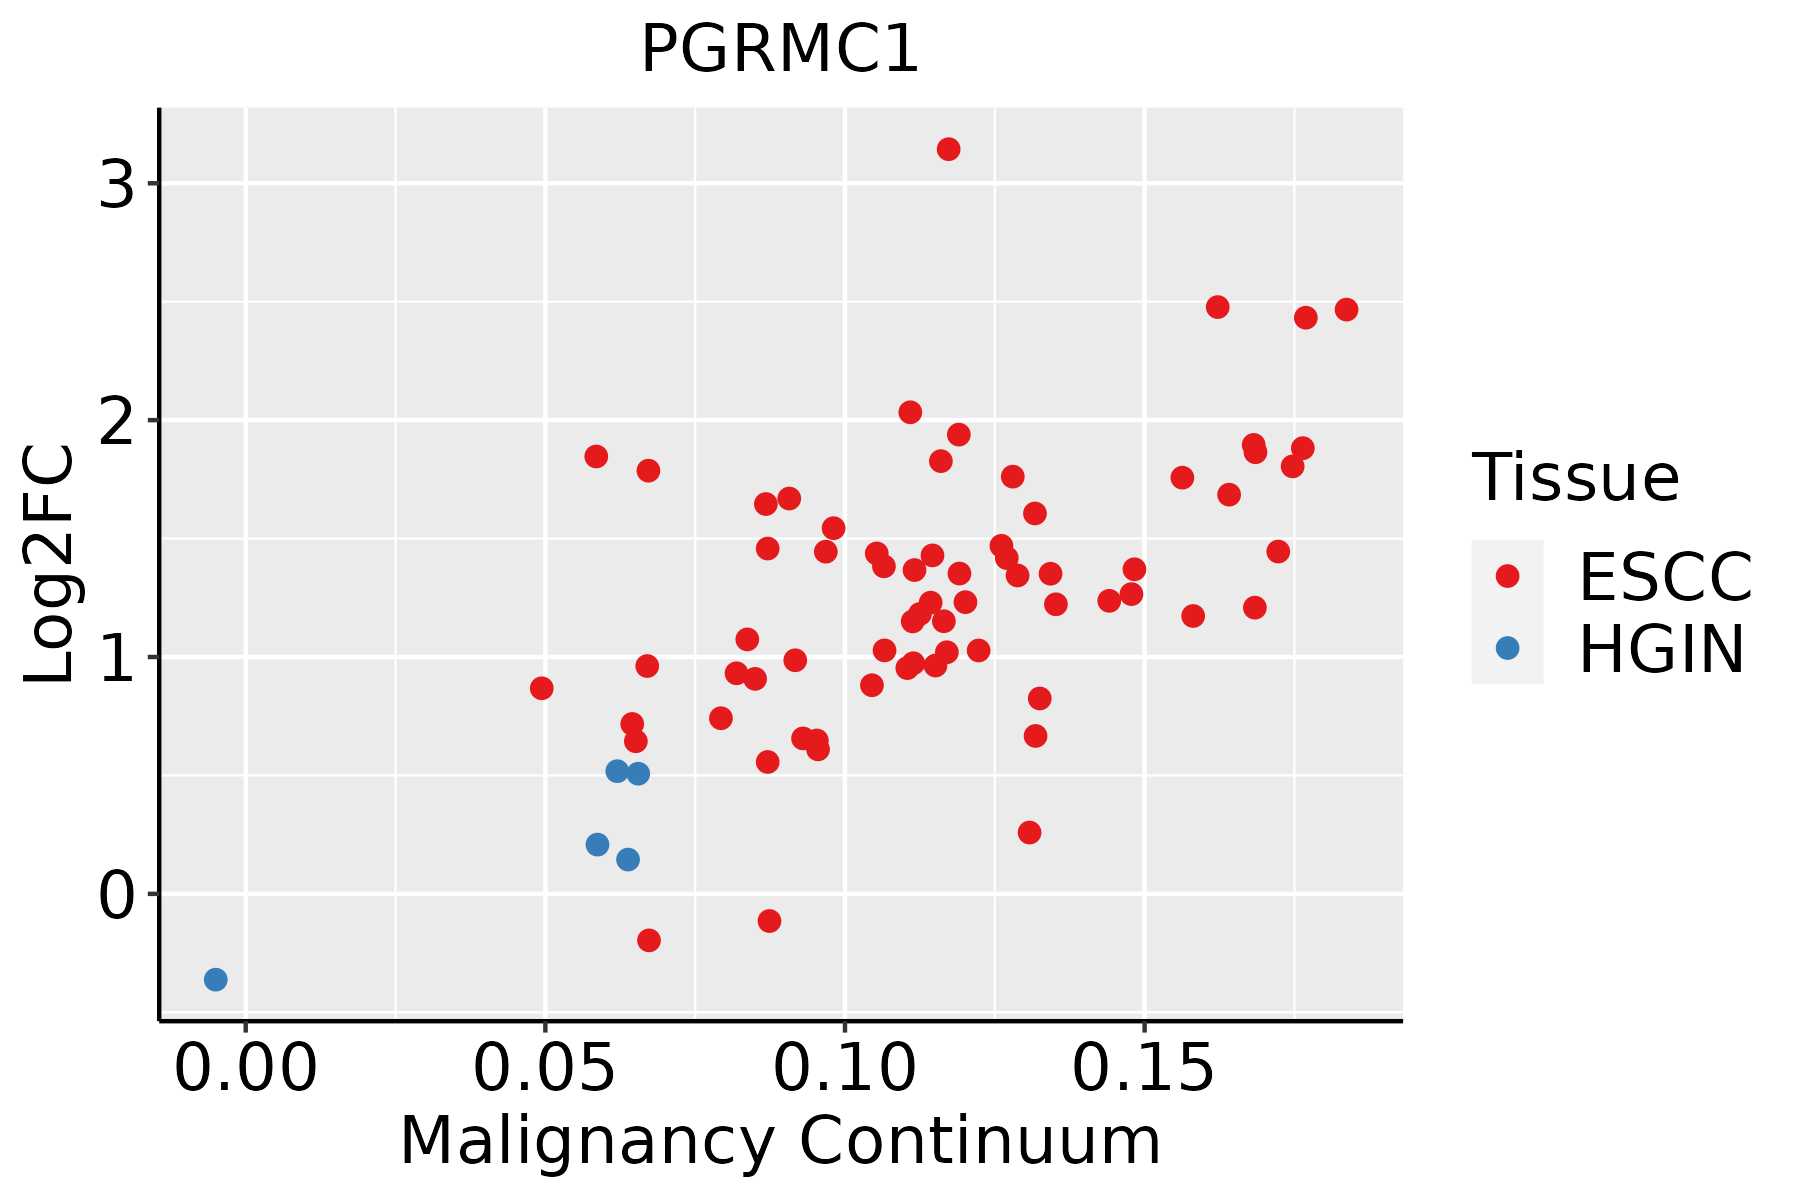 | ESCC: Esophageal squamous cell carcinoma |
| HGIN: High-grade intraepithelial neoplasias |
| LGIN: Low-grade intraepithelial neoplasias |
| Liver | 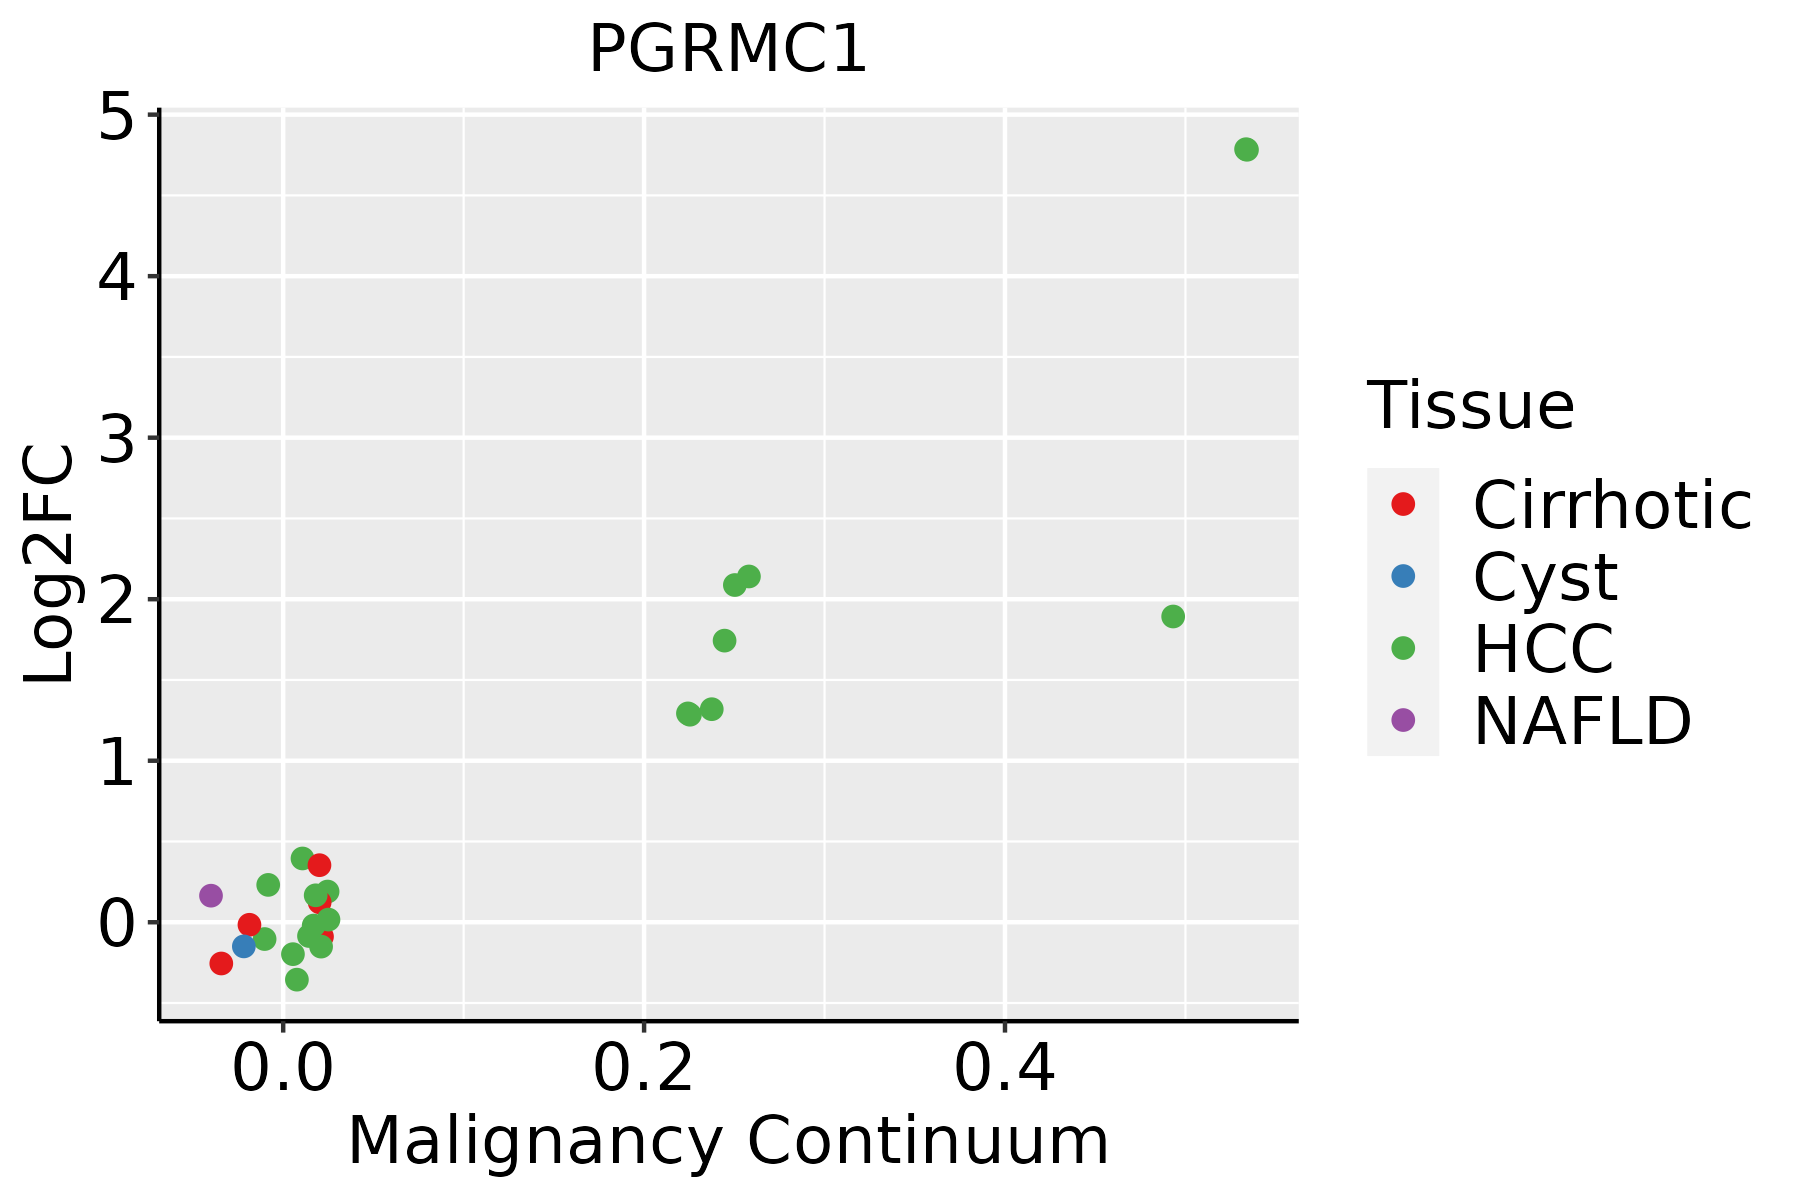 | HCC: Hepatocellular carcinoma |
| NAFLD: Non-alcoholic fatty liver disease |
| Oral Cavity | 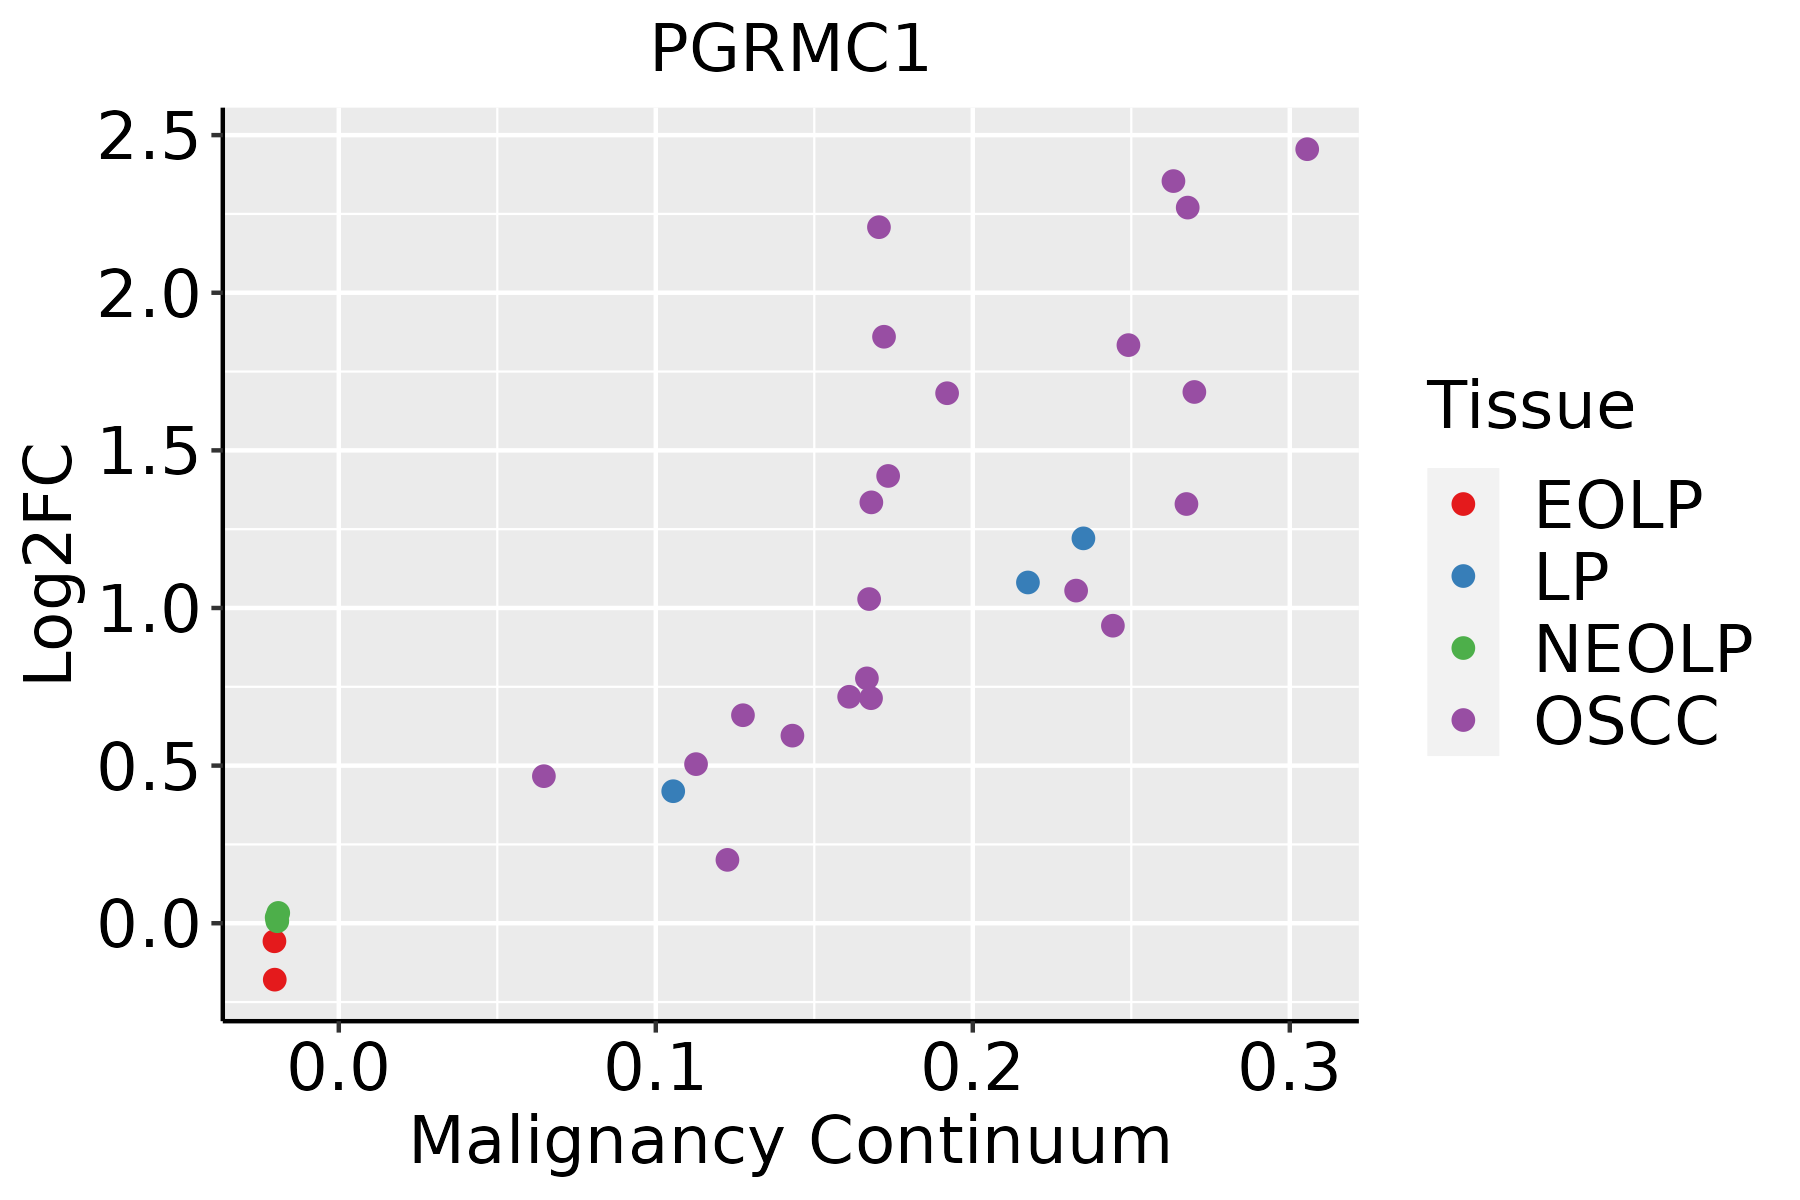 | EOLP: Erosive Oral lichen planus |
| LP: leukoplakia |
| NEOLP: Non-erosive oral lichen planus |
| OSCC: Oral squamous cell carcinoma |
| Prostate |  | BPH: Benign Prostatic Hyperplasia |
| Skin |  | AK: Actinic keratosis |
| cSCC: Cutaneous squamous cell carcinoma |
| SCCIS:squamous cell carcinoma in situ |
| Thyroid |  | ATC: Anaplastic thyroid cancer |
| HT: Hashimoto's thyroiditis |
| PTC: Papillary thyroid cancer |
| GO ID | Tissue | Disease Stage | Description | Gene Ratio | Bg Ratio | pvalue | p.adjust | Count |
| GO:00067791 | Esophagus | ESCC | porphyrin-containing compound biosynthetic process | 23/8552 | 31/18723 | 1.20e-03 | 5.88e-03 | 23 |
| GO:00330141 | Esophagus | ESCC | tetrapyrrole biosynthetic process | 23/8552 | 31/18723 | 1.20e-03 | 5.88e-03 | 23 |
| GO:00461482 | Esophagus | ESCC | pigment biosynthetic process | 40/8552 | 62/18723 | 2.14e-03 | 9.54e-03 | 40 |
| GO:00067832 | Esophagus | ESCC | heme biosynthetic process | 20/8552 | 27/18723 | 2.61e-03 | 1.11e-02 | 20 |
| GO:00330132 | Esophagus | ESCC | tetrapyrrole metabolic process | 37/8552 | 59/18723 | 6.23e-03 | 2.29e-02 | 37 |
| GO:00424401 | Esophagus | ESCC | pigment metabolic process | 50/8552 | 84/18723 | 7.34e-03 | 2.64e-02 | 50 |
| GO:00421681 | Esophagus | ESCC | heme metabolic process | 27/8552 | 42/18723 | 1.16e-02 | 3.90e-02 | 27 |
| GO:0033013 | Liver | Cirrhotic | tetrapyrrole metabolic process | 24/4634 | 59/18723 | 5.06e-03 | 2.62e-02 | 24 |
| GO:0006778 | Liver | Cirrhotic | porphyrin-containing compound metabolic process | 20/4634 | 49/18723 | 9.60e-03 | 4.35e-02 | 20 |
| GO:0042168 | Liver | HCC | heme metabolic process | 30/7958 | 42/18723 | 1.40e-04 | 1.13e-03 | 30 |
| GO:00330131 | Liver | HCC | tetrapyrrole metabolic process | 39/7958 | 59/18723 | 2.14e-04 | 1.63e-03 | 39 |
| GO:00067781 | Liver | HCC | porphyrin-containing compound metabolic process | 33/7958 | 49/18723 | 3.86e-04 | 2.62e-03 | 33 |
| GO:0042440 | Liver | HCC | pigment metabolic process | 51/7958 | 84/18723 | 5.74e-04 | 3.65e-03 | 51 |
| GO:0006783 | Liver | HCC | heme biosynthetic process | 19/7958 | 27/18723 | 3.18e-03 | 1.47e-02 | 19 |
| GO:0006779 | Liver | HCC | porphyrin-containing compound biosynthetic process | 21/7958 | 31/18723 | 4.01e-03 | 1.76e-02 | 21 |
| GO:0033014 | Liver | HCC | tetrapyrrole biosynthetic process | 21/7958 | 31/18723 | 4.01e-03 | 1.76e-02 | 21 |
| GO:0046148 | Liver | HCC | pigment biosynthetic process | 37/7958 | 62/18723 | 4.73e-03 | 2.02e-02 | 37 |
| GO:00461481 | Oral cavity | OSCC | pigment biosynthetic process | 36/7305 | 62/18723 | 1.82e-03 | 8.57e-03 | 36 |
| GO:00067831 | Oral cavity | OSCC | heme biosynthetic process | 17/7305 | 27/18723 | 1.01e-02 | 3.49e-02 | 17 |
| Hugo Symbol | Variant Class | Variant Classification | dbSNP RS | HGVSc | HGVSp | HGVSp Short | SWISSPROT | BIOTYPE | SIFT | PolyPhen | Tumor Sample Barcode | Tissue | Histology | Sex | Age | Stage | Therapy Types | Drugs | Outcome |
| PGRMC1 | SNV | Missense_Mutation | | c.562N>A | p.Asp188Asn | p.D188N | O00264 | protein_coding | tolerated(0.13) | benign(0.007) | TCGA-BH-A1EW-01 | Breast | breast invasive carcinoma | Female | <65 | I/II | Unknown | Unknown | PD |
| PGRMC1 | SNV | Missense_Mutation | | c.70N>A | p.Glu24Lys | p.E24K | O00264 | protein_coding | deleterious(0) | possibly_damaging(0.625) | TCGA-C8-A274-01 | Breast | breast invasive carcinoma | Female | <65 | I/II | Hormone Therapy | tamoxiphen | SD |
| PGRMC1 | SNV | Missense_Mutation | | c.32N>A | p.Ala11Asp | p.A11D | O00264 | protein_coding | tolerated(0.36) | benign(0) | TCGA-E2-A1LA-01 | Breast | breast invasive carcinoma | Female | <65 | I/II | Hormone Therapy | arimidex | SD |
| PGRMC1 | SNV | Missense_Mutation | | c.325N>T | p.Pro109Ser | p.P109S | O00264 | protein_coding | deleterious(0) | possibly_damaging(0.816) | TCGA-A6-6781-01 | Colorectum | colon adenocarcinoma | Male | <65 | III/IV | Chemotherapy | oxaliplatin | SD |
| PGRMC1 | SNV | Missense_Mutation | | c.218N>G | p.Phe73Cys | p.F73C | O00264 | protein_coding | deleterious(0) | probably_damaging(0.996) | TCGA-AA-3660-01 | Colorectum | colon adenocarcinoma | Female | <65 | I/II | Unknown | Unknown | SD |
| PGRMC1 | SNV | Missense_Mutation | | c.43N>A | p.Asp15Asn | p.D15N | O00264 | protein_coding | tolerated(0.23) | benign(0.003) | TCGA-AP-A0LM-01 | Endometrium | uterine corpus endometrioid carcinoma | Female | <65 | III/IV | Chemotherapy | cisplatin | SD |
| PGRMC1 | SNV | Missense_Mutation | novel | c.103N>A | p.Leu35Ile | p.L35I | O00264 | protein_coding | tolerated(0.06) | benign(0.177) | TCGA-AX-A06F-01 | Endometrium | uterine corpus endometrioid carcinoma | Female | <65 | III/IV | Chemotherapy | carboplatin | SD |
| PGRMC1 | SNV | Missense_Mutation | novel | c.181G>A | p.Glu61Lys | p.E61K | O00264 | protein_coding | tolerated(0.3) | benign(0.018) | TCGA-EO-A22U-01 | Endometrium | uterine corpus endometrioid carcinoma | Female | >=65 | I/II | Unknown | Unknown | SD |
| PGRMC1 | SNV | Missense_Mutation | | c.23C>T | p.Ala8Val | p.A8V | O00264 | protein_coding | tolerated(0.14) | benign(0.042) | TCGA-FI-A2D0-01 | Endometrium | uterine corpus endometrioid carcinoma | Female | <65 | I/II | Unknown | Unknown | SD |
| PGRMC1 | insertion | In_Frame_Ins | novel | c.584_585insATTGTTTGTGTG | p.Asp195delinsGluLeuPheValCys | p.D195delinsELFVC | O00264 | protein_coding | | | TCGA-BS-A0UJ-01 | Endometrium | uterine corpus endometrioid carcinoma | Female | >=65 | I/II | Unknown | Unknown | SD |


