
|
|||||
|
 | |
| |
| |
| |
| |
| |
|
Gene: PGR |
Gene summary for PGR |
| Gene information | Species | Human | Gene symbol | PGR | Gene ID | 5241 |
| Gene name | progesterone receptor | |
| Gene Alias | NR3C3 | |
| Cytomap | 11q22.1 | |
| Gene Type | protein-coding | GO ID | GO:0000003 | UniProtAcc | P06401 |
Top |
Malignant transformation analysis |
| Identification of the aberrant gene expression in precancerous and cancerous lesions by comparing the gene expression of stem-like cells in diseased tissues with normal stem cells |
| Entrez ID | Symbol | Replicates | Species | Organ | Tissue | Adj P-value | Log2FC | Malignancy |
| 5241 | PGR | GSM4909301 | Human | Breast | IDC | 1.86e-16 | 5.31e-01 | 0.1577 |
| 5241 | PGR | GSM4909302 | Human | Breast | IDC | 1.05e-24 | 6.56e-01 | 0.1545 |
| 5241 | PGR | GSM4909303 | Human | Breast | IDC | 1.24e-07 | 4.58e-01 | 0.0438 |
| 5241 | PGR | GSM4909304 | Human | Breast | IDC | 4.23e-51 | 8.14e-01 | 0.1636 |
| 5241 | PGR | NCCBC11 | Human | Breast | DCIS | 1.04e-04 | 5.63e-01 | 0.1232 |
| 5241 | PGR | P3 | Human | Breast | IDC | 3.70e-06 | 5.41e-01 | 0.1542 |
| 5241 | PGR | AEH-subject1 | Human | Endometrium | AEH | 1.63e-10 | -4.32e-01 | -0.3059 |
| 5241 | PGR | AEH-subject2 | Human | Endometrium | AEH | 1.19e-17 | -4.39e-01 | -0.2525 |
| 5241 | PGR | AEH-subject3 | Human | Endometrium | AEH | 1.22e-04 | 9.40e-02 | -0.2576 |
| 5241 | PGR | AEH-subject5 | Human | Endometrium | AEH | 4.24e-06 | -3.27e-01 | -0.2953 |
| 5241 | PGR | EEC-subject1 | Human | Endometrium | EEC | 1.31e-02 | -1.60e-02 | -0.2682 |
| 5241 | PGR | EEC-subject2 | Human | Endometrium | EEC | 4.07e-18 | -5.42e-01 | -0.2607 |
| 5241 | PGR | EEC-subject3 | Human | Endometrium | EEC | 6.99e-28 | -4.64e-01 | -0.2525 |
| 5241 | PGR | EEC-subject4 | Human | Endometrium | EEC | 5.43e-20 | -5.38e-01 | -0.2571 |
| 5241 | PGR | EEC-subject5 | Human | Endometrium | EEC | 1.03e-06 | -3.29e-01 | -0.249 |
| 5241 | PGR | GSM5276934 | Human | Endometrium | EEC | 5.61e-52 | -8.89e-01 | -0.0913 |
| 5241 | PGR | GSM5276935 | Human | Endometrium | EEC | 3.39e-04 | -2.63e-01 | -0.123 |
| 5241 | PGR | GSM5276937 | Human | Endometrium | EEC | 6.13e-35 | -8.22e-01 | -0.0897 |
| 5241 | PGR | GSM6177620_NYU_UCEC1_lib1_lib1 | Human | Endometrium | EEC | 8.08e-30 | -6.41e-01 | -0.1869 |
| 5241 | PGR | GSM6177620_NYU_UCEC1_lib2_lib2 | Human | Endometrium | EEC | 2.88e-34 | -8.13e-01 | -0.1875 |
| Page: 1 2 |
| Tissue | Expression Dynamics | Abbreviation |
| Breast |  | IDC: Invasive ductal carcinoma |
| DCIS: Ductal carcinoma in situ | ||
| Precancer(BRCA1-mut): Precancerous lesion from BRCA1 mutation carriers | ||
| Endometrium | 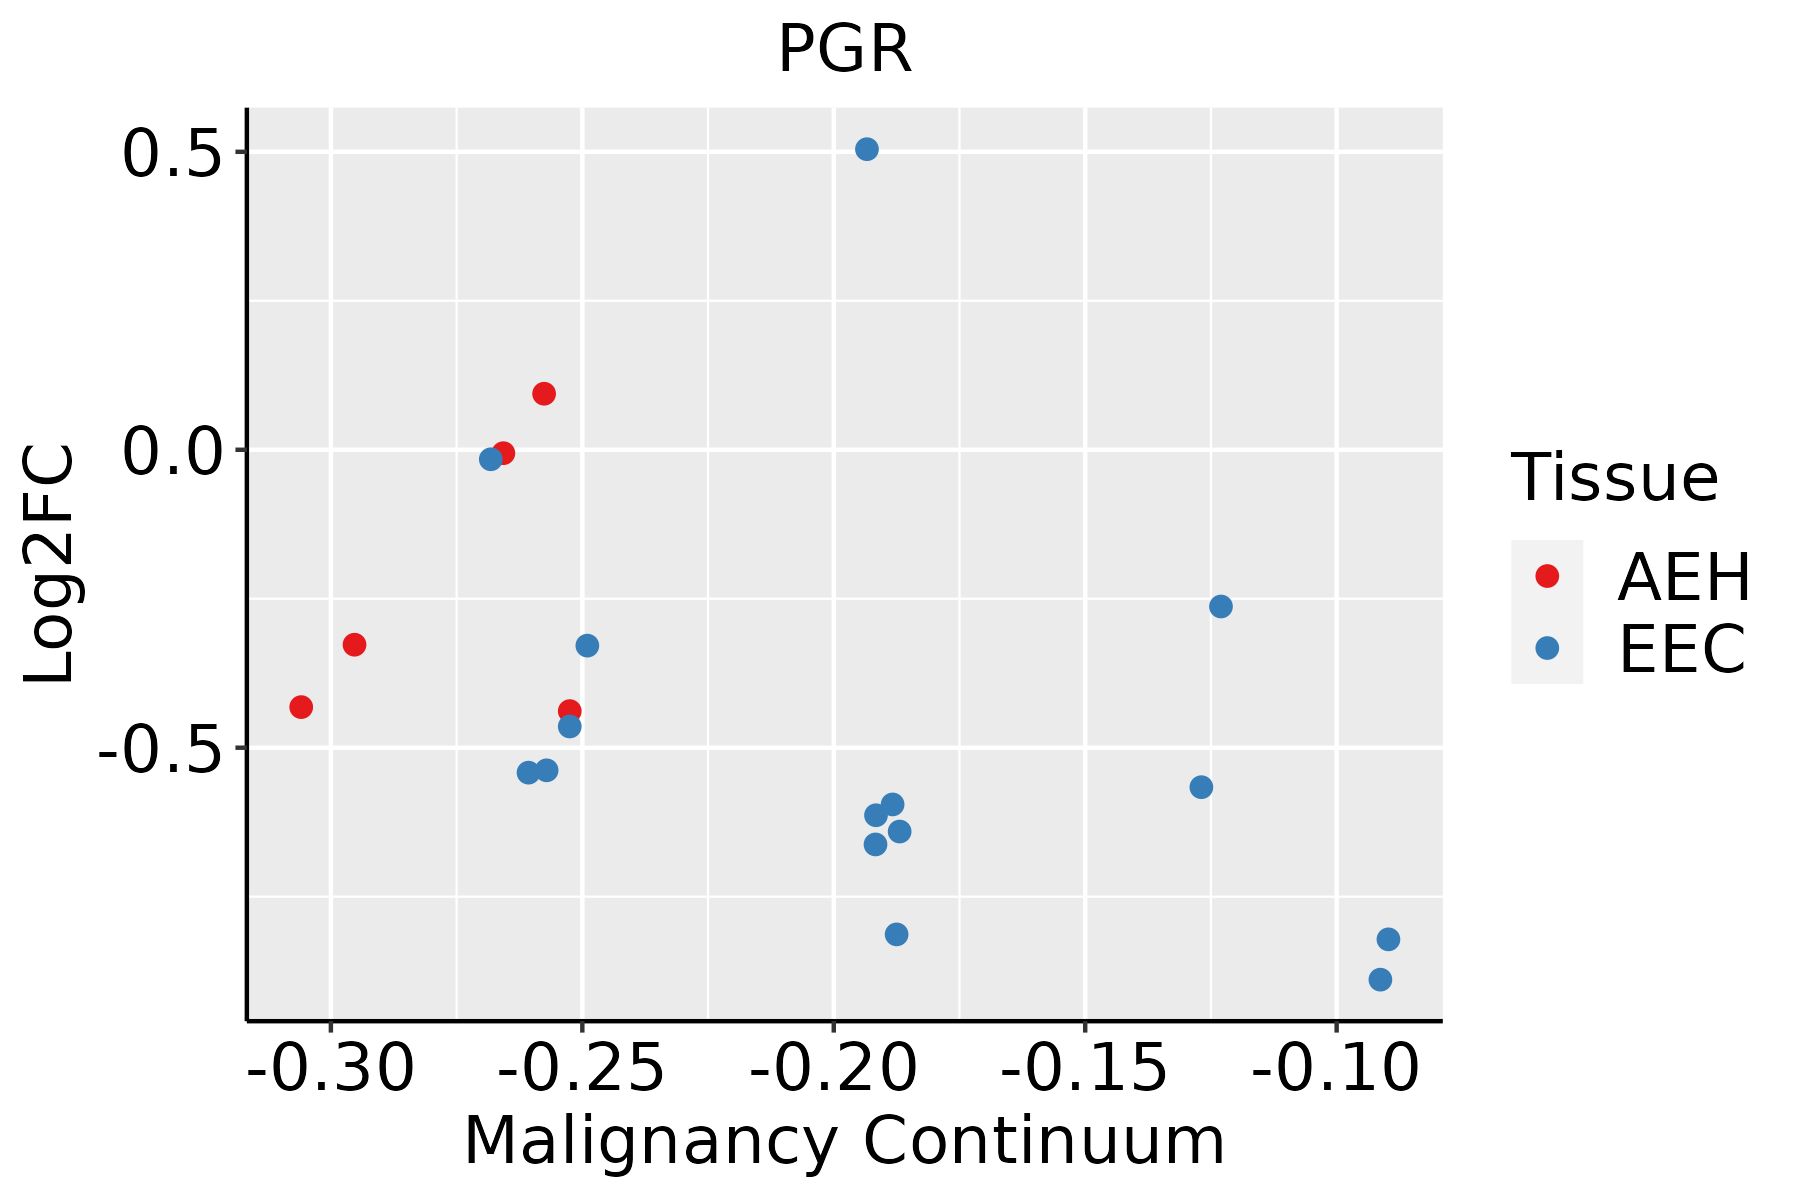 | AEH: Atypical endometrial hyperplasia |
| EEC: Endometrioid Cancer |
| ∗log2FC in expression of this searched gene in stem-like cells from each diseased tissue sample relative to stem-like cells in normal samples in each tissue plotted against the malignancy continuum. Samples are colored based on if they are from different disease stage. |
Top |
Malignant transformation related pathway analysis |
| Find out the enriched GO biological processes and KEGG pathways involved in transition from healthy to precancer to cancer |
| Tissue | Disease Stage | Enriched GO biological Processes |
| Colorectum | AD |  |
| Colorectum | SER |  |
| Colorectum | MSS |  |
| Colorectum | MSI-H |  |
| Colorectum | FAP |  |
| ∗Top 15 enriched GO BP terms are showed in the bar plot of each disease state in each tissue. Each row represents a significant GO biological process which is colored according to the -log10(p.adjust). |
| Page: 1 2 3 4 5 6 7 8 9 |
| GO ID | Tissue | Disease Stage | Description | Gene Ratio | Bg Ratio | pvalue | p.adjust | Count |
| GO:004854514 | Breast | IDC | response to steroid hormone | 70/1434 | 339/18723 | 1.34e-14 | 4.23e-12 | 70 |
| GO:000756511 | Breast | IDC | female pregnancy | 39/1434 | 193/18723 | 1.81e-08 | 1.27e-06 | 39 |
| GO:00447061 | Breast | IDC | multi-multicellular organism process | 41/1434 | 220/18723 | 8.58e-08 | 5.19e-06 | 41 |
| GO:004873214 | Breast | IDC | gland development | 64/1434 | 436/18723 | 3.47e-07 | 1.74e-05 | 64 |
| GO:004860812 | Breast | IDC | reproductive structure development | 60/1434 | 424/18723 | 2.71e-06 | 1.03e-04 | 60 |
| GO:006145813 | Breast | IDC | reproductive system development | 60/1434 | 427/18723 | 3.41e-06 | 1.24e-04 | 60 |
| GO:007138314 | Breast | IDC | cellular response to steroid hormone stimulus | 35/1434 | 204/18723 | 5.29e-06 | 1.75e-04 | 35 |
| GO:005067313 | Breast | IDC | epithelial cell proliferation | 60/1434 | 437/18723 | 7.13e-06 | 2.15e-04 | 60 |
| GO:005067812 | Breast | IDC | regulation of epithelial cell proliferation | 54/1434 | 381/18723 | 8.07e-06 | 2.39e-04 | 54 |
| GO:00601352 | Breast | IDC | maternal process involved in female pregnancy | 16/1434 | 62/18723 | 1.20e-05 | 3.17e-04 | 16 |
| GO:003051813 | Breast | IDC | intracellular steroid hormone receptor signaling pathway | 22/1434 | 116/18723 | 6.16e-05 | 1.28e-03 | 22 |
| GO:006056212 | Breast | IDC | epithelial tube morphogenesis | 44/1434 | 325/18723 | 1.58e-04 | 2.73e-03 | 44 |
| GO:00303244 | Breast | IDC | lung development | 28/1434 | 177/18723 | 1.90e-04 | 3.15e-03 | 28 |
| GO:003052214 | Breast | IDC | intracellular receptor signaling pathway | 37/1434 | 265/18723 | 2.77e-04 | 4.26e-03 | 37 |
| GO:00303234 | Breast | IDC | respiratory tube development | 28/1434 | 181/18723 | 2.78e-04 | 4.26e-03 | 28 |
| GO:003087911 | Breast | IDC | mammary gland development | 23/1434 | 137/18723 | 2.87e-04 | 4.37e-03 | 23 |
| GO:00611383 | Breast | IDC | morphogenesis of a branching epithelium | 28/1434 | 182/18723 | 3.05e-04 | 4.60e-03 | 28 |
| GO:0008406 | Breast | IDC | gonad development | 32/1434 | 221/18723 | 3.64e-04 | 5.23e-03 | 32 |
| GO:00605412 | Breast | IDC | respiratory system development | 30/1434 | 203/18723 | 3.85e-04 | 5.40e-03 | 30 |
| GO:00017635 | Breast | IDC | morphogenesis of a branching structure | 29/1434 | 196/18723 | 4.68e-04 | 6.26e-03 | 29 |
| Page: 1 2 3 4 5 6 7 8 9 10 11 12 |
| Pathway ID | Tissue | Disease Stage | Description | Gene Ratio | Bg Ratio | pvalue | p.adjust | qvalue | Count |
| hsa0491523 | Breast | IDC | Estrogen signaling pathway | 35/867 | 138/8465 | 2.55e-07 | 5.18e-06 | 3.88e-06 | 35 |
| hsa0491533 | Breast | IDC | Estrogen signaling pathway | 35/867 | 138/8465 | 2.55e-07 | 5.18e-06 | 3.88e-06 | 35 |
| hsa0491542 | Breast | DCIS | Estrogen signaling pathway | 35/846 | 138/8465 | 1.40e-07 | 2.51e-06 | 1.85e-06 | 35 |
| hsa0491552 | Breast | DCIS | Estrogen signaling pathway | 35/846 | 138/8465 | 1.40e-07 | 2.51e-06 | 1.85e-06 | 35 |
| hsa0491525 | Endometrium | AEH | Estrogen signaling pathway | 35/1197 | 138/8465 | 3.10e-04 | 2.40e-03 | 1.75e-03 | 35 |
| hsa04915111 | Endometrium | AEH | Estrogen signaling pathway | 35/1197 | 138/8465 | 3.10e-04 | 2.40e-03 | 1.75e-03 | 35 |
| hsa0491526 | Endometrium | EEC | Estrogen signaling pathway | 34/1237 | 138/8465 | 1.19e-03 | 8.02e-03 | 5.98e-03 | 34 |
| hsa0491535 | Endometrium | EEC | Estrogen signaling pathway | 34/1237 | 138/8465 | 1.19e-03 | 8.02e-03 | 5.98e-03 | 34 |
| Page: 1 |
Top |
Cell-cell communication analysis |
| Identification of potential cell-cell interactions between two cell types and their ligand-receptor pairs for different disease states |
| Ligand | Receptor | LRpair | Pathway | Tissue | Disease Stage |
| Page: 1 |
Top |
Single-cell gene regulatory network inference analysis |
| Find out the significant the regulons (TFs) and the target genes of each regulon across cell types for different disease states |
| TF | Cell Type | Tissue | Disease Stage | Target Gene | RSS | Regulon Activity |
| PGR | BAS | Cervix | CC | COL21A1,LINC01480,LINC02814, etc. | 1.13e-03 |  |
| PGR | COL | Cervix | CC | COL21A1,LINC01480,LINC02814, etc. | 4.03e-03 | |
| PGR | ECM | Esophagus | ESCC | SLC40A1,IL10,TRMT12, etc. | 1.07e-01 |  |
| PGR | MSC | Esophagus | ESCC | SLC40A1,IL10,TRMT12, etc. | 1.96e-01 | |
| PGR | INCAF | Oral cavity | ADJ | LCMT2,POLD3,RIF1, etc. | 7.38e-02 |  |
| PGR | INCAF | Oral cavity | LP | LCMT2,POLD3,RIF1, etc. | 4.39e-01 |  |
| ∗The dot plots of a searched regulon are shown for all cell subpopulations in each disease state of each tissue based on the regulon specific score inferred using pySCENIC and by calculating the average expression. |
| Page: 1 |
Top |
Somatic mutation of malignant transformation related genes |
| Annotation of somatic variants for genes involved in malignant transformation |
| Hugo Symbol | Variant Class | Variant Classification | dbSNP RS | HGVSc | HGVSp | HGVSp Short | SWISSPROT | BIOTYPE | SIFT | PolyPhen | Tumor Sample Barcode | Tissue | Histology | Sex | Age | Stage | Therapy Types | Drugs | Outcome |
| PGR | SNV | Missense_Mutation | novel | c.2741N>T | p.Ala914Val | p.A914V | P06401 | protein_coding | deleterious(0) | benign(0.297) | TCGA-AN-A046-01 | Breast | breast invasive carcinoma | Female | >=65 | I/II | Unknown | Unknown | SD |
| PGR | SNV | Missense_Mutation | rs149186732 | c.2219N>A | p.Arg740Gln | p.R740Q | P06401 | protein_coding | deleterious(0.01) | probably_damaging(0.984) | TCGA-AN-A046-01 | Breast | breast invasive carcinoma | Female | >=65 | I/II | Unknown | Unknown | SD |
| PGR | SNV | Missense_Mutation | c.2497N>A | p.Glu833Lys | p.E833K | P06401 | protein_coding | deleterious(0) | probably_damaging(0.992) | TCGA-AO-A0JC-01 | Breast | breast invasive carcinoma | Female | <65 | I/II | Chemotherapy | fluorouracil | SD | |
| PGR | SNV | Missense_Mutation | c.2167N>A | p.Glu723Lys | p.E723K | P06401 | protein_coding | deleterious(0) | probably_damaging(0.988) | TCGA-AR-A255-01 | Breast | breast invasive carcinoma | Female | <65 | I/II | Targeted Molecular therapy | trastuzumab | SD | |
| PGR | SNV | Missense_Mutation | c.1807N>C | p.Cys603Arg | p.C603R | P06401 | protein_coding | deleterious(0) | probably_damaging(0.999) | TCGA-C8-A27A-01 | Breast | breast invasive carcinoma | Female | <65 | I/II | Chemotherapy | 5-fluorouracil | CR | |
| PGR | SNV | Missense_Mutation | c.2285G>T | p.Gly762Val | p.G762V | P06401 | protein_coding | deleterious(0.01) | probably_damaging(0.983) | TCGA-E9-A1ND-01 | Breast | breast invasive carcinoma | Female | >=65 | I/II | Hormone Therapy | aromasin | SD | |
| PGR | insertion | Frame_Shift_Ins | novel | c.1786_1787insG | p.Glu596GlyfsTer13 | p.E596Gfs*13 | P06401 | protein_coding | TCGA-AO-A0J7-01 | Breast | breast invasive carcinoma | Female | >=65 | I/II | Chemotherapy | doxorubicin | SD | ||
| PGR | SNV | Missense_Mutation | novel | c.1834N>C | p.Asp612His | p.D612H | P06401 | protein_coding | deleterious(0) | probably_damaging(1) | TCGA-C5-A7UC-01 | Cervix | cervical & endocervical cancer | Female | <65 | I/II | Unknown | Unknown | SD |
| PGR | SNV | Missense_Mutation | c.2529N>C | p.Glu843Asp | p.E843D | P06401 | protein_coding | deleterious(0.04) | benign(0.123) | TCGA-EA-A78R-01 | Cervix | cervical & endocervical cancer | Female | <65 | I/II | Unknown | Unknown | SD | |
| PGR | SNV | Missense_Mutation | c.2684N>G | p.Phe895Cys | p.F895C | P06401 | protein_coding | deleterious(0) | probably_damaging(0.998) | TCGA-FU-A3HZ-01 | Cervix | cervical & endocervical cancer | Female | <65 | I/II | Chemotherapy | cisplatin | CR |
| Page: 1 2 3 4 5 6 7 8 9 10 11 |
Top |
Related drugs of malignant transformation related genes |
| Identification of chemicals and drugs interact with genes involved in malignant transfromation |
| (DGIdb 4.0) |
| Entrez ID | Symbol | Category | Interaction Types | Drug Claim Name | Drug Name | PMIDs |
| 5241 | PGR | DRUGGABLE GENOME, NUCLEAR HORMONE RECEPTOR | agonist | 178103659 | ||
| 5241 | PGR | DRUGGABLE GENOME, NUCLEAR HORMONE RECEPTOR | Exemestane | EXEMESTANE | ||
| 5241 | PGR | DRUGGABLE GENOME, NUCLEAR HORMONE RECEPTOR | BAY 86-5044 | |||
| 5241 | PGR | DRUGGABLE GENOME, NUCLEAR HORMONE RECEPTOR | Lapatinib | LAPATINIB | ||
| 5241 | PGR | DRUGGABLE GENOME, NUCLEAR HORMONE RECEPTOR | neratinib | NERATINIB | ||
| 5241 | PGR | DRUGGABLE GENOME, NUCLEAR HORMONE RECEPTOR | olaparib | OLAPARIB | ||
| 5241 | PGR | DRUGGABLE GENOME, NUCLEAR HORMONE RECEPTOR | Tosagestin | TOSAGESTIN | ||
| 5241 | PGR | DRUGGABLE GENOME, NUCLEAR HORMONE RECEPTOR | agonist | CHEMBL1509 | DROSPIRENONE | |
| 5241 | PGR | DRUGGABLE GENOME, NUCLEAR HORMONE RECEPTOR | MEDROXYPROGESTERONE | MEDROXYPROGESTERONE ACETATE | 12846422 | |
| 5241 | PGR | DRUGGABLE GENOME, NUCLEAR HORMONE RECEPTOR | agonist | CHEMBL1389 | LEVONORGESTREL |
| Page: 1 2 3 4 5 6 7 8 9 10 11 12 13 14 15 |

Copyright 2023-Present -The University of Texas Health Science Center at Houston |