
|
|||||
|
 | |
| |
| |
| |
| |
| |
|
Gene: PGM5 |
Gene summary for PGM5 |
| Gene information | Species | Human | Gene symbol | PGM5 | Gene ID | 5239 |
| Gene name | phosphoglucomutase 5 | |
| Gene Alias | PGMRP | |
| Cytomap | 9q21.11 | |
| Gene Type | protein-coding | GO ID | GO:0005975 | UniProtAcc | Q15124 |
Top |
Malignant transformation analysis |
| Identification of the aberrant gene expression in precancerous and cancerous lesions by comparing the gene expression of stem-like cells in diseased tissues with normal stem cells |
| Entrez ID | Symbol | Replicates | Species | Organ | Tissue | Adj P-value | Log2FC | Malignancy |
| 5239 | PGM5 | S014 | Human | Liver | HCC | 6.80e-30 | 8.62e-01 | 0.2254 |
| 5239 | PGM5 | S015 | Human | Liver | HCC | 4.22e-24 | 1.07e+00 | 0.2375 |
| 5239 | PGM5 | S016 | Human | Liver | HCC | 2.01e-40 | 1.04e+00 | 0.2243 |
| 5239 | PGM5 | GSM5353221_PA_PB2A_Pool_1_3_S25_L001 | Human | Prostate | Tumor | 4.32e-04 | 3.62e-01 | 0.1633 |
| 5239 | PGM5 | GSM5353222_PA_PB2B_Pool_1_3_S52_L002 | Human | Prostate | Tumor | 1.05e-06 | 4.51e-01 | 0.1608 |
| 5239 | PGM5 | GSM5353223_PA_PB2B_Pool_2_S26_L001 | Human | Prostate | Tumor | 1.10e-10 | 5.99e-01 | 0.1604 |
| 5239 | PGM5 | GSM5353227_PA_PR5199-193K_Pool_1_2_3_S55_L002 | Human | Prostate | Tumor | 1.01e-04 | 4.46e-01 | 0.1602 |
| 5239 | PGM5 | GSM5353237_PA_PR5251_T2_S8_L001 | Human | Prostate | Tumor | 8.80e-03 | 5.38e-01 | 0.1622 |
| 5239 | PGM5 | GSM5353240_PA_PR5254_T1_S15_L001 | Human | Prostate | Tumor | 5.22e-06 | 4.19e-01 | 0.1575 |
| 5239 | PGM5 | GSM5353243_PA_PR5261_T1_S23_L002 | Human | Prostate | Tumor | 1.25e-03 | 3.77e-01 | 0.1545 |
| Page: 1 |
| Tissue | Expression Dynamics | Abbreviation |
| Liver |  | HCC: Hepatocellular carcinoma |
| NAFLD: Non-alcoholic fatty liver disease | ||
| Prostate | 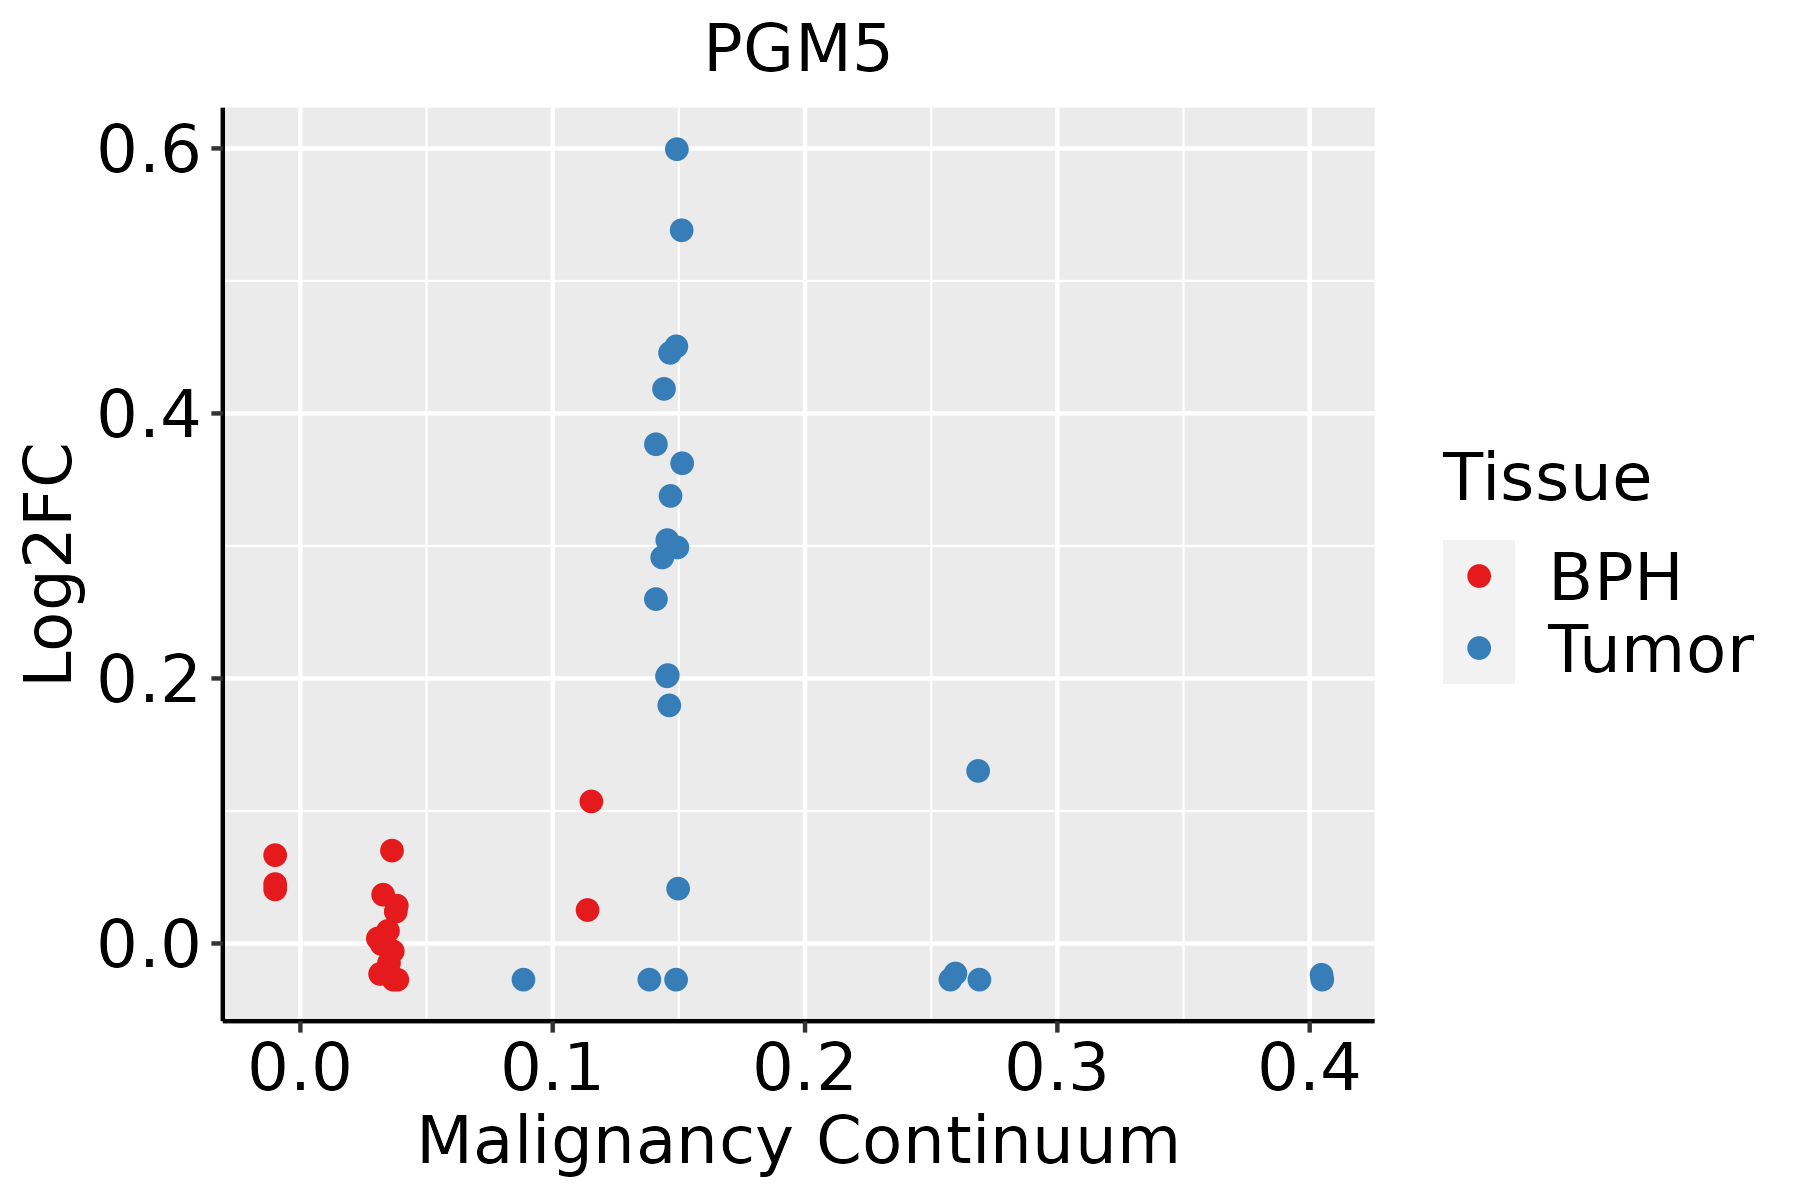 | BPH: Benign Prostatic Hyperplasia |
| ∗log2FC in expression of this searched gene in stem-like cells from each diseased tissue sample relative to stem-like cells in normal samples in each tissue plotted against the malignancy continuum. Samples are colored based on if they are from different disease stage. |
Top |
Malignant transformation related pathway analysis |
| Find out the enriched GO biological processes and KEGG pathways involved in transition from healthy to precancer to cancer |
| Tissue | Disease Stage | Enriched GO biological Processes |
| Colorectum | AD |  |
| Colorectum | SER |  |
| Colorectum | MSS |  |
| Colorectum | MSI-H |  |
| Colorectum | FAP |  |
| ∗Top 15 enriched GO BP terms are showed in the bar plot of each disease state in each tissue. Each row represents a significant GO biological process which is colored according to the -log10(p.adjust). |
| Page: 1 2 3 4 5 6 7 8 9 |
| GO ID | Tissue | Disease Stage | Description | Gene Ratio | Bg Ratio | pvalue | p.adjust | Count |
| GO:000599621 | Liver | HCC | monosaccharide metabolic process | 167/7958 | 257/18723 | 2.31e-13 | 1.25e-11 | 167 |
| GO:001931821 | Liver | HCC | hexose metabolic process | 155/7958 | 237/18723 | 7.63e-13 | 3.90e-11 | 155 |
| GO:000600621 | Liver | HCC | glucose metabolic process | 128/7958 | 196/18723 | 8.60e-11 | 3.06e-09 | 128 |
| GO:003103222 | Liver | HCC | actomyosin structure organization | 109/7958 | 196/18723 | 1.39e-04 | 1.13e-03 | 109 |
| GO:003103216 | Prostate | Tumor | actomyosin structure organization | 63/3246 | 196/18723 | 2.94e-07 | 6.72e-06 | 63 |
| GO:006053714 | Prostate | Tumor | muscle tissue development | 107/3246 | 403/18723 | 1.93e-06 | 3.34e-05 | 107 |
| GO:001470613 | Prostate | Tumor | striated muscle tissue development | 98/3246 | 384/18723 | 2.96e-05 | 3.56e-04 | 98 |
| GO:000600613 | Prostate | Tumor | glucose metabolic process | 55/3246 | 196/18723 | 1.22e-04 | 1.14e-03 | 55 |
| GO:004269213 | Prostate | Tumor | muscle cell differentiation | 93/3246 | 384/18723 | 3.45e-04 | 2.73e-03 | 93 |
| GO:005114614 | Prostate | Tumor | striated muscle cell differentiation | 69/3246 | 283/18723 | 1.56e-03 | 9.54e-03 | 69 |
| GO:00193187 | Prostate | Tumor | hexose metabolic process | 59/3246 | 237/18723 | 1.96e-03 | 1.14e-02 | 59 |
| GO:00059967 | Prostate | Tumor | monosaccharide metabolic process | 62/3246 | 257/18723 | 3.38e-03 | 1.75e-02 | 62 |
| GO:00550011 | Prostate | Tumor | muscle cell development | 45/3246 | 184/18723 | 8.73e-03 | 3.78e-02 | 45 |
| Page: 1 |
| Pathway ID | Tissue | Disease Stage | Description | Gene Ratio | Bg Ratio | pvalue | p.adjust | qvalue | Count |
| Page: 1 |
Top |
Cell-cell communication analysis |
| Identification of potential cell-cell interactions between two cell types and their ligand-receptor pairs for different disease states |
| Ligand | Receptor | LRpair | Pathway | Tissue | Disease Stage |
| Page: 1 |
Top |
Single-cell gene regulatory network inference analysis |
| Find out the significant the regulons (TFs) and the target genes of each regulon across cell types for different disease states |
| TF | Cell Type | Tissue | Disease Stage | Target Gene | RSS | Regulon Activity |
| ∗The dot plots of a searched regulon are shown for all cell subpopulations in each disease state of each tissue based on the regulon specific score inferred using pySCENIC and by calculating the average expression. |
| Page: 1 |
Top |
Somatic mutation of malignant transformation related genes |
| Annotation of somatic variants for genes involved in malignant transformation |
| Hugo Symbol | Variant Class | Variant Classification | dbSNP RS | HGVSc | HGVSp | HGVSp Short | SWISSPROT | BIOTYPE | SIFT | PolyPhen | Tumor Sample Barcode | Tissue | Histology | Sex | Age | Stage | Therapy Types | Drugs | Outcome |
| PGM5 | SNV | Missense_Mutation | novel | c.518N>G | p.Ser173Cys | p.S173C | Q15124 | protein_coding | deleterious(0.01) | possibly_damaging(0.765) | TCGA-5L-AAT1-01 | Breast | breast invasive carcinoma | Female | <65 | III/IV | Hormone Therapy | letrozol | SD |
| PGM5 | SNV | Missense_Mutation | novel | c.64N>T | p.Ala22Ser | p.A22S | Q15124 | protein_coding | tolerated(0.23) | benign(0.005) | TCGA-A7-A425-01 | Breast | breast invasive carcinoma | Female | >=65 | III/IV | Chemotherapy | adriamycin | PD |
| PGM5 | SNV | Missense_Mutation | c.971N>A | p.Cys324Tyr | p.C324Y | Q15124 | protein_coding | tolerated(0.1) | probably_damaging(0.934) | TCGA-A8-A07L-01 | Breast | breast invasive carcinoma | Female | <65 | III/IV | Chemotherapy | CR | ||
| PGM5 | SNV | Missense_Mutation | novel | c.1315G>A | p.Asp439Asn | p.D439N | Q15124 | protein_coding | deleterious(0.03) | possibly_damaging(0.603) | TCGA-AN-A0AM-01 | Breast | breast invasive carcinoma | Female | <65 | I/II | Unknown | Unknown | SD |
| PGM5 | SNV | Missense_Mutation | c.746C>T | p.Pro249Leu | p.P249L | Q15124 | protein_coding | deleterious(0) | probably_damaging(0.994) | TCGA-B6-A1KF-01 | Breast | breast invasive carcinoma | Female | >=65 | I/II | Unknown | Unknown | SD | |
| PGM5 | SNV | Missense_Mutation | rs141668530 | c.1124N>A | p.Arg375His | p.R375H | Q15124 | protein_coding | deleterious(0.01) | probably_damaging(0.938) | TCGA-D8-A1X9-01 | Breast | breast invasive carcinoma | Female | >=65 | I/II | Chemotherapy | adriamycin+cyclophosphamide | SD |
| PGM5 | SNV | Missense_Mutation | c.1098N>G | p.Phe366Leu | p.F366L | Q15124 | protein_coding | deleterious(0) | possibly_damaging(0.566) | TCGA-D8-A1XQ-01 | Breast | breast invasive carcinoma | Female | >=65 | I/II | Unknown | Unknown | SD | |
| PGM5 | SNV | Missense_Mutation | c.371N>T | p.Cys124Phe | p.C124F | Q15124 | protein_coding | deleterious(0) | possibly_damaging(0.516) | TCGA-E2-A154-01 | Breast | breast invasive carcinoma | Female | >=65 | I/II | Hormone Therapy | arimidex | SD | |
| PGM5 | SNV | Missense_Mutation | c.1640N>C | p.Ile547Thr | p.I547T | Q15124 | protein_coding | deleterious(0.04) | probably_damaging(0.968) | TCGA-EW-A1IZ-01 | Breast | breast invasive carcinoma | Female | <65 | III/IV | Chemotherapy | taxotere | SD | |
| PGM5 | insertion | Frame_Shift_Ins | novel | c.1115_1116insATTTGGGGTTTGTGAAAAGGGAGGTGTTCAC | p.Asp372GlufsTer28 | p.D372Efs*28 | Q15124 | protein_coding | TCGA-A8-A06P-01 | Breast | breast invasive carcinoma | Female | <65 | III/IV | Unspecific | SD |
| Page: 1 2 3 4 5 6 7 8 9 |
Top |
Related drugs of malignant transformation related genes |
| Identification of chemicals and drugs interact with genes involved in malignant transfromation |
| (DGIdb 4.0) |
| Entrez ID | Symbol | Category | Interaction Types | Drug Claim Name | Drug Name | PMIDs |
| Page: 1 |

Copyright 2023-Present -The University of Texas Health Science Center at Houston |