
|
|||||
|
 | |
| |
| |
| |
| |
| |
|
Gene: PGM3 |
Gene summary for PGM3 |
| Gene information | Species | Human | Gene symbol | PGM3 | Gene ID | 5238 |
| Gene name | phosphoglucomutase 3 | |
| Gene Alias | AGM1 | |
| Cytomap | 6q14.1 | |
| Gene Type | protein-coding | GO ID | GO:0000003 | UniProtAcc | O95394 |
Top |
Malignant transformation analysis |
| Identification of the aberrant gene expression in precancerous and cancerous lesions by comparing the gene expression of stem-like cells in diseased tissues with normal stem cells |
| Entrez ID | Symbol | Replicates | Species | Organ | Tissue | Adj P-value | Log2FC | Malignancy |
| 5238 | PGM3 | LZE4T | Human | Esophagus | ESCC | 8.51e-09 | 2.41e-01 | 0.0811 |
| 5238 | PGM3 | LZE7T | Human | Esophagus | ESCC | 6.20e-04 | 3.00e-01 | 0.0667 |
| 5238 | PGM3 | LZE24T | Human | Esophagus | ESCC | 1.12e-11 | 2.63e-01 | 0.0596 |
| 5238 | PGM3 | LZE6T | Human | Esophagus | ESCC | 2.25e-02 | 1.05e-01 | 0.0845 |
| 5238 | PGM3 | P2T-E | Human | Esophagus | ESCC | 1.64e-25 | 3.95e-01 | 0.1177 |
| 5238 | PGM3 | P4T-E | Human | Esophagus | ESCC | 1.25e-18 | 4.57e-01 | 0.1323 |
| 5238 | PGM3 | P5T-E | Human | Esophagus | ESCC | 2.95e-09 | 2.06e-01 | 0.1327 |
| 5238 | PGM3 | P8T-E | Human | Esophagus | ESCC | 2.37e-09 | 2.18e-01 | 0.0889 |
| 5238 | PGM3 | P9T-E | Human | Esophagus | ESCC | 1.84e-07 | 2.89e-01 | 0.1131 |
| 5238 | PGM3 | P10T-E | Human | Esophagus | ESCC | 5.59e-18 | 3.80e-01 | 0.116 |
| 5238 | PGM3 | P11T-E | Human | Esophagus | ESCC | 2.28e-21 | 7.50e-01 | 0.1426 |
| 5238 | PGM3 | P12T-E | Human | Esophagus | ESCC | 2.37e-19 | 4.94e-01 | 0.1122 |
| 5238 | PGM3 | P15T-E | Human | Esophagus | ESCC | 1.58e-07 | 1.91e-01 | 0.1149 |
| 5238 | PGM3 | P16T-E | Human | Esophagus | ESCC | 2.89e-15 | 4.40e-01 | 0.1153 |
| 5238 | PGM3 | P17T-E | Human | Esophagus | ESCC | 2.15e-03 | 4.02e-01 | 0.1278 |
| 5238 | PGM3 | P19T-E | Human | Esophagus | ESCC | 5.89e-13 | 9.13e-01 | 0.1662 |
| 5238 | PGM3 | P20T-E | Human | Esophagus | ESCC | 7.65e-10 | 2.12e-01 | 0.1124 |
| 5238 | PGM3 | P21T-E | Human | Esophagus | ESCC | 7.23e-19 | 5.46e-01 | 0.1617 |
| 5238 | PGM3 | P22T-E | Human | Esophagus | ESCC | 2.45e-07 | 1.35e-01 | 0.1236 |
| 5238 | PGM3 | P23T-E | Human | Esophagus | ESCC | 1.70e-17 | 4.82e-01 | 0.108 |
| Page: 1 2 3 4 5 6 |
| Tissue | Expression Dynamics | Abbreviation |
| Esophagus | 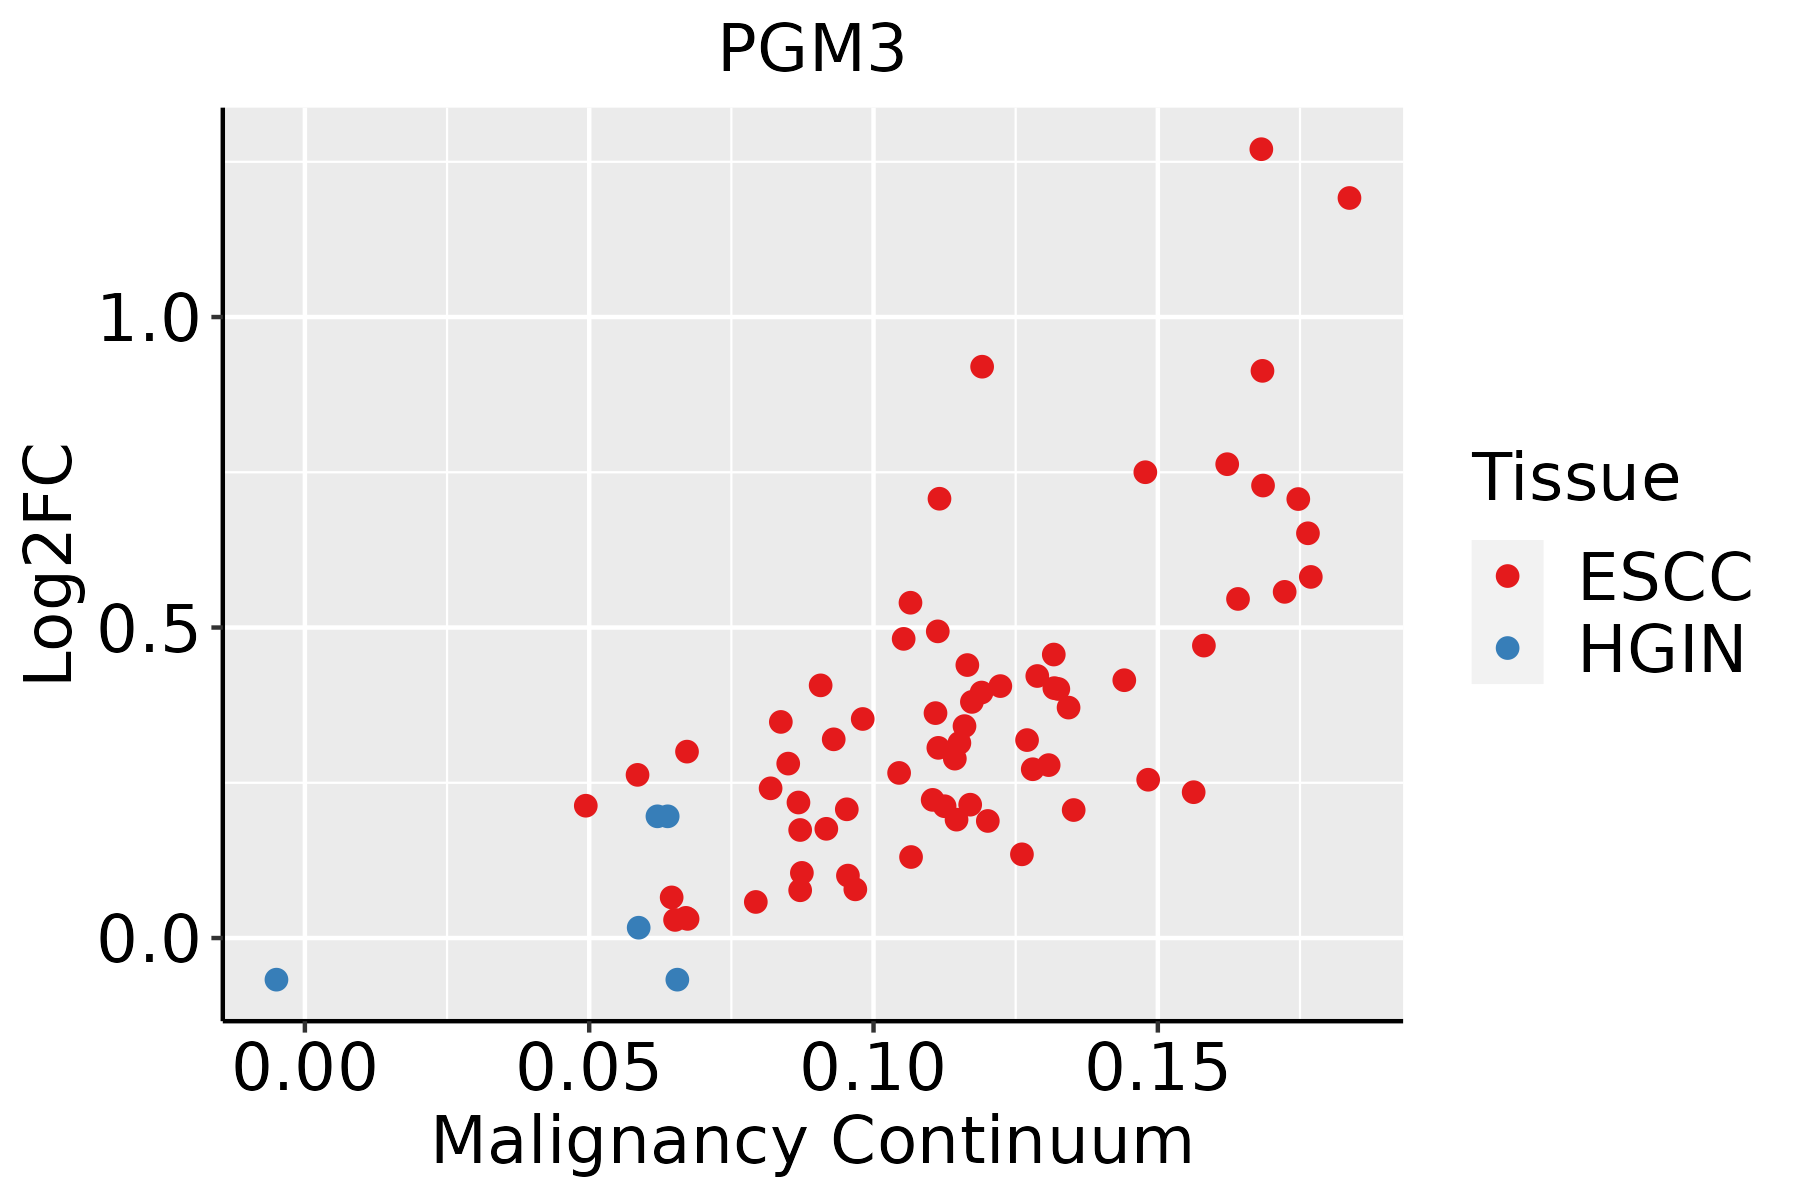 | ESCC: Esophageal squamous cell carcinoma |
| HGIN: High-grade intraepithelial neoplasias | ||
| LGIN: Low-grade intraepithelial neoplasias | ||
| Liver |  | HCC: Hepatocellular carcinoma |
| NAFLD: Non-alcoholic fatty liver disease | ||
| Oral Cavity | 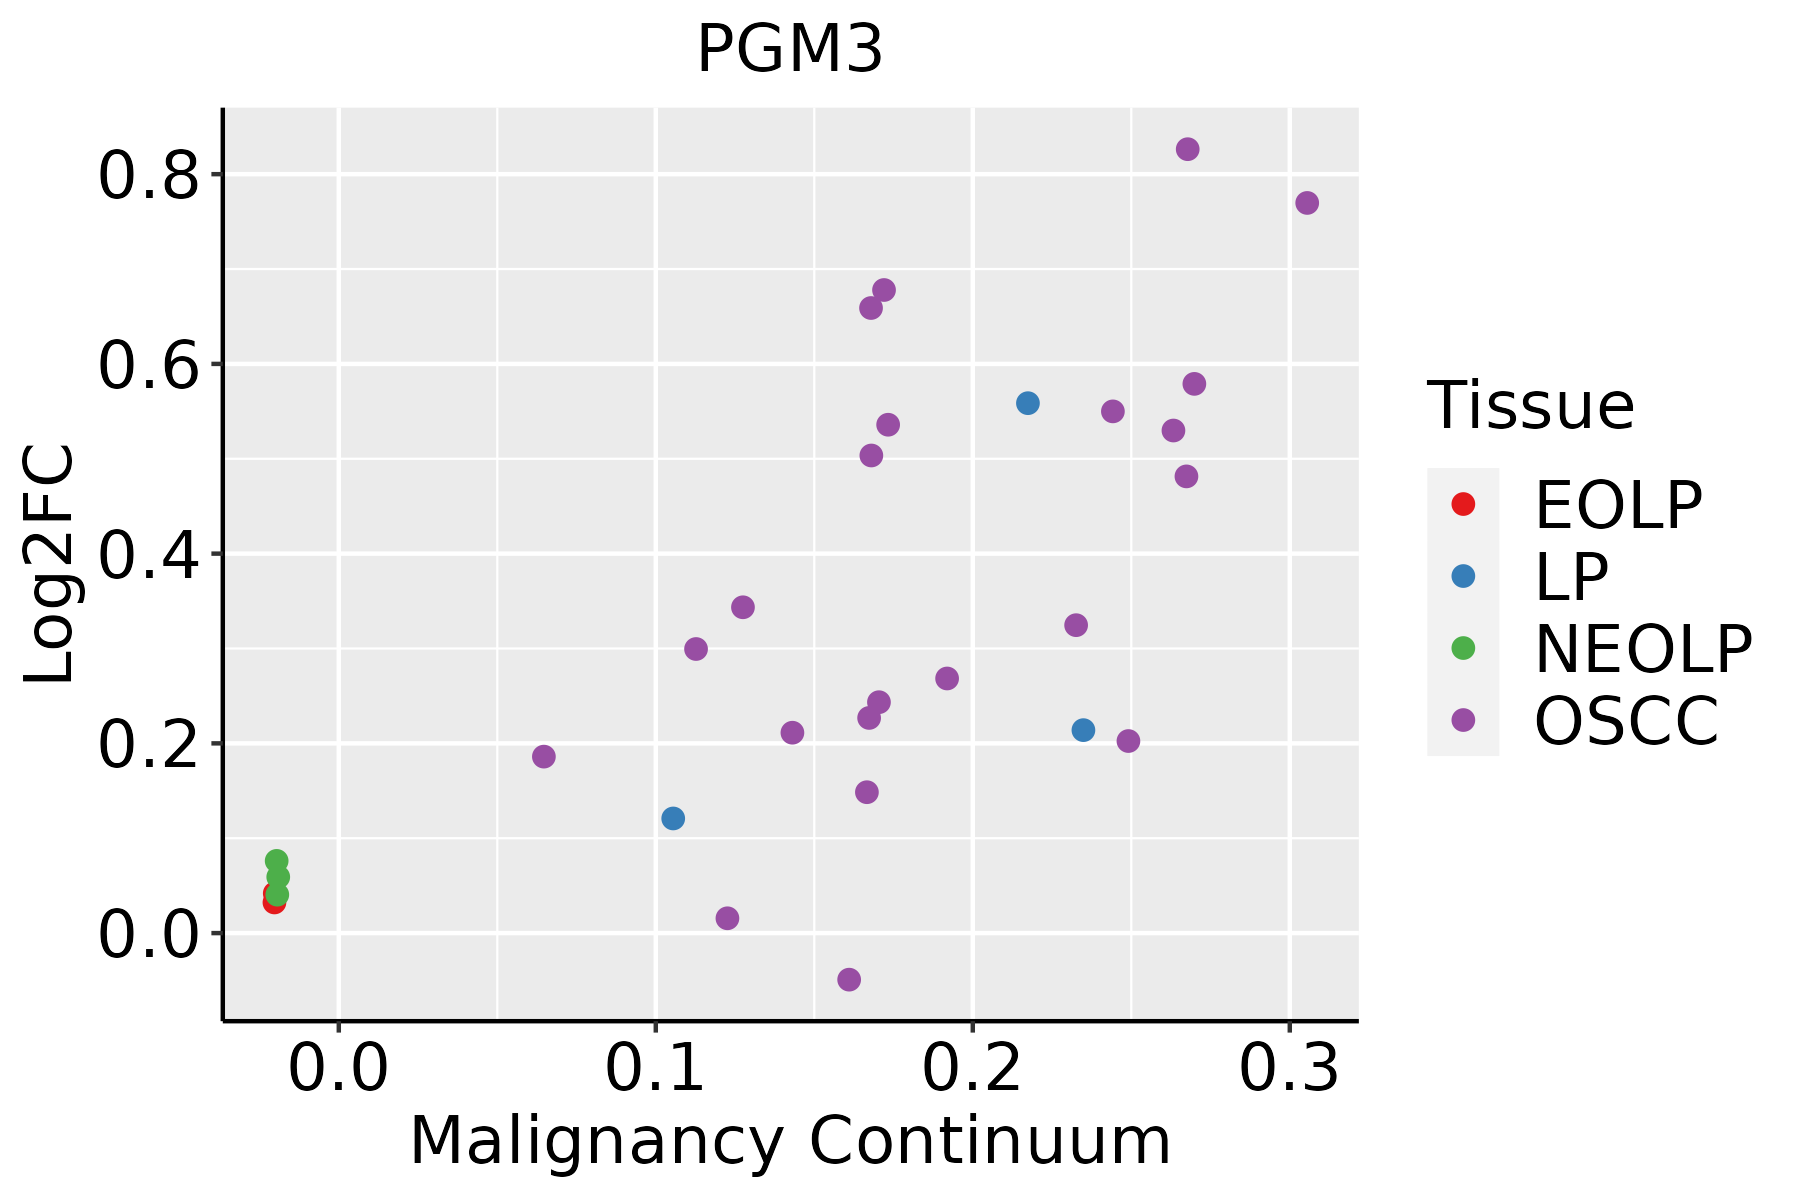 | EOLP: Erosive Oral lichen planus |
| LP: leukoplakia | ||
| NEOLP: Non-erosive oral lichen planus | ||
| OSCC: Oral squamous cell carcinoma | ||
| Prostate |  | BPH: Benign Prostatic Hyperplasia |
| Skin |  | AK: Actinic keratosis |
| cSCC: Cutaneous squamous cell carcinoma | ||
| SCCIS:squamous cell carcinoma in situ | ||
| Thyroid |  | ATC: Anaplastic thyroid cancer |
| HT: Hashimoto's thyroiditis | ||
| PTC: Papillary thyroid cancer |
| ∗log2FC in expression of this searched gene in stem-like cells from each diseased tissue sample relative to stem-like cells in normal samples in each tissue plotted against the malignancy continuum. Samples are colored based on if they are from different disease stage. |
Top |
Malignant transformation related pathway analysis |
| Find out the enriched GO biological processes and KEGG pathways involved in transition from healthy to precancer to cancer |
| Tissue | Disease Stage | Enriched GO biological Processes |
| Colorectum | AD |  |
| Colorectum | SER |  |
| Colorectum | MSS |  |
| Colorectum | MSI-H |  |
| Colorectum | FAP |  |
| ∗Top 15 enriched GO BP terms are showed in the bar plot of each disease state in each tissue. Each row represents a significant GO biological process which is colored according to the -log10(p.adjust). |
| Page: 1 2 3 4 5 6 7 8 9 |
| GO ID | Tissue | Disease Stage | Description | Gene Ratio | Bg Ratio | pvalue | p.adjust | Count |
| GO:000648714 | Esophagus | ESCC | protein N-linked glycosylation | 51/8552 | 65/18723 | 6.41e-08 | 1.13e-06 | 51 |
| GO:00091002 | Esophagus | ESCC | glycoprotein metabolic process | 226/8552 | 387/18723 | 2.64e-07 | 3.94e-06 | 226 |
| GO:00700854 | Esophagus | ESCC | glycosylation | 144/8552 | 240/18723 | 5.12e-06 | 5.38e-05 | 144 |
| GO:00064865 | Esophagus | ESCC | protein glycosylation | 135/8552 | 226/18723 | 1.36e-05 | 1.24e-04 | 135 |
| GO:00434135 | Esophagus | ESCC | macromolecule glycosylation | 135/8552 | 226/18723 | 1.36e-05 | 1.24e-04 | 135 |
| GO:00092256 | Esophagus | ESCC | nucleotide-sugar metabolic process | 29/8552 | 36/18723 | 1.91e-05 | 1.67e-04 | 29 |
| GO:00091012 | Esophagus | ESCC | glycoprotein biosynthetic process | 181/8552 | 317/18723 | 2.54e-05 | 2.15e-04 | 181 |
| GO:00064931 | Esophagus | ESCC | protein O-linked glycosylation | 51/8552 | 86/18723 | 7.54e-03 | 2.70e-02 | 51 |
| GO:00092262 | Esophagus | ESCC | nucleotide-sugar biosynthetic process | 14/8552 | 19/18723 | 1.27e-02 | 4.21e-02 | 14 |
| GO:000648711 | Liver | HCC | protein N-linked glycosylation | 48/7958 | 65/18723 | 2.85e-07 | 5.00e-06 | 48 |
| GO:00064862 | Liver | HCC | protein glycosylation | 122/7958 | 226/18723 | 3.11e-04 | 2.21e-03 | 122 |
| GO:00434132 | Liver | HCC | macromolecule glycosylation | 122/7958 | 226/18723 | 3.11e-04 | 2.21e-03 | 122 |
| GO:00700852 | Liver | HCC | glycosylation | 128/7958 | 240/18723 | 4.35e-04 | 2.92e-03 | 128 |
| GO:00092254 | Liver | HCC | nucleotide-sugar metabolic process | 25/7958 | 36/18723 | 9.87e-04 | 5.71e-03 | 25 |
| GO:0009100 | Liver | HCC | glycoprotein metabolic process | 193/7958 | 387/18723 | 1.89e-03 | 9.62e-03 | 193 |
| GO:00064875 | Oral cavity | OSCC | protein N-linked glycosylation | 44/7305 | 65/18723 | 2.63e-06 | 3.26e-05 | 44 |
| GO:00092255 | Oral cavity | OSCC | nucleotide-sugar metabolic process | 26/7305 | 36/18723 | 5.44e-05 | 4.51e-04 | 26 |
| GO:00091001 | Oral cavity | OSCC | glycoprotein metabolic process | 185/7305 | 387/18723 | 2.37e-04 | 1.54e-03 | 185 |
| GO:00091011 | Oral cavity | OSCC | glycoprotein biosynthetic process | 151/7305 | 317/18723 | 1.01e-03 | 5.26e-03 | 151 |
| GO:00064864 | Oral cavity | OSCC | protein glycosylation | 111/7305 | 226/18723 | 1.22e-03 | 6.10e-03 | 111 |
| Page: 1 2 3 |
| Pathway ID | Tissue | Disease Stage | Description | Gene Ratio | Bg Ratio | pvalue | p.adjust | qvalue | Count |
| hsa012505 | Esophagus | ESCC | Biosynthesis of nucleotide sugars | 28/4205 | 37/8465 | 1.10e-03 | 3.42e-03 | 1.75e-03 | 28 |
| hsa005202 | Esophagus | ESCC | Amino sugar and nucleotide sugar metabolism | 35/4205 | 49/8465 | 1.60e-03 | 4.88e-03 | 2.50e-03 | 35 |
| hsa0125012 | Esophagus | ESCC | Biosynthesis of nucleotide sugars | 28/4205 | 37/8465 | 1.10e-03 | 3.42e-03 | 1.75e-03 | 28 |
| hsa0052011 | Esophagus | ESCC | Amino sugar and nucleotide sugar metabolism | 35/4205 | 49/8465 | 1.60e-03 | 4.88e-03 | 2.50e-03 | 35 |
| hsa00520 | Oral cavity | OSCC | Amino sugar and nucleotide sugar metabolism | 34/3704 | 49/8465 | 2.48e-04 | 8.08e-04 | 4.11e-04 | 34 |
| hsa012504 | Oral cavity | OSCC | Biosynthesis of nucleotide sugars | 25/3704 | 37/8465 | 2.93e-03 | 7.49e-03 | 3.81e-03 | 25 |
| hsa005201 | Oral cavity | OSCC | Amino sugar and nucleotide sugar metabolism | 34/3704 | 49/8465 | 2.48e-04 | 8.08e-04 | 4.11e-04 | 34 |
| hsa0125011 | Oral cavity | OSCC | Biosynthesis of nucleotide sugars | 25/3704 | 37/8465 | 2.93e-03 | 7.49e-03 | 3.81e-03 | 25 |
| Page: 1 |
Top |
Cell-cell communication analysis |
| Identification of potential cell-cell interactions between two cell types and their ligand-receptor pairs for different disease states |
| Ligand | Receptor | LRpair | Pathway | Tissue | Disease Stage |
| Page: 1 |
Top |
Single-cell gene regulatory network inference analysis |
| Find out the significant the regulons (TFs) and the target genes of each regulon across cell types for different disease states |
| TF | Cell Type | Tissue | Disease Stage | Target Gene | RSS | Regulon Activity |
| ∗The dot plots of a searched regulon are shown for all cell subpopulations in each disease state of each tissue based on the regulon specific score inferred using pySCENIC and by calculating the average expression. |
| Page: 1 |
Top |
Somatic mutation of malignant transformation related genes |
| Annotation of somatic variants for genes involved in malignant transformation |
| Hugo Symbol | Variant Class | Variant Classification | dbSNP RS | HGVSc | HGVSp | HGVSp Short | SWISSPROT | BIOTYPE | SIFT | PolyPhen | Tumor Sample Barcode | Tissue | Histology | Sex | Age | Stage | Therapy Types | Drugs | Outcome |
| PGM3 | SNV | Missense_Mutation | c.497A>C | p.Gln166Pro | p.Q166P | O95394 | protein_coding | deleterious(0.04) | possibly_damaging(0.832) | TCGA-AR-A0TX-01 | Breast | breast invasive carcinoma | Female | <65 | I/II | Unknown | Unknown | SD | |
| PGM3 | SNV | Missense_Mutation | c.421N>C | p.Glu141Gln | p.E141Q | O95394 | protein_coding | tolerated(0.32) | benign(0.071) | TCGA-D8-A27G-01 | Breast | breast invasive carcinoma | Female | >=65 | I/II | Unknown | Unknown | SD | |
| PGM3 | insertion | Frame_Shift_Ins | novel | c.398_399insTCAGATACCA | p.Leu134GlnfsTer6 | p.L134Qfs*6 | O95394 | protein_coding | TCGA-AQ-A04J-01 | Breast | breast invasive carcinoma | Female | <65 | I/II | Chemotherapy | cytoxan | SD | ||
| PGM3 | SNV | Missense_Mutation | c.385N>A | p.Asp129Asn | p.D129N | O95394 | protein_coding | tolerated(0.11) | benign(0.076) | TCGA-EA-A50E-01 | Cervix | cervical & endocervical cancer | Female | <65 | I/II | Unknown | Unknown | PD | |
| PGM3 | SNV | Missense_Mutation | novel | c.1531N>T | p.Asp511Tyr | p.D511Y | O95394 | protein_coding | deleterious(0.01) | possibly_damaging(0.544) | TCGA-AA-3984-01 | Colorectum | colon adenocarcinoma | Female | <65 | I/II | Unknown | Unknown | SD |
| PGM3 | SNV | Missense_Mutation | novel | c.872N>A | p.Gly291Glu | p.G291E | O95394 | protein_coding | deleterious(0) | probably_damaging(0.976) | TCGA-AA-3984-01 | Colorectum | colon adenocarcinoma | Female | <65 | I/II | Unknown | Unknown | SD |
| PGM3 | SNV | Missense_Mutation | c.244N>C | p.Lys82Gln | p.K82Q | O95394 | protein_coding | tolerated(0.33) | benign(0.044) | TCGA-AA-A010-01 | Colorectum | colon adenocarcinoma | Female | <65 | I/II | Chemotherapy | folinic | CR | |
| PGM3 | SNV | Missense_Mutation | c.583N>C | p.Tyr195His | p.Y195H | O95394 | protein_coding | tolerated(0.52) | possibly_damaging(0.663) | TCGA-CK-5916-01 | Colorectum | colon adenocarcinoma | Female | >=65 | I/II | Unknown | Unknown | PD | |
| PGM3 | SNV | Missense_Mutation | c.1676C>A | p.Ala559Asp | p.A559D | O95394 | protein_coding | deleterious(0) | probably_damaging(1) | TCGA-AG-A014-01 | Colorectum | rectum adenocarcinoma | Male | >=65 | I/II | Unknown | Unknown | SD | |
| PGM3 | SNV | Missense_Mutation | c.431N>G | p.Asn144Ser | p.N144S | O95394 | protein_coding | tolerated(0.09) | benign(0.011) | TCGA-AG-A02N-01 | Colorectum | rectum adenocarcinoma | Male | >=65 | I/II | Chemotherapy | folinic | CR |
| Page: 1 2 3 4 5 6 |
Top |
Related drugs of malignant transformation related genes |
| Identification of chemicals and drugs interact with genes involved in malignant transfromation |
| (DGIdb 4.0) |
| Entrez ID | Symbol | Category | Interaction Types | Drug Claim Name | Drug Name | PMIDs |
| Page: 1 |

Copyright 2023-Present -The University of Texas Health Science Center at Houston |