
|
|||||
|
 | |
| |
| |
| |
| |
| |
|
Gene: PGM2L1 |
Gene summary for PGM2L1 |
| Gene information | Species | Human | Gene symbol | PGM2L1 | Gene ID | 283209 |
| Gene name | phosphoglucomutase 2 like 1 | |
| Gene Alias | BM32A | |
| Cytomap | 11q13.4 | |
| Gene Type | protein-coding | GO ID | GO:0005975 | UniProtAcc | Q6PCE3 |
Top |
Malignant transformation analysis |
| Identification of the aberrant gene expression in precancerous and cancerous lesions by comparing the gene expression of stem-like cells in diseased tissues with normal stem cells |
| Entrez ID | Symbol | Replicates | Species | Organ | Tissue | Adj P-value | Log2FC | Malignancy |
| 283209 | PGM2L1 | LZE2D | Human | Esophagus | HGIN | 5.67e-03 | 2.81e-01 | 0.0642 |
| 283209 | PGM2L1 | LZE4T | Human | Esophagus | ESCC | 1.44e-20 | 7.77e-01 | 0.0811 |
| 283209 | PGM2L1 | LZE5T | Human | Esophagus | ESCC | 2.33e-04 | 8.50e-01 | 0.0514 |
| 283209 | PGM2L1 | LZE7T | Human | Esophagus | ESCC | 9.23e-04 | 2.70e-01 | 0.0667 |
| 283209 | PGM2L1 | LZE8T | Human | Esophagus | ESCC | 7.32e-10 | 3.74e-01 | 0.067 |
| 283209 | PGM2L1 | LZE20T | Human | Esophagus | ESCC | 5.33e-05 | 3.76e-01 | 0.0662 |
| 283209 | PGM2L1 | LZE22T | Human | Esophagus | ESCC | 2.24e-16 | 1.30e+00 | 0.068 |
| 283209 | PGM2L1 | LZE24T | Human | Esophagus | ESCC | 5.15e-12 | 4.85e-01 | 0.0596 |
| 283209 | PGM2L1 | LZE22D3 | Human | Esophagus | HGIN | 4.22e-04 | 9.03e-01 | 0.0653 |
| 283209 | PGM2L1 | LZE6T | Human | Esophagus | ESCC | 2.76e-03 | 1.07e-01 | 0.0845 |
| 283209 | PGM2L1 | P1T-E | Human | Esophagus | ESCC | 5.17e-10 | 2.51e-01 | 0.0875 |
| 283209 | PGM2L1 | P2T-E | Human | Esophagus | ESCC | 4.78e-71 | 1.80e+00 | 0.1177 |
| 283209 | PGM2L1 | P4T-E | Human | Esophagus | ESCC | 2.76e-27 | 8.61e-01 | 0.1323 |
| 283209 | PGM2L1 | P5T-E | Human | Esophagus | ESCC | 5.63e-36 | 8.41e-01 | 0.1327 |
| 283209 | PGM2L1 | P8T-E | Human | Esophagus | ESCC | 1.87e-49 | 1.23e+00 | 0.0889 |
| 283209 | PGM2L1 | P9T-E | Human | Esophagus | ESCC | 3.57e-18 | 5.73e-01 | 0.1131 |
| 283209 | PGM2L1 | P10T-E | Human | Esophagus | ESCC | 1.75e-09 | 2.53e-01 | 0.116 |
| 283209 | PGM2L1 | P11T-E | Human | Esophagus | ESCC | 3.78e-41 | 1.84e+00 | 0.1426 |
| 283209 | PGM2L1 | P12T-E | Human | Esophagus | ESCC | 4.44e-64 | 1.30e+00 | 0.1122 |
| 283209 | PGM2L1 | P15T-E | Human | Esophagus | ESCC | 1.37e-06 | 2.99e-01 | 0.1149 |
| Page: 1 2 3 4 5 6 |
| Tissue | Expression Dynamics | Abbreviation |
| Esophagus |  | ESCC: Esophageal squamous cell carcinoma |
| HGIN: High-grade intraepithelial neoplasias | ||
| LGIN: Low-grade intraepithelial neoplasias | ||
| Liver | 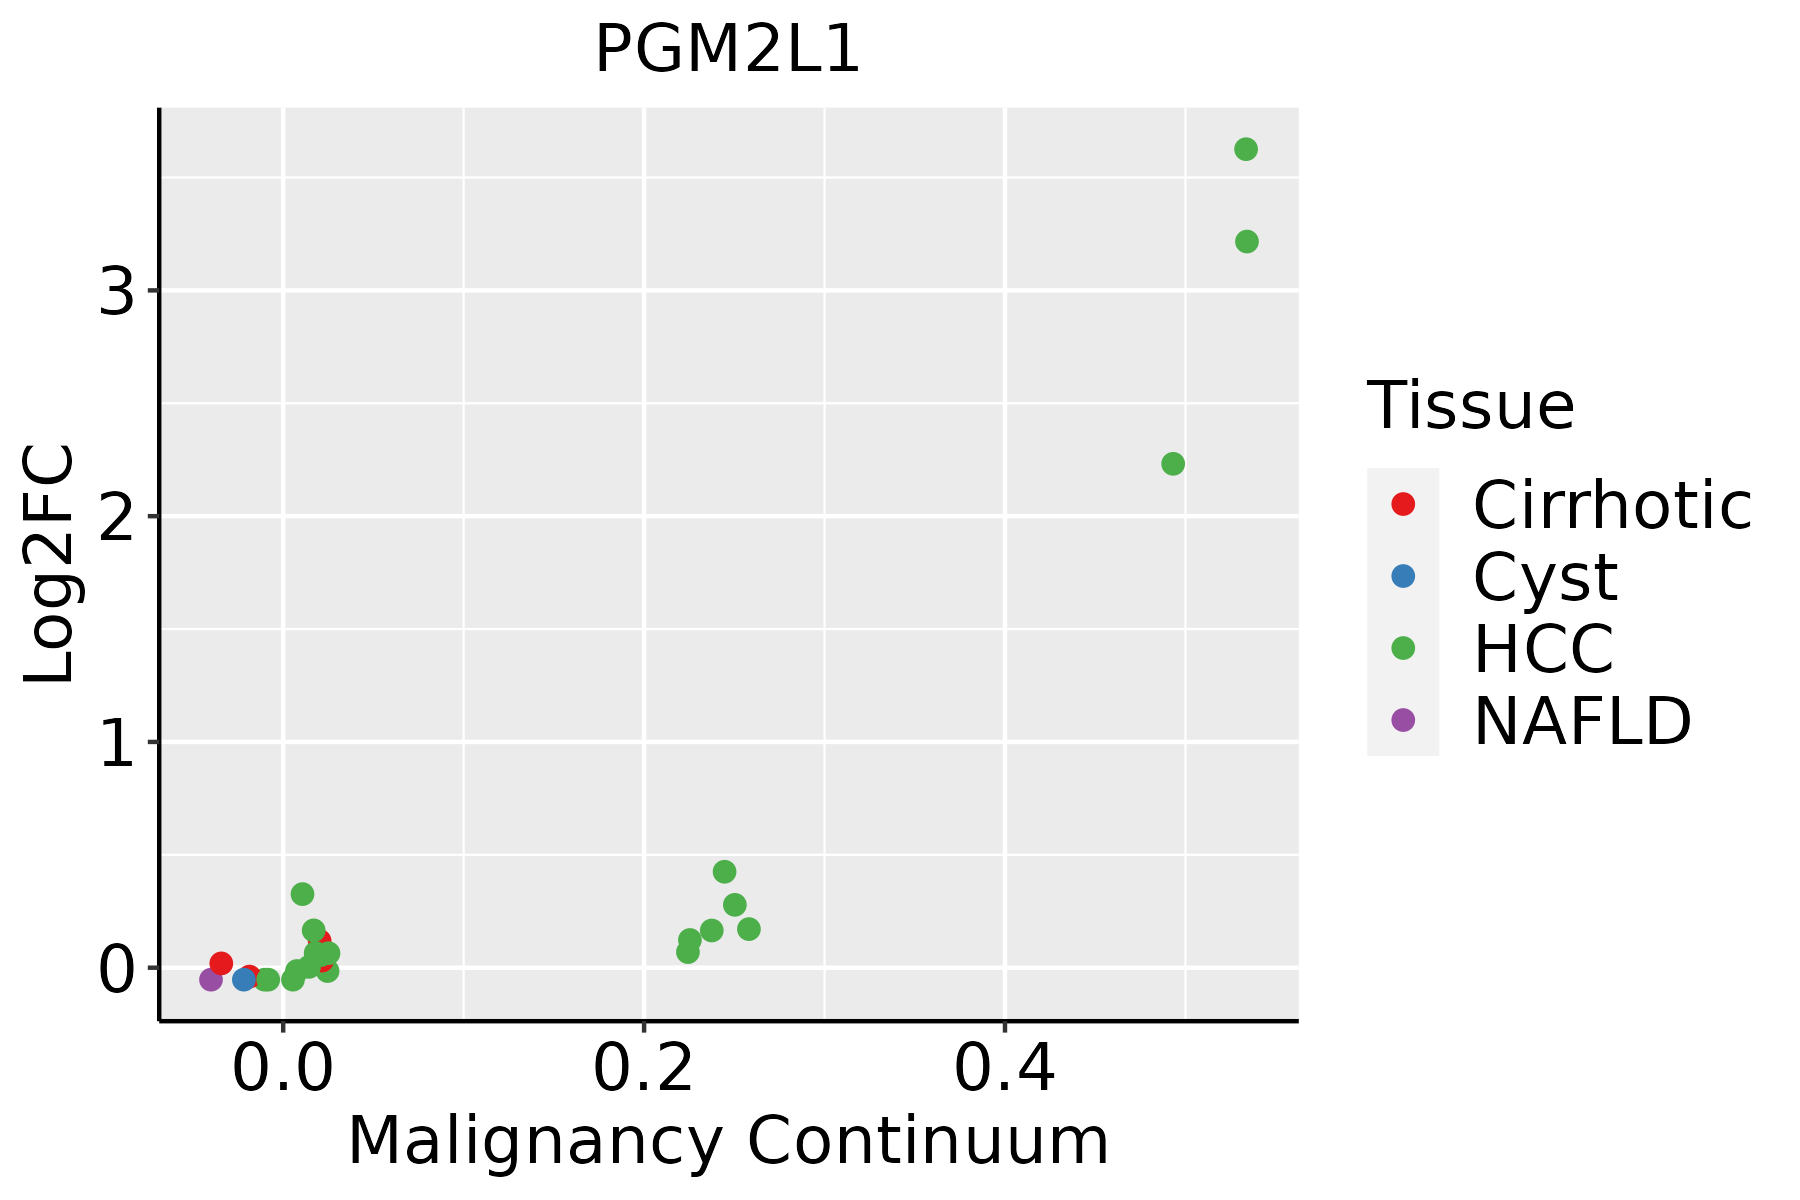 | HCC: Hepatocellular carcinoma |
| NAFLD: Non-alcoholic fatty liver disease | ||
| Lung | 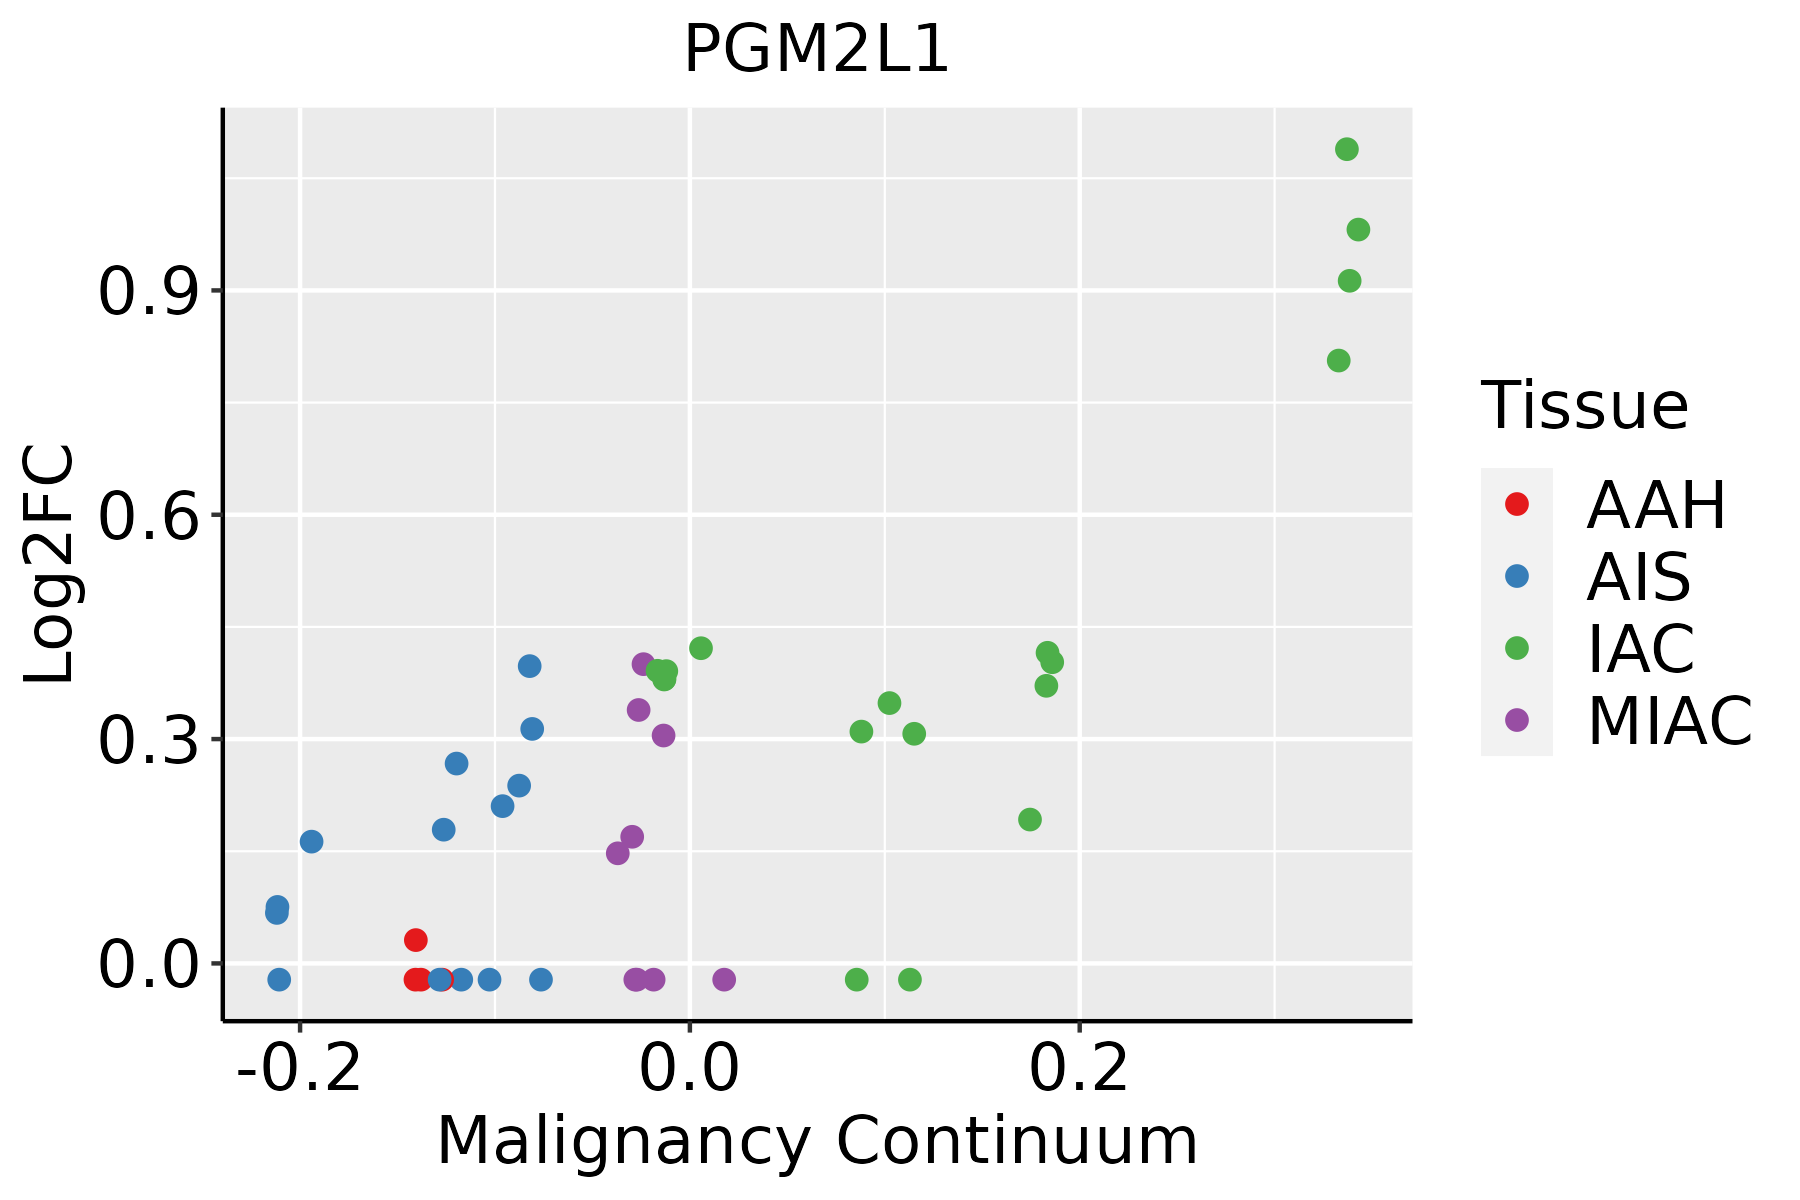 | AAH: Atypical adenomatous hyperplasia |
| AIS: Adenocarcinoma in situ | ||
| IAC: Invasive lung adenocarcinoma | ||
| MIA: Minimally invasive adenocarcinoma | ||
| Oral Cavity | 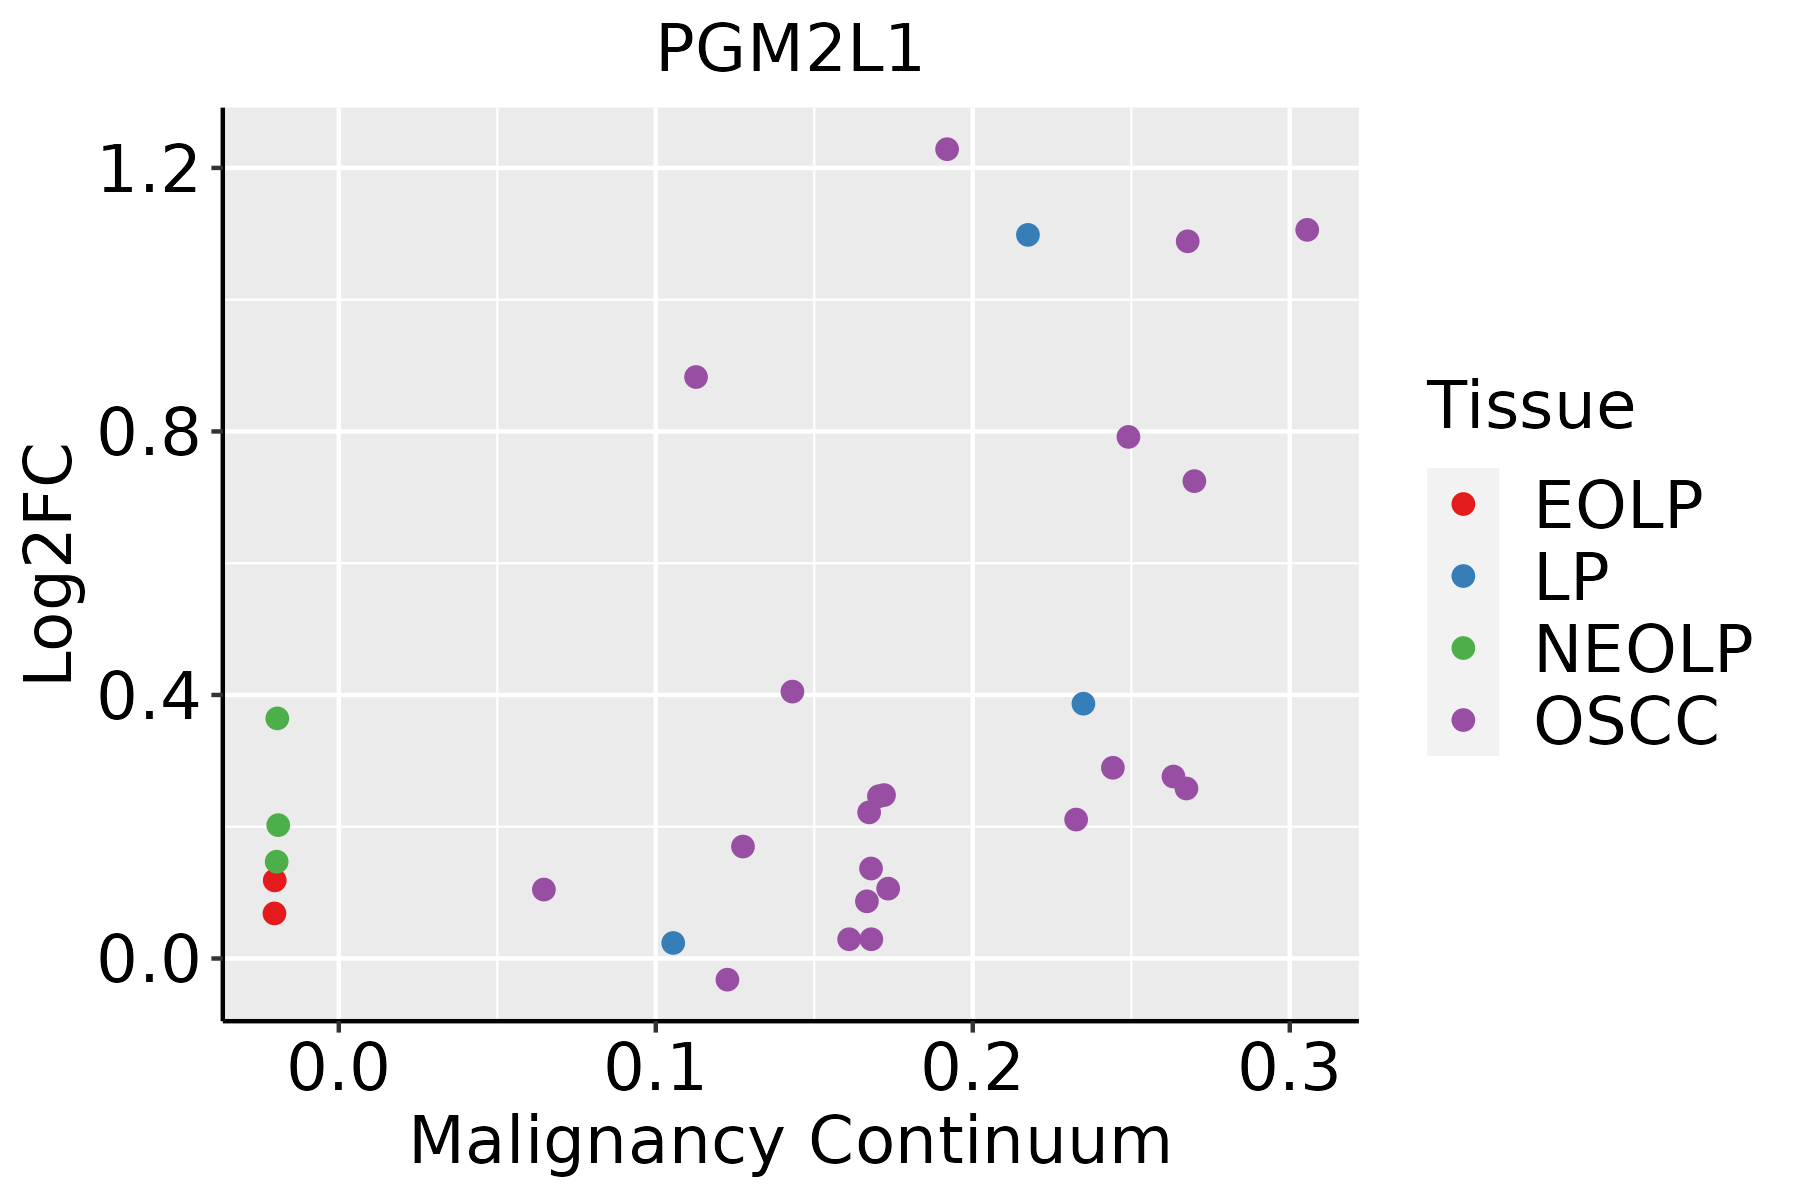 | EOLP: Erosive Oral lichen planus |
| LP: leukoplakia | ||
| NEOLP: Non-erosive oral lichen planus | ||
| OSCC: Oral squamous cell carcinoma | ||
| Prostate | 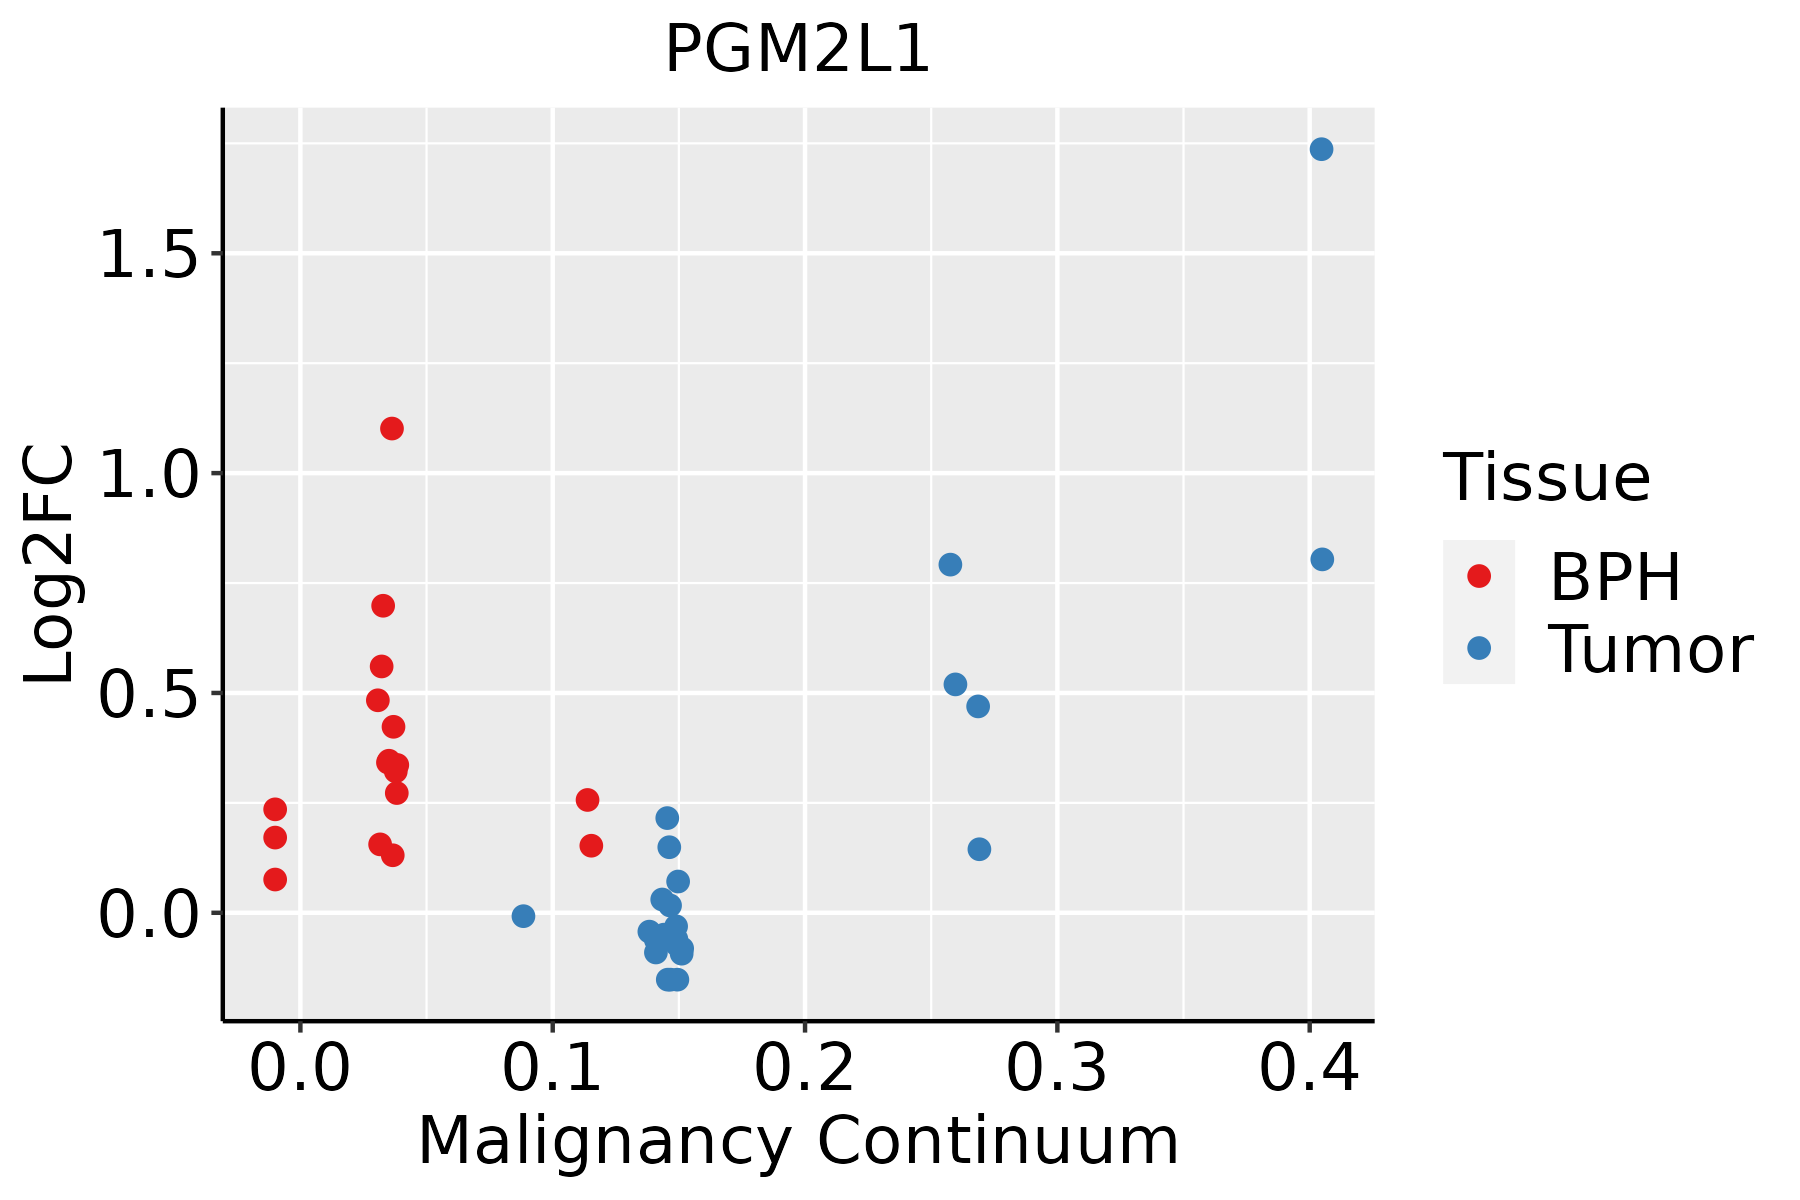 | BPH: Benign Prostatic Hyperplasia |
| Thyroid | 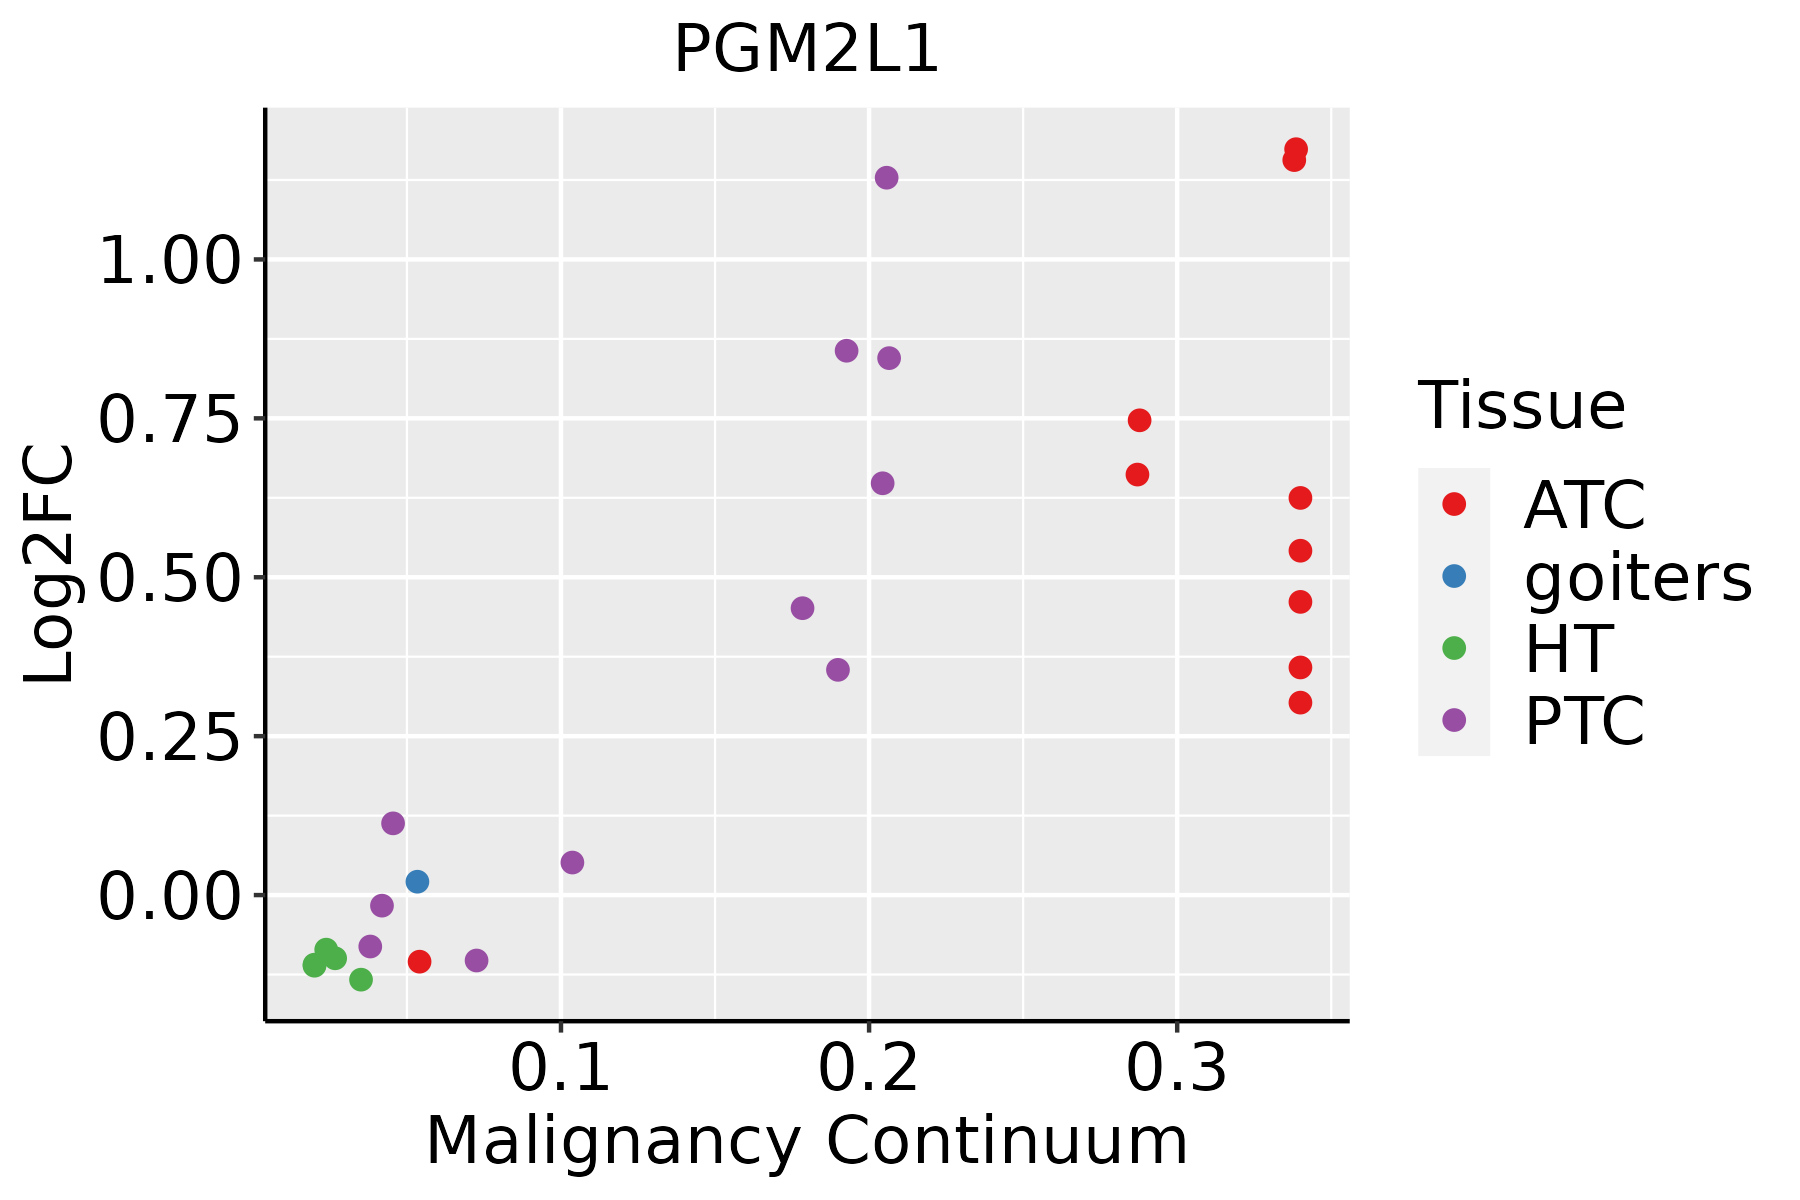 | ATC: Anaplastic thyroid cancer |
| HT: Hashimoto's thyroiditis | ||
| PTC: Papillary thyroid cancer |
| ∗log2FC in expression of this searched gene in stem-like cells from each diseased tissue sample relative to stem-like cells in normal samples in each tissue plotted against the malignancy continuum. Samples are colored based on if they are from different disease stage. |
Top |
Malignant transformation related pathway analysis |
| Find out the enriched GO biological processes and KEGG pathways involved in transition from healthy to precancer to cancer |
| Tissue | Disease Stage | Enriched GO biological Processes |
| Colorectum | AD |  |
| Colorectum | SER |  |
| Colorectum | MSS |  |
| Colorectum | MSI-H |  |
| Colorectum | FAP |  |
| ∗Top 15 enriched GO BP terms are showed in the bar plot of each disease state in each tissue. Each row represents a significant GO biological process which is colored according to the -log10(p.adjust). |
| Page: 1 2 3 4 5 6 7 8 9 |
| GO ID | Tissue | Disease Stage | Description | Gene Ratio | Bg Ratio | pvalue | p.adjust | Count |
| GO:00059969 | Esophagus | ESCC | monosaccharide metabolic process | 159/8552 | 257/18723 | 1.11e-07 | 1.81e-06 | 159 |
| GO:00193189 | Esophagus | ESCC | hexose metabolic process | 147/8552 | 237/18723 | 2.63e-07 | 3.94e-06 | 147 |
| GO:00060069 | Esophagus | ESCC | glucose metabolic process | 119/8552 | 196/18723 | 1.51e-05 | 1.36e-04 | 119 |
| GO:000599621 | Liver | HCC | monosaccharide metabolic process | 167/7958 | 257/18723 | 2.31e-13 | 1.25e-11 | 167 |
| GO:001931821 | Liver | HCC | hexose metabolic process | 155/7958 | 237/18723 | 7.63e-13 | 3.90e-11 | 155 |
| GO:000600621 | Liver | HCC | glucose metabolic process | 128/7958 | 196/18723 | 8.60e-11 | 3.06e-09 | 128 |
| GO:00059968 | Oral cavity | OSCC | monosaccharide metabolic process | 129/7305 | 257/18723 | 1.63e-04 | 1.13e-03 | 129 |
| GO:00193188 | Oral cavity | OSCC | hexose metabolic process | 118/7305 | 237/18723 | 4.53e-04 | 2.73e-03 | 118 |
| GO:00060068 | Oral cavity | OSCC | glucose metabolic process | 98/7305 | 196/18723 | 1.10e-03 | 5.63e-03 | 98 |
| GO:000599613 | Oral cavity | LP | monosaccharide metabolic process | 86/4623 | 257/18723 | 9.13e-04 | 7.79e-03 | 86 |
| GO:001931813 | Oral cavity | LP | hexose metabolic process | 78/4623 | 237/18723 | 2.55e-03 | 1.80e-02 | 78 |
| GO:000600614 | Oral cavity | LP | glucose metabolic process | 64/4623 | 196/18723 | 7.09e-03 | 3.98e-02 | 64 |
| GO:00060067 | Prostate | BPH | glucose metabolic process | 49/3107 | 196/18723 | 1.65e-03 | 9.55e-03 | 49 |
| GO:000600613 | Prostate | Tumor | glucose metabolic process | 55/3246 | 196/18723 | 1.22e-04 | 1.14e-03 | 55 |
| GO:00193187 | Prostate | Tumor | hexose metabolic process | 59/3246 | 237/18723 | 1.96e-03 | 1.14e-02 | 59 |
| GO:00059967 | Prostate | Tumor | monosaccharide metabolic process | 62/3246 | 257/18723 | 3.38e-03 | 1.75e-02 | 62 |
| GO:001931810 | Thyroid | PTC | hexose metabolic process | 108/5968 | 237/18723 | 6.42e-06 | 7.65e-05 | 108 |
| GO:000599614 | Thyroid | PTC | monosaccharide metabolic process | 115/5968 | 257/18723 | 9.36e-06 | 1.05e-04 | 115 |
| GO:000600615 | Thyroid | PTC | glucose metabolic process | 90/5968 | 196/18723 | 2.54e-05 | 2.50e-04 | 90 |
| GO:001931814 | Thyroid | ATC | hexose metabolic process | 111/6293 | 237/18723 | 1.51e-05 | 1.41e-04 | 111 |
| Page: 1 2 |
| Pathway ID | Tissue | Disease Stage | Description | Gene Ratio | Bg Ratio | pvalue | p.adjust | qvalue | Count |
| Page: 1 |
Top |
Cell-cell communication analysis |
| Identification of potential cell-cell interactions between two cell types and their ligand-receptor pairs for different disease states |
| Ligand | Receptor | LRpair | Pathway | Tissue | Disease Stage |
| Page: 1 |
Top |
Single-cell gene regulatory network inference analysis |
| Find out the significant the regulons (TFs) and the target genes of each regulon across cell types for different disease states |
| TF | Cell Type | Tissue | Disease Stage | Target Gene | RSS | Regulon Activity |
| ∗The dot plots of a searched regulon are shown for all cell subpopulations in each disease state of each tissue based on the regulon specific score inferred using pySCENIC and by calculating the average expression. |
| Page: 1 |
Top |
Somatic mutation of malignant transformation related genes |
| Annotation of somatic variants for genes involved in malignant transformation |
| Hugo Symbol | Variant Class | Variant Classification | dbSNP RS | HGVSc | HGVSp | HGVSp Short | SWISSPROT | BIOTYPE | SIFT | PolyPhen | Tumor Sample Barcode | Tissue | Histology | Sex | Age | Stage | Therapy Types | Drugs | Outcome |
| PGM2L1 | SNV | Missense_Mutation | c.784N>A | p.His262Asn | p.H262N | Q6PCE3 | protein_coding | deleterious(0.01) | probably_damaging(0.953) | TCGA-B6-A0X1-01 | Breast | breast invasive carcinoma | Female | <65 | I/II | Unknown | Unknown | PD | |
| PGM2L1 | SNV | Missense_Mutation | novel | c.884N>G | p.Asp295Gly | p.D295G | Q6PCE3 | protein_coding | deleterious(0) | probably_damaging(0.967) | TCGA-E9-A3QA-01 | Breast | breast invasive carcinoma | Female | <65 | I/II | Unknown | Unknown | SD |
| PGM2L1 | SNV | Missense_Mutation | c.184T>C | p.Cys62Arg | p.C62R | Q6PCE3 | protein_coding | tolerated(0.21) | benign(0.157) | TCGA-UC-A7PF-01 | Cervix | cervical & endocervical cancer | Female | <65 | I/II | Unknown | Unknown | SD | |
| PGM2L1 | SNV | Missense_Mutation | c.260C>T | p.Thr87Ile | p.T87I | Q6PCE3 | protein_coding | deleterious(0.03) | possibly_damaging(0.759) | TCGA-AA-3819-01 | Colorectum | colon adenocarcinoma | Female | <65 | I/II | Unknown | Unknown | SD | |
| PGM2L1 | SNV | Missense_Mutation | c.1643T>C | p.Val548Ala | p.V548A | Q6PCE3 | protein_coding | tolerated(0.1) | benign(0.062) | TCGA-CA-6718-01 | Colorectum | colon adenocarcinoma | Male | <65 | I/II | Unknown | Unknown | PD | |
| PGM2L1 | SNV | Missense_Mutation | rs143893022 | c.1113A>C | p.Lys371Asn | p.K371N | Q6PCE3 | protein_coding | tolerated(0.33) | benign(0.024) | TCGA-CA-6718-01 | Colorectum | colon adenocarcinoma | Male | <65 | I/II | Unknown | Unknown | PD |
| PGM2L1 | SNV | Missense_Mutation | rs779736186 | c.1751N>T | p.Ala584Val | p.A584V | Q6PCE3 | protein_coding | deleterious(0.03) | benign(0.187) | TCGA-NH-A50V-01 | Colorectum | colon adenocarcinoma | Male | >=65 | III/IV | Chemotherapy | fluorouracil | CR |
| PGM2L1 | SNV | Missense_Mutation | novel | c.1176N>C | p.Lys392Asn | p.K392N | Q6PCE3 | protein_coding | deleterious(0) | benign(0.378) | TCGA-AG-A002-01 | Colorectum | rectum adenocarcinoma | Male | <65 | I/II | Unknown | Unknown | SD |
| PGM2L1 | SNV | Missense_Mutation | rs758479464 | c.850N>T | p.Pro284Ser | p.P284S | Q6PCE3 | protein_coding | deleterious(0.05) | benign(0.261) | TCGA-EI-6882-01 | Colorectum | rectum adenocarcinoma | Male | <65 | I/II | Unknown | Unknown | SD |
| PGM2L1 | deletion | Frame_Shift_Del | c.895delN | p.Ser299LeufsTer19 | p.S299Lfs*19 | Q6PCE3 | protein_coding | TCGA-AU-6004-01 | Colorectum | colon adenocarcinoma | Female | >=65 | I/II | Unknown | Unknown | SD |
| Page: 1 2 3 4 5 6 |
Top |
Related drugs of malignant transformation related genes |
| Identification of chemicals and drugs interact with genes involved in malignant transfromation |
| (DGIdb 4.0) |
| Entrez ID | Symbol | Category | Interaction Types | Drug Claim Name | Drug Name | PMIDs |
| Page: 1 |

Copyright 2023-Present -The University of Texas Health Science Center at Houston |