| Tissue | Expression Dynamics | Abbreviation |
| Colorectum (GSE201348) |  | FAP: Familial adenomatous polyposis |
| CRC: Colorectal cancer |
| Colorectum (HTA11) | 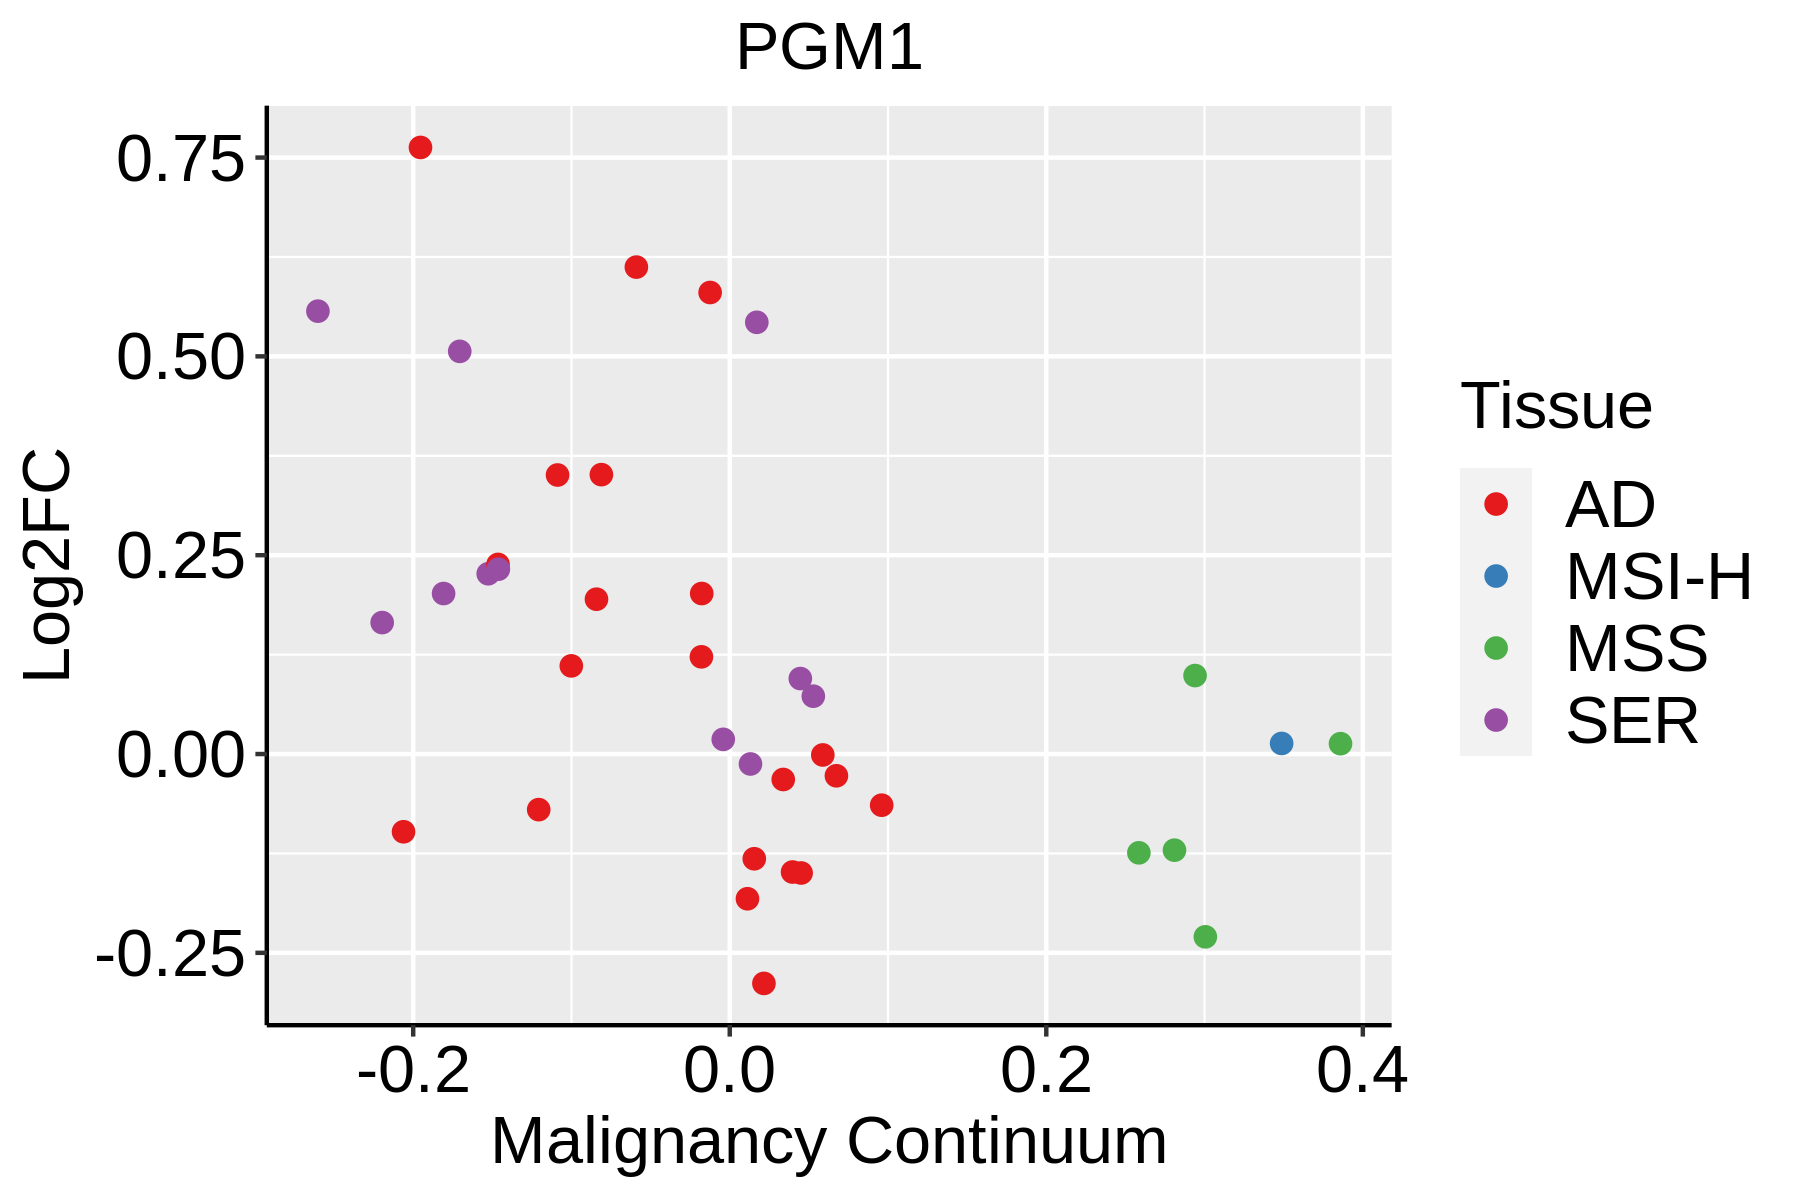 | AD: Adenomas |
| SER: Sessile serrated lesions |
| MSI-H: Microsatellite-high colorectal cancer |
| MSS: Microsatellite stable colorectal cancer |
| Esophagus | 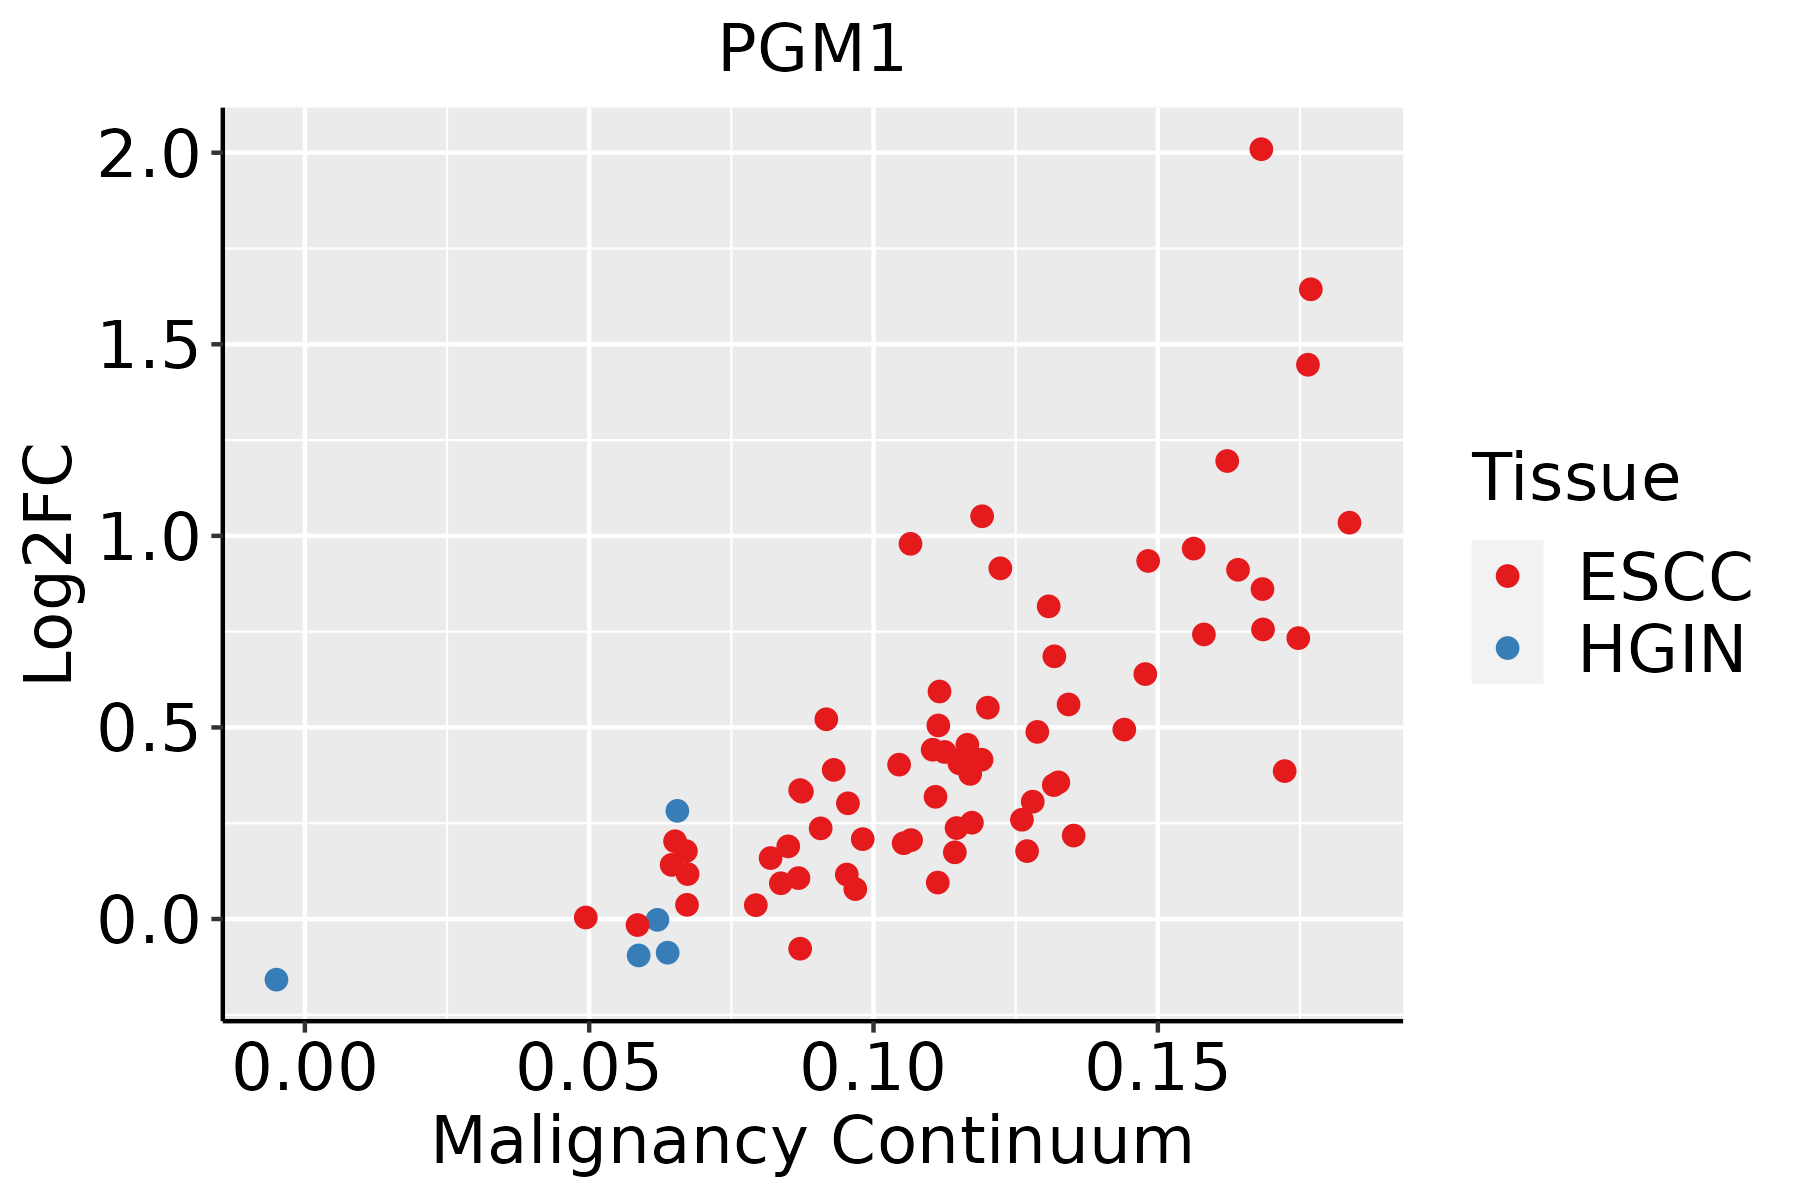 | ESCC: Esophageal squamous cell carcinoma |
| HGIN: High-grade intraepithelial neoplasias |
| LGIN: Low-grade intraepithelial neoplasias |
| Liver | 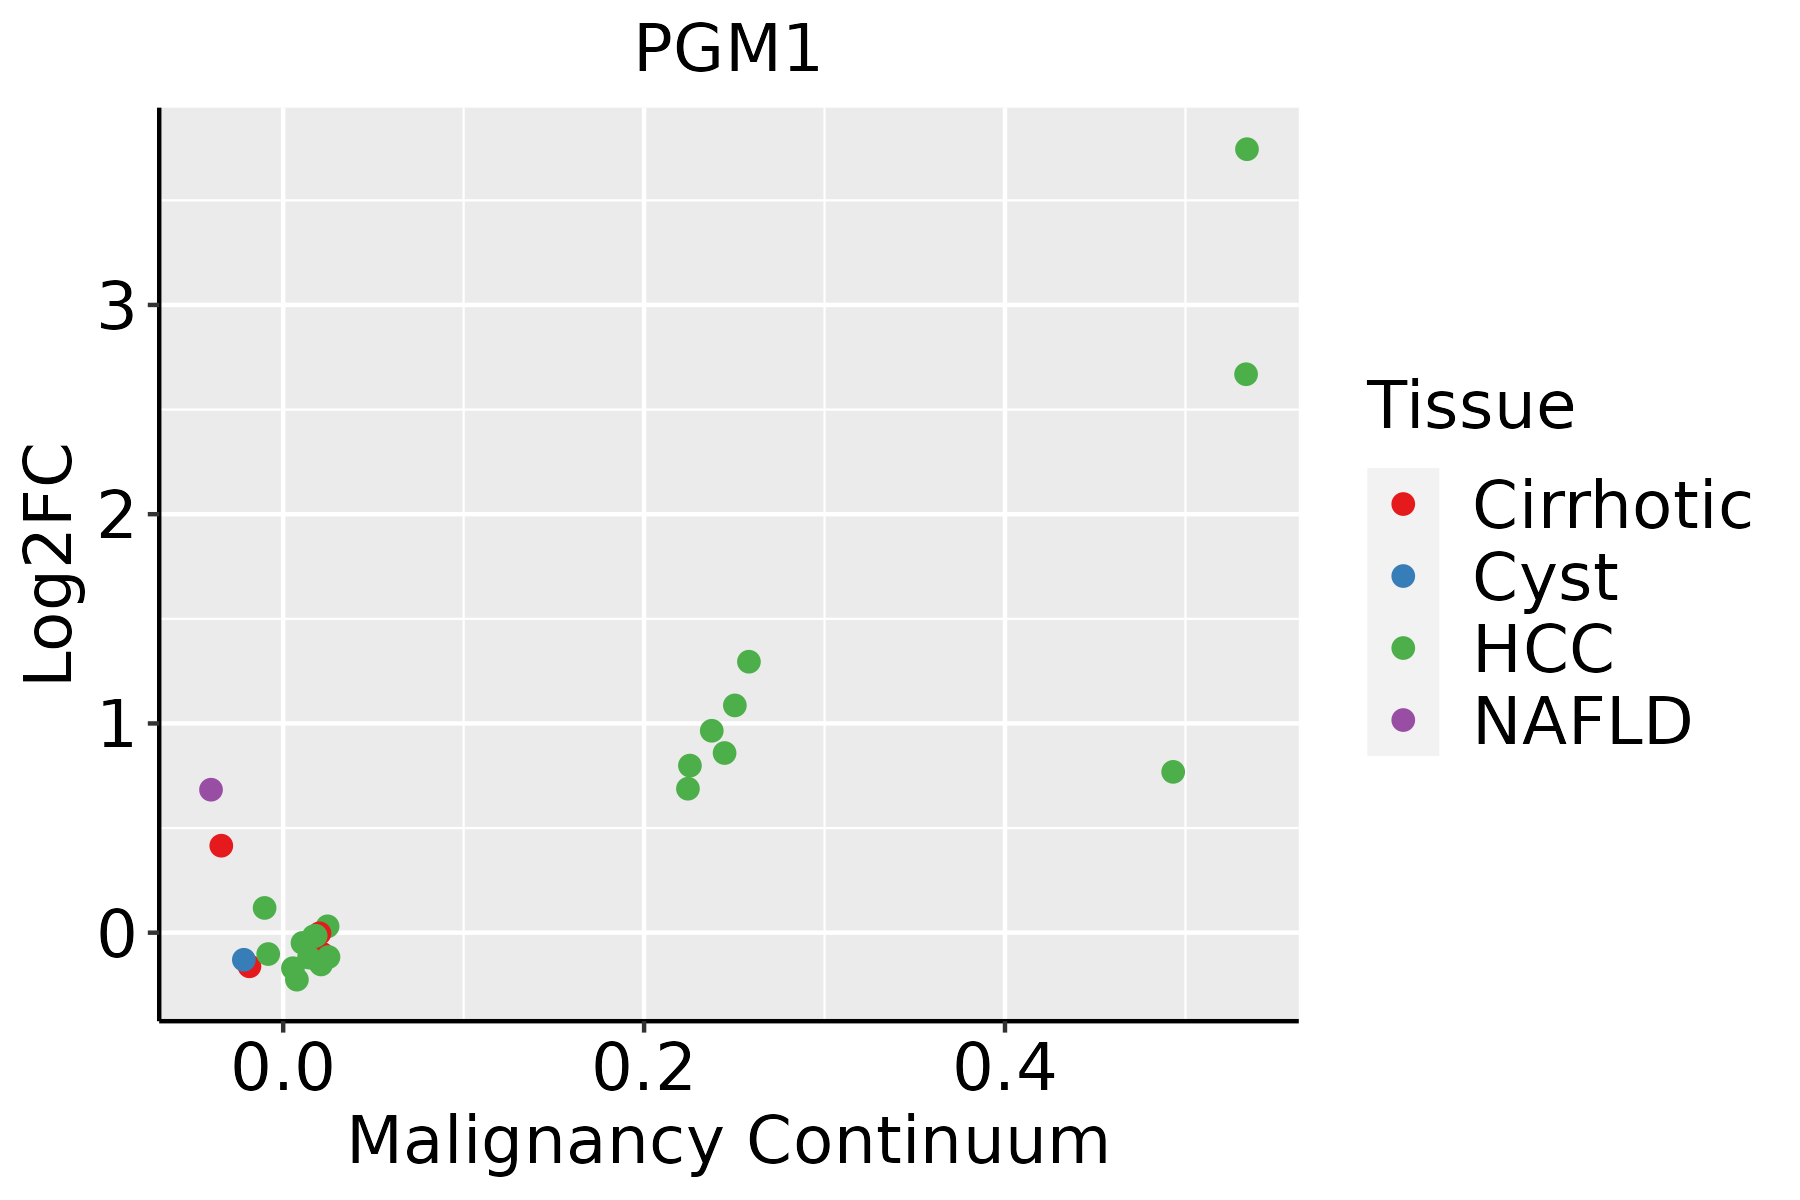 | HCC: Hepatocellular carcinoma |
| NAFLD: Non-alcoholic fatty liver disease |
| Oral Cavity |  | EOLP: Erosive Oral lichen planus |
| LP: leukoplakia |
| NEOLP: Non-erosive oral lichen planus |
| OSCC: Oral squamous cell carcinoma |
| Skin | 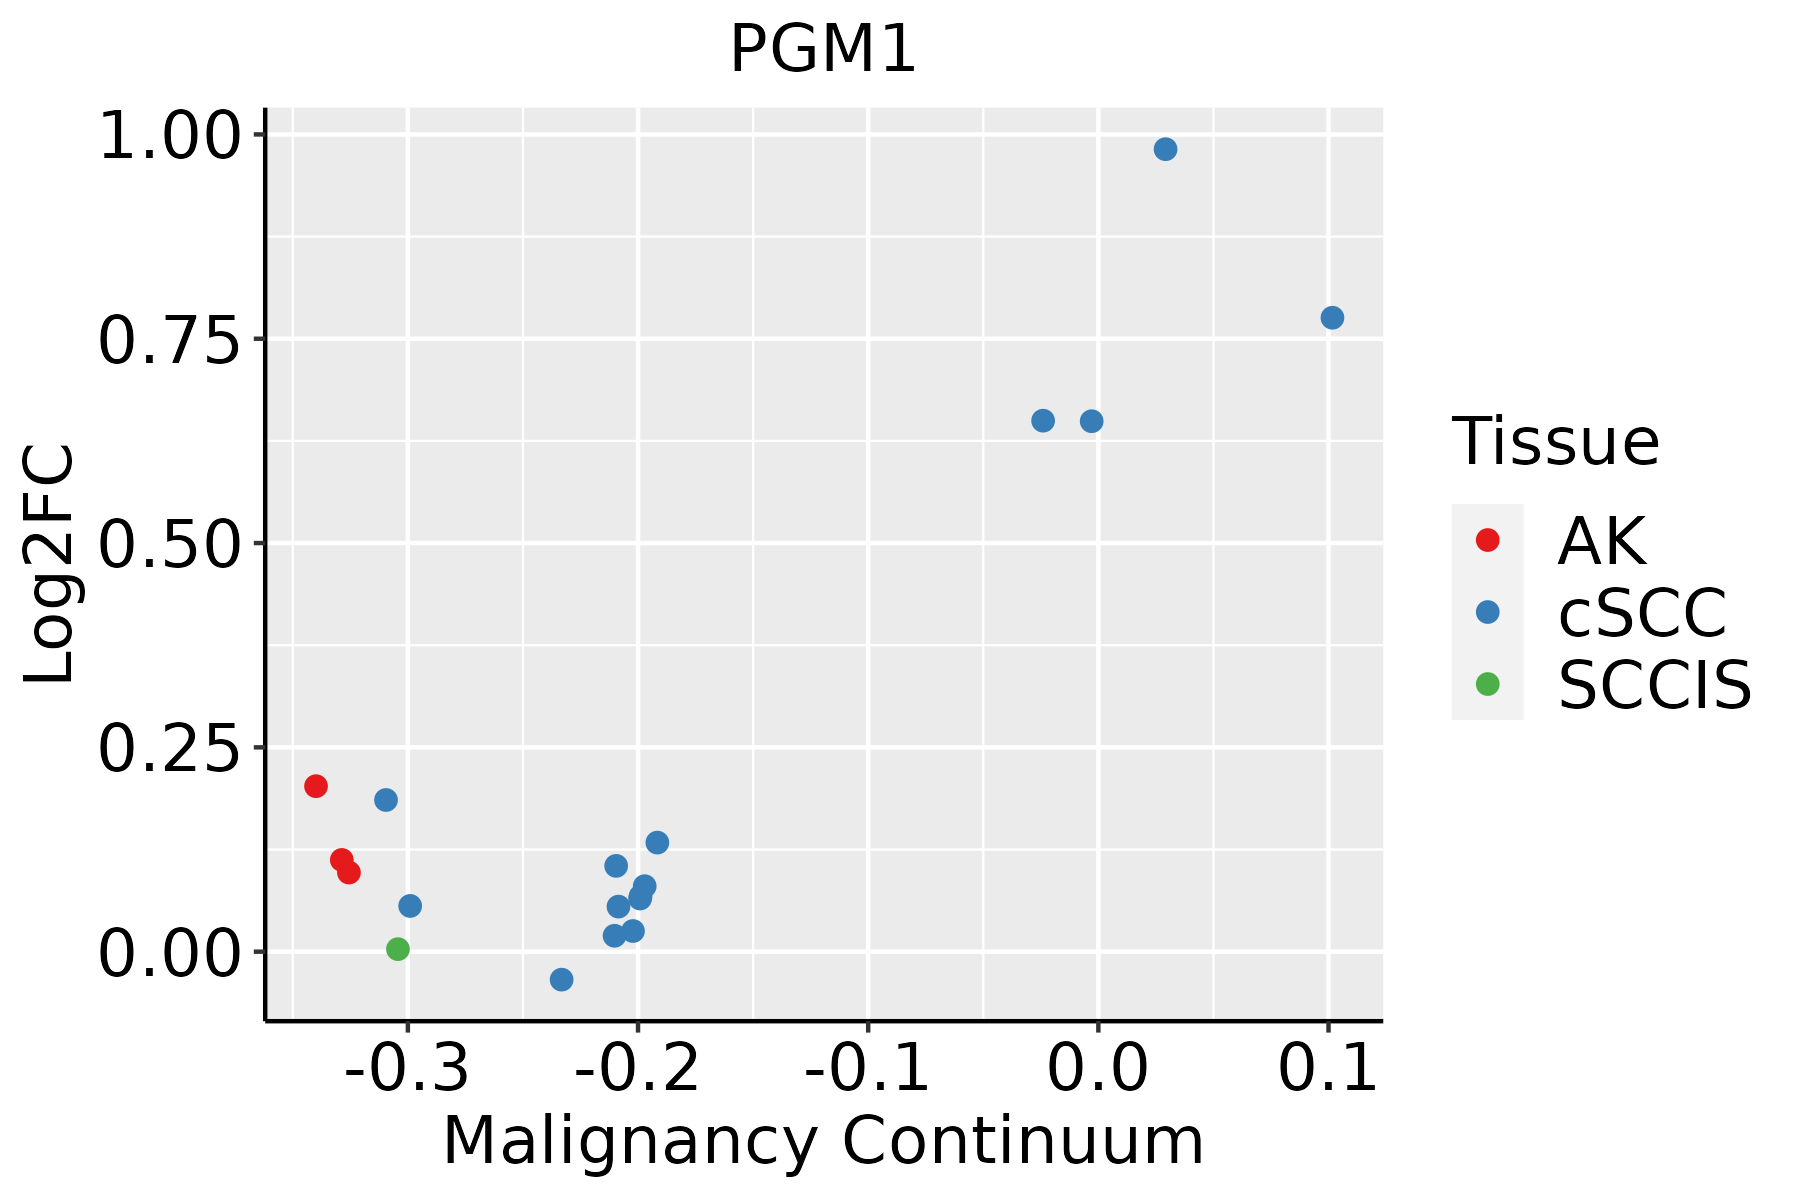 | AK: Actinic keratosis |
| cSCC: Cutaneous squamous cell carcinoma |
| SCCIS:squamous cell carcinoma in situ |
| Thyroid | 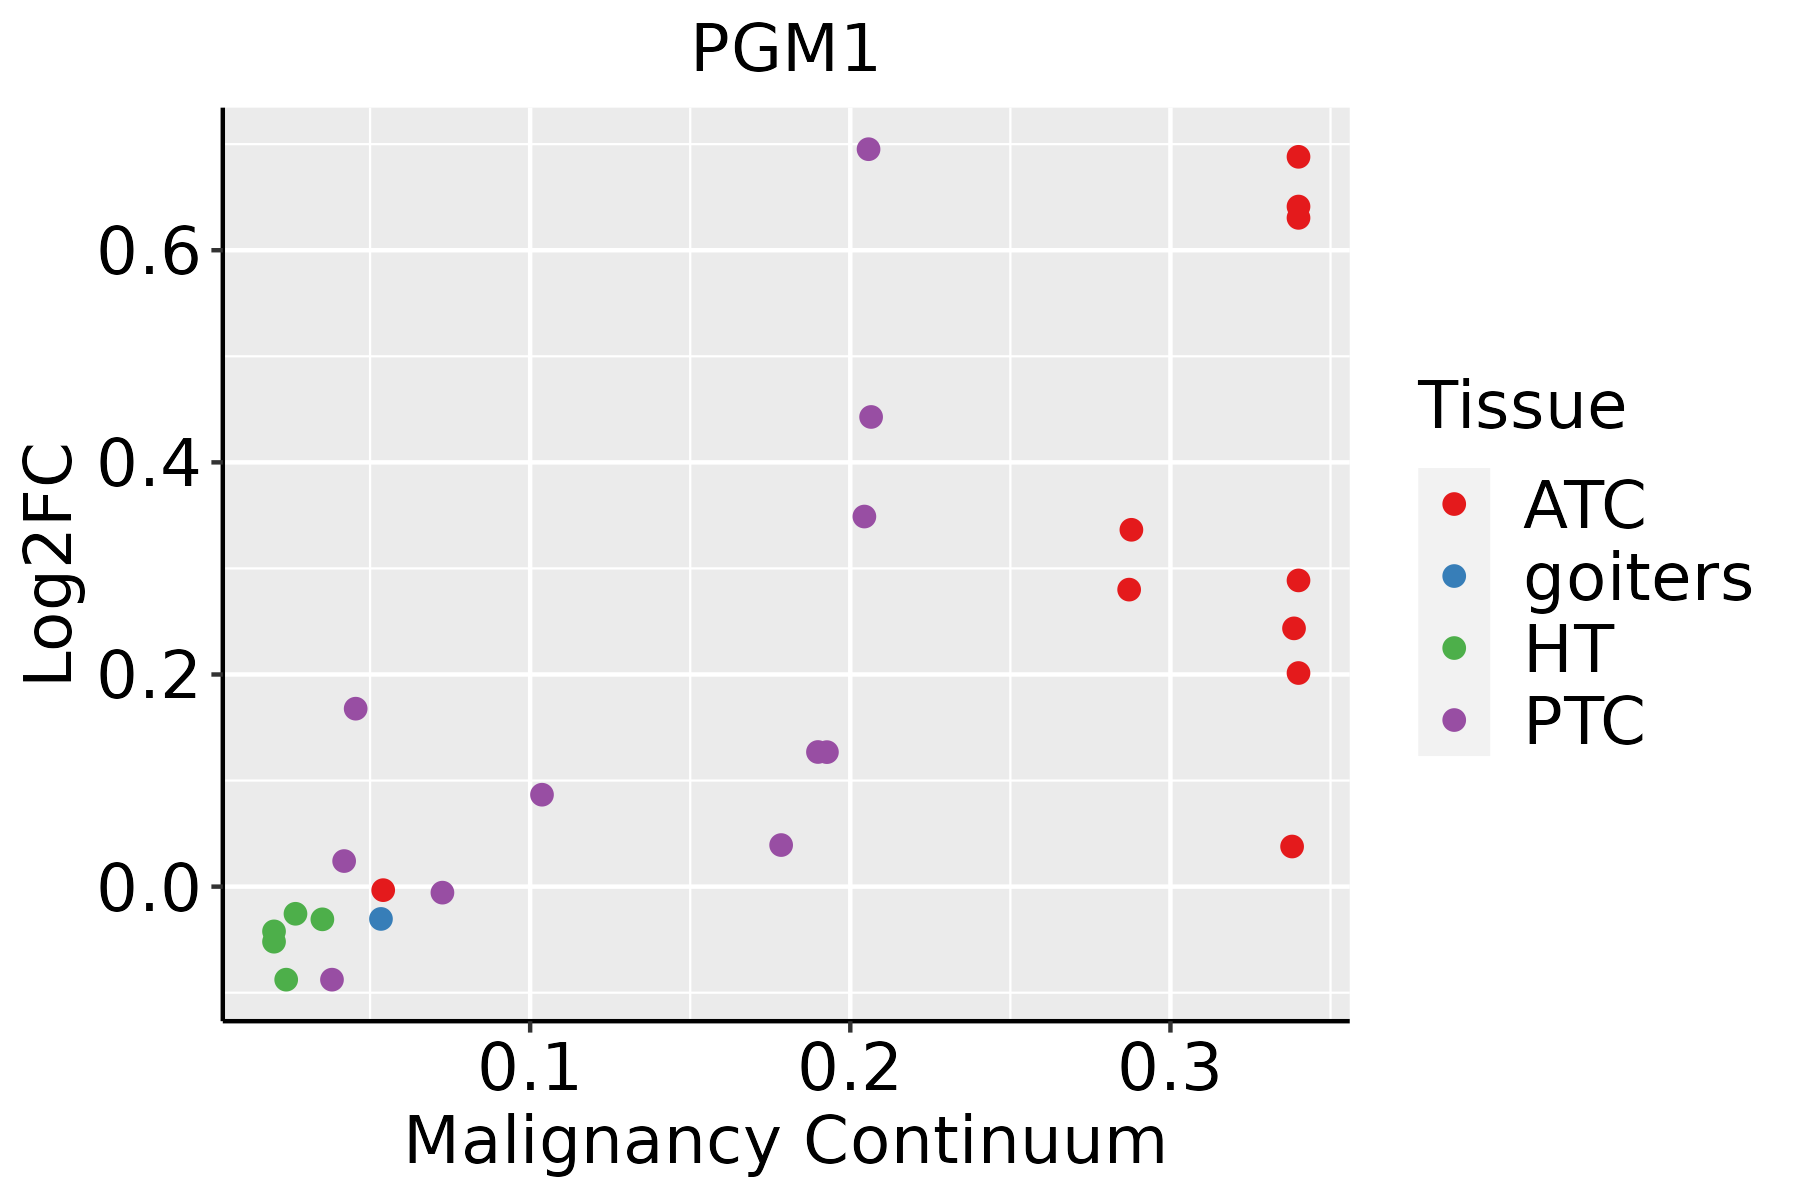 | ATC: Anaplastic thyroid cancer |
| HT: Hashimoto's thyroiditis |
| PTC: Papillary thyroid cancer |
| GO ID | Tissue | Disease Stage | Description | Gene Ratio | Bg Ratio | pvalue | p.adjust | Count |
| GO:0046034 | Colorectum | AD | ATP metabolic process | 142/3918 | 277/18723 | 2.64e-29 | 8.26e-26 | 142 |
| GO:0006091 | Colorectum | AD | generation of precursor metabolites and energy | 209/3918 | 490/18723 | 3.17e-28 | 6.61e-25 | 209 |
| GO:0009150 | Colorectum | AD | purine ribonucleotide metabolic process | 142/3918 | 368/18723 | 4.29e-15 | 1.17e-12 | 142 |
| GO:0006163 | Colorectum | AD | purine nucleotide metabolic process | 149/3918 | 396/18723 | 1.08e-14 | 2.80e-12 | 149 |
| GO:0072521 | Colorectum | AD | purine-containing compound metabolic process | 153/3918 | 416/18723 | 4.34e-14 | 1.01e-11 | 153 |
| GO:0009259 | Colorectum | AD | ribonucleotide metabolic process | 144/3918 | 385/18723 | 5.25e-14 | 1.13e-11 | 144 |
| GO:0019693 | Colorectum | AD | ribose phosphate metabolic process | 145/3918 | 396/18723 | 3.01e-13 | 5.71e-11 | 145 |
| GO:0009117 | Colorectum | AD | nucleotide metabolic process | 168/3918 | 489/18723 | 2.20e-12 | 3.36e-10 | 168 |
| GO:0006753 | Colorectum | AD | nucleoside phosphate metabolic process | 169/3918 | 497/18723 | 4.99e-12 | 6.98e-10 | 169 |
| GO:0009135 | Colorectum | AD | purine nucleoside diphosphate metabolic process | 47/3918 | 103/18723 | 1.61e-08 | 9.22e-07 | 47 |
| GO:0009179 | Colorectum | AD | purine ribonucleoside diphosphate metabolic process | 47/3918 | 103/18723 | 1.61e-08 | 9.22e-07 | 47 |
| GO:0006090 | Colorectum | AD | pyruvate metabolic process | 47/3918 | 106/18723 | 4.85e-08 | 2.55e-06 | 47 |
| GO:0009185 | Colorectum | AD | ribonucleoside diphosphate metabolic process | 47/3918 | 106/18723 | 4.85e-08 | 2.55e-06 | 47 |
| GO:0046031 | Colorectum | AD | ADP metabolic process | 41/3918 | 90/18723 | 1.37e-07 | 6.42e-06 | 41 |
| GO:0006096 | Colorectum | AD | glycolytic process | 38/3918 | 81/18723 | 1.52e-07 | 6.78e-06 | 38 |
| GO:0006757 | Colorectum | AD | ATP generation from ADP | 38/3918 | 82/18723 | 2.26e-07 | 9.37e-06 | 38 |
| GO:0009132 | Colorectum | AD | nucleoside diphosphate metabolic process | 49/3918 | 124/18723 | 1.75e-06 | 5.31e-05 | 49 |
| GO:0046939 | Colorectum | AD | nucleotide phosphorylation | 42/3918 | 101/18723 | 1.99e-06 | 5.92e-05 | 42 |
| GO:0016052 | Colorectum | AD | carbohydrate catabolic process | 56/3918 | 154/18723 | 7.01e-06 | 1.73e-04 | 56 |
| GO:0006165 | Colorectum | AD | nucleoside diphosphate phosphorylation | 40/3918 | 99/18723 | 8.02e-06 | 1.93e-04 | 40 |
| Pathway ID | Tissue | Disease Stage | Description | Gene Ratio | Bg Ratio | pvalue | p.adjust | qvalue | Count |
| hsa00010 | Colorectum | AD | Glycolysis / Gluconeogenesis | 34/2092 | 67/8465 | 3.63e-06 | 4.34e-05 | 2.77e-05 | 34 |
| hsa000101 | Colorectum | AD | Glycolysis / Gluconeogenesis | 34/2092 | 67/8465 | 3.63e-06 | 4.34e-05 | 2.77e-05 | 34 |
| hsa000106 | Colorectum | FAP | Glycolysis / Gluconeogenesis | 24/1404 | 67/8465 | 1.05e-04 | 9.46e-04 | 5.76e-04 | 24 |
| hsa01250 | Colorectum | FAP | Biosynthesis of nucleotide sugars | 13/1404 | 37/8465 | 4.79e-03 | 1.91e-02 | 1.16e-02 | 13 |
| hsa000107 | Colorectum | FAP | Glycolysis / Gluconeogenesis | 24/1404 | 67/8465 | 1.05e-04 | 9.46e-04 | 5.76e-04 | 24 |
| hsa012501 | Colorectum | FAP | Biosynthesis of nucleotide sugars | 13/1404 | 37/8465 | 4.79e-03 | 1.91e-02 | 1.16e-02 | 13 |
| hsa012502 | Colorectum | CRC | Biosynthesis of nucleotide sugars | 12/1091 | 37/8465 | 1.66e-03 | 1.20e-02 | 8.16e-03 | 12 |
| hsa012503 | Colorectum | CRC | Biosynthesis of nucleotide sugars | 12/1091 | 37/8465 | 1.66e-03 | 1.20e-02 | 8.16e-03 | 12 |
| hsa012505 | Esophagus | ESCC | Biosynthesis of nucleotide sugars | 28/4205 | 37/8465 | 1.10e-03 | 3.42e-03 | 1.75e-03 | 28 |
| hsa005202 | Esophagus | ESCC | Amino sugar and nucleotide sugar metabolism | 35/4205 | 49/8465 | 1.60e-03 | 4.88e-03 | 2.50e-03 | 35 |
| hsa0001016 | Esophagus | ESCC | Glycolysis / Gluconeogenesis | 42/4205 | 67/8465 | 2.15e-02 | 4.78e-02 | 2.45e-02 | 42 |
| hsa0125012 | Esophagus | ESCC | Biosynthesis of nucleotide sugars | 28/4205 | 37/8465 | 1.10e-03 | 3.42e-03 | 1.75e-03 | 28 |
| hsa0052011 | Esophagus | ESCC | Amino sugar and nucleotide sugar metabolism | 35/4205 | 49/8465 | 1.60e-03 | 4.88e-03 | 2.50e-03 | 35 |
| hsa0001017 | Esophagus | ESCC | Glycolysis / Gluconeogenesis | 42/4205 | 67/8465 | 2.15e-02 | 4.78e-02 | 2.45e-02 | 42 |
| hsa000109 | Liver | Cirrhotic | Glycolysis / Gluconeogenesis | 32/2530 | 67/8465 | 1.50e-03 | 7.80e-03 | 4.81e-03 | 32 |
| hsa00030 | Liver | Cirrhotic | Pentose phosphate pathway | 16/2530 | 30/8465 | 6.04e-03 | 2.12e-02 | 1.30e-02 | 16 |
| hsa0001012 | Liver | Cirrhotic | Glycolysis / Gluconeogenesis | 32/2530 | 67/8465 | 1.50e-03 | 7.80e-03 | 4.81e-03 | 32 |
| hsa000301 | Liver | Cirrhotic | Pentose phosphate pathway | 16/2530 | 30/8465 | 6.04e-03 | 2.12e-02 | 1.30e-02 | 16 |
| hsa0001022 | Liver | HCC | Glycolysis / Gluconeogenesis | 43/4020 | 67/8465 | 4.26e-03 | 1.29e-02 | 7.15e-03 | 43 |
| hsa000302 | Liver | HCC | Pentose phosphate pathway | 21/4020 | 30/8465 | 1.06e-02 | 2.71e-02 | 1.51e-02 | 21 |
| Hugo Symbol | Variant Class | Variant Classification | dbSNP RS | HGVSc | HGVSp | HGVSp Short | SWISSPROT | BIOTYPE | SIFT | PolyPhen | Tumor Sample Barcode | Tissue | Histology | Sex | Age | Stage | Therapy Types | Drugs | Outcome |
| PGM1 | SNV | Missense_Mutation | novel | c.231N>G | p.Ile77Met | p.I77M | P36871 | protein_coding | tolerated(1) | benign(0.04) | TCGA-AC-A6IW-01 | Breast | breast invasive carcinoma | Female | >=65 | I/II | Unknown | Unknown | SD |
| PGM1 | SNV | Missense_Mutation | novel | c.1106C>T | p.Ala369Val | p.A369V | P36871 | protein_coding | tolerated(0.15) | benign(0.028) | TCGA-AN-A046-01 | Breast | breast invasive carcinoma | Female | >=65 | I/II | Unknown | Unknown | SD |
| PGM1 | SNV | Missense_Mutation | rs748304901 | c.716N>A | p.Arg239His | p.R239H | P36871 | protein_coding | tolerated(0.56) | benign(0.033) | TCGA-AN-A0FZ-01 | Breast | breast invasive carcinoma | Female | <65 | III/IV | Unknown | Unknown | SD |
| PGM1 | SNV | Missense_Mutation | novel | c.1198N>T | p.Gly400Cys | p.G400C | P36871 | protein_coding | deleterious(0) | probably_damaging(0.999) | TCGA-D8-A73W-01 | Breast | breast invasive carcinoma | Female | >=65 | III/IV | Hormone Therapy | tamoxiphen | PD |
| PGM1 | insertion | Nonsense_Mutation | novel | c.116_117insCTTCAAATACAAAGGACTTAAACTGCTTCCCTAAAAAC | p.Leu40PhefsTer11 | p.L40Ffs*11 | P36871 | protein_coding | | | TCGA-AN-A03X-01 | Breast | breast invasive carcinoma | Female | >=65 | I/II | Unknown | Unknown | SD |
| PGM1 | deletion | Frame_Shift_Del | novel | c.1517delA | p.Gln506ArgfsTer17 | p.Q506Rfs*17 | P36871 | protein_coding | | | TCGA-EW-A2FV-01 | Breast | breast invasive carcinoma | Female | <65 | III/IV | Chemotherapy | docetaxel | SD |
| PGM1 | SNV | Missense_Mutation | | c.1233G>T | p.Trp411Cys | p.W411C | P36871 | protein_coding | deleterious(0) | probably_damaging(1) | TCGA-DS-A1OC-01 | Cervix | cervical & endocervical cancer | Female | <65 | I/II | Chemotherapy | gemcitabine | SD |
| PGM1 | SNV | Missense_Mutation | rs201303497 | c.1366N>A | p.Ala456Thr | p.A456T | P36871 | protein_coding | deleterious(0.03) | possibly_damaging(0.786) | TCGA-EA-A3HS-01 | Cervix | cervical & endocervical cancer | Female | <65 | I/II | Unknown | Unknown | SD |
| PGM1 | SNV | Missense_Mutation | novel | c.205N>C | p.Asp69His | p.D69H | P36871 | protein_coding | deleterious(0.01) | benign(0.015) | TCGA-VS-A8EK-01 | Cervix | cervical & endocervical cancer | Female | >=65 | I/II | Chemotherapy | cisplatin | PD |
| PGM1 | SNV | Missense_Mutation | | c.391N>G | p.Ile131Val | p.I131V | P36871 | protein_coding | tolerated(0.22) | benign(0.168) | TCGA-AA-3877-01 | Colorectum | colon adenocarcinoma | Female | >=65 | I/II | Unknown | Unknown | SD |


