
|
|||||
|
 | |
| |
| |
| |
| |
| |
|
Gene: PGLYRP4 |
Gene summary for PGLYRP4 |
| Gene information | Species | Human | Gene symbol | PGLYRP4 | Gene ID | 57115 |
| Gene name | peptidoglycan recognition protein 4 | |
| Gene Alias | PGLYRPIbeta | |
| Cytomap | 1q21.3 | |
| Gene Type | protein-coding | GO ID | GO:0000270 | UniProtAcc | Q96LB8 |
Top |
Malignant transformation analysis |
| Identification of the aberrant gene expression in precancerous and cancerous lesions by comparing the gene expression of stem-like cells in diseased tissues with normal stem cells |
| Entrez ID | Symbol | Replicates | Species | Organ | Tissue | Adj P-value | Log2FC | Malignancy |
| 57115 | PGLYRP4 | LZE20T | Human | Esophagus | ESCC | 1.26e-02 | 1.31e-01 | 0.0662 |
| 57115 | PGLYRP4 | P20T-E | Human | Esophagus | ESCC | 8.24e-04 | 1.34e-01 | 0.1124 |
| 57115 | PGLYRP4 | P23T-E | Human | Esophagus | ESCC | 6.53e-09 | 3.04e-01 | 0.108 |
| 57115 | PGLYRP4 | P24T-E | Human | Esophagus | ESCC | 3.50e-02 | 8.88e-02 | 0.1287 |
| 57115 | PGLYRP4 | P27T-E | Human | Esophagus | ESCC | 2.05e-07 | 2.29e-01 | 0.1055 |
| 57115 | PGLYRP4 | P30T-E | Human | Esophagus | ESCC | 4.84e-02 | 1.61e-01 | 0.137 |
| 57115 | PGLYRP4 | P31T-E | Human | Esophagus | ESCC | 4.44e-08 | 2.25e-01 | 0.1251 |
| 57115 | PGLYRP4 | P36T-E | Human | Esophagus | ESCC | 3.95e-12 | 4.97e-01 | 0.1187 |
| 57115 | PGLYRP4 | P42T-E | Human | Esophagus | ESCC | 1.03e-12 | 3.79e-01 | 0.1175 |
| 57115 | PGLYRP4 | P49T-E | Human | Esophagus | ESCC | 2.24e-09 | 5.72e-01 | 0.1768 |
| 57115 | PGLYRP4 | P74T-E | Human | Esophagus | ESCC | 1.02e-05 | 3.04e-01 | 0.1479 |
| 57115 | PGLYRP4 | P76T-E | Human | Esophagus | ESCC | 8.84e-05 | 1.57e-01 | 0.1207 |
| 57115 | PGLYRP4 | P80T-E | Human | Esophagus | ESCC | 2.86e-35 | 1.05e+00 | 0.155 |
| 57115 | PGLYRP4 | P82T-E | Human | Esophagus | ESCC | 2.70e-02 | 3.35e-01 | 0.1072 |
| 57115 | PGLYRP4 | P83T-E | Human | Esophagus | ESCC | 8.81e-14 | 4.58e-01 | 0.1738 |
| 57115 | PGLYRP4 | P89T-E | Human | Esophagus | ESCC | 4.92e-14 | 9.39e-01 | 0.1752 |
| 57115 | PGLYRP4 | P91T-E | Human | Esophagus | ESCC | 2.11e-02 | 3.63e-01 | 0.1828 |
| Page: 1 |
| Tissue | Expression Dynamics | Abbreviation |
| Esophagus | 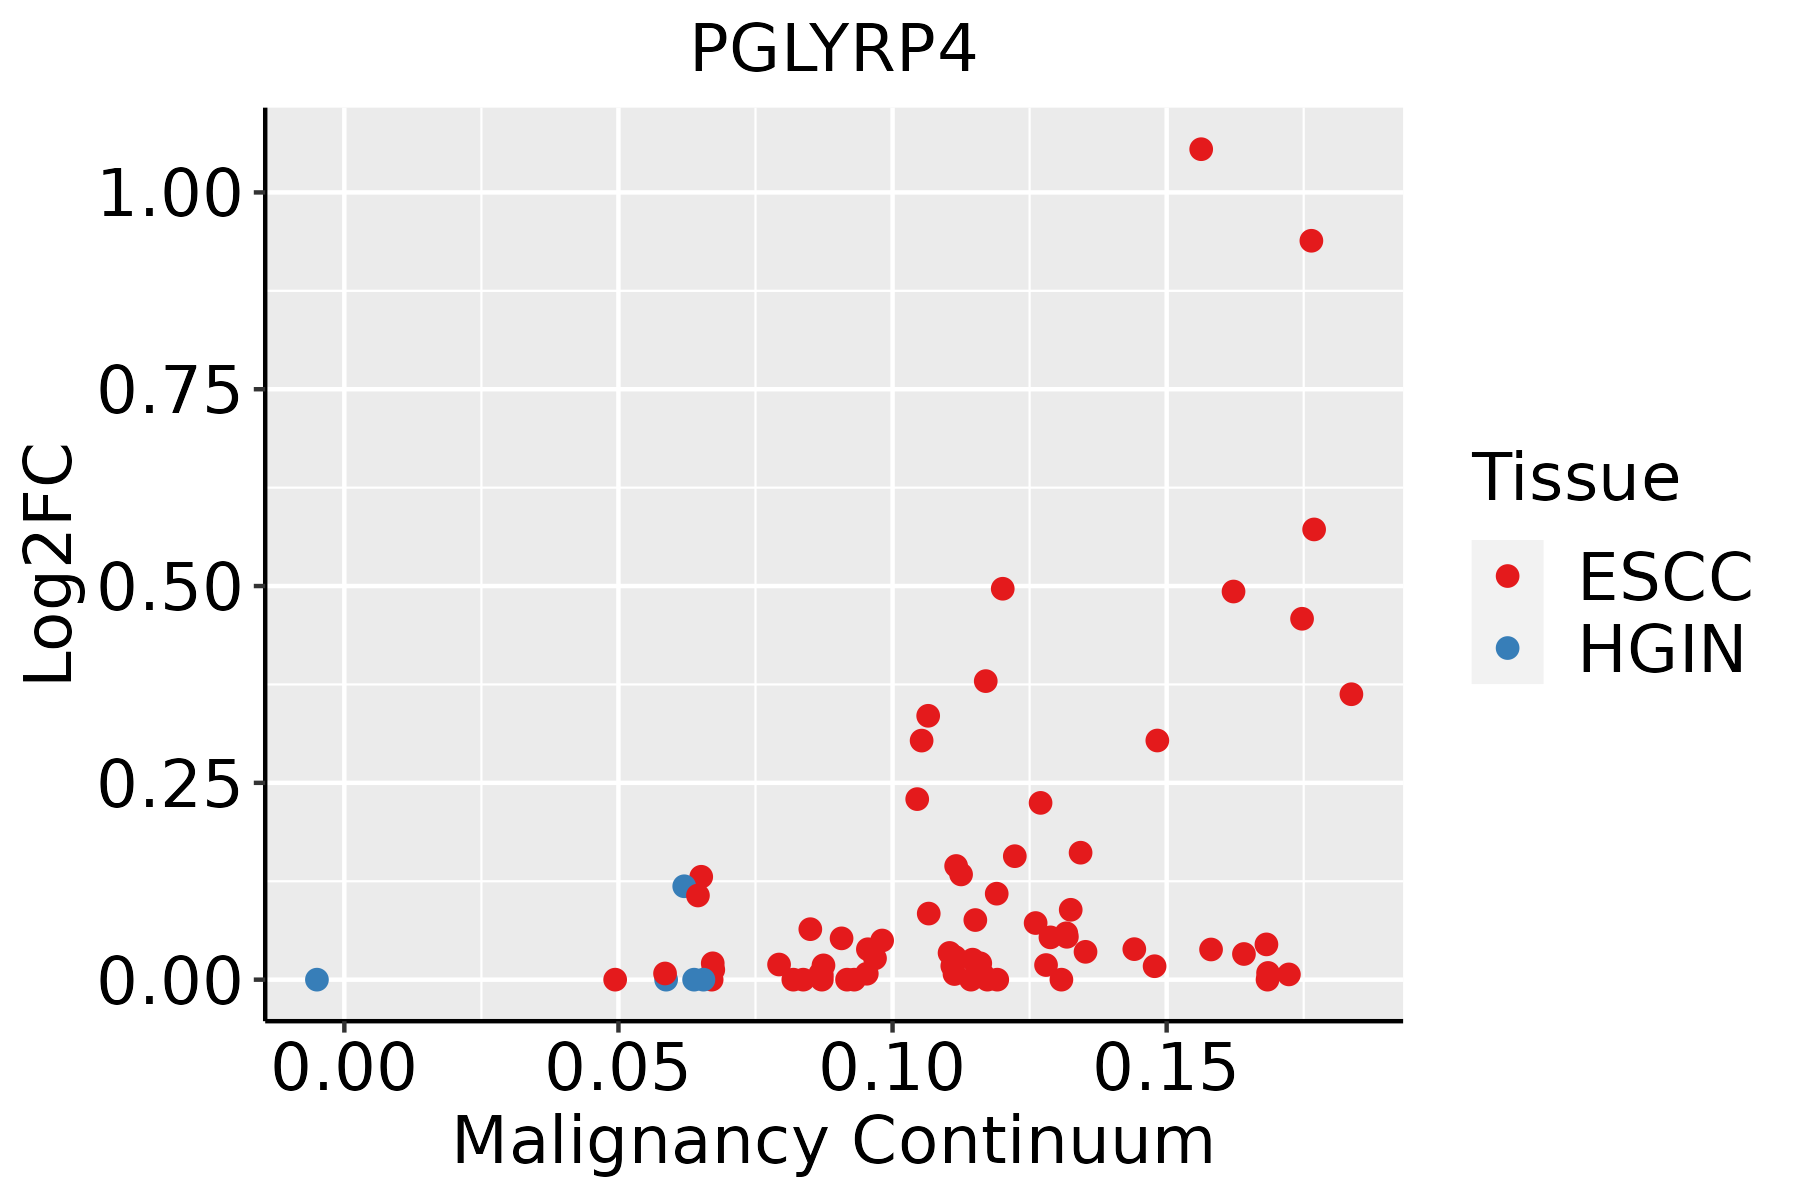 | ESCC: Esophageal squamous cell carcinoma |
| HGIN: High-grade intraepithelial neoplasias | ||
| LGIN: Low-grade intraepithelial neoplasias |
| ∗log2FC in expression of this searched gene in stem-like cells from each diseased tissue sample relative to stem-like cells in normal samples in each tissue plotted against the malignancy continuum. Samples are colored based on if they are from different disease stage. |
Top |
Malignant transformation related pathway analysis |
| Find out the enriched GO biological processes and KEGG pathways involved in transition from healthy to precancer to cancer |
| Tissue | Disease Stage | Enriched GO biological Processes |
| Colorectum | AD |  |
| Colorectum | SER |  |
| Colorectum | MSS |  |
| Colorectum | MSI-H |  |
| Colorectum | FAP |  |
| ∗Top 15 enriched GO BP terms are showed in the bar plot of each disease state in each tissue. Each row represents a significant GO biological process which is colored according to the -log10(p.adjust). |
| Page: 1 2 3 4 5 6 7 8 9 |
| GO ID | Tissue | Disease Stage | Description | Gene Ratio | Bg Ratio | pvalue | p.adjust | Count |
| GO:19011362 | Esophagus | ESCC | carbohydrate derivative catabolic process | 99/8552 | 172/18723 | 1.11e-03 | 5.54e-03 | 99 |
| Page: 1 |
| Pathway ID | Tissue | Disease Stage | Description | Gene Ratio | Bg Ratio | pvalue | p.adjust | qvalue | Count |
| Page: 1 |
Top |
Cell-cell communication analysis |
| Identification of potential cell-cell interactions between two cell types and their ligand-receptor pairs for different disease states |
| Ligand | Receptor | LRpair | Pathway | Tissue | Disease Stage |
| Page: 1 |
Top |
Single-cell gene regulatory network inference analysis |
| Find out the significant the regulons (TFs) and the target genes of each regulon across cell types for different disease states |
| TF | Cell Type | Tissue | Disease Stage | Target Gene | RSS | Regulon Activity |
| ∗The dot plots of a searched regulon are shown for all cell subpopulations in each disease state of each tissue based on the regulon specific score inferred using pySCENIC and by calculating the average expression. |
| Page: 1 |
Top |
Somatic mutation of malignant transformation related genes |
| Annotation of somatic variants for genes involved in malignant transformation |
| Hugo Symbol | Variant Class | Variant Classification | dbSNP RS | HGVSc | HGVSp | HGVSp Short | SWISSPROT | BIOTYPE | SIFT | PolyPhen | Tumor Sample Barcode | Tissue | Histology | Sex | Age | Stage | Therapy Types | Drugs | Outcome |
| PGLYRP4 | SNV | Missense_Mutation | c.59C>A | p.Ser20Tyr | p.S20Y | Q96LB8 | protein_coding | deleterious_low_confidence(0.01) | benign(0.1) | TCGA-AC-A23H-01 | Breast | breast invasive carcinoma | Female | >=65 | I/II | Unknown | Unknown | PD | |
| PGLYRP4 | deletion | Frame_Shift_Del | novel | c.81delA | p.Lys27AsnfsTer46 | p.K27Nfs*46 | Q96LB8 | protein_coding | TCGA-D8-A27V-01 | Breast | breast invasive carcinoma | Female | <65 | I/II | Hormone Therapy | tamoxiphen | SD | ||
| PGLYRP4 | SNV | Missense_Mutation | c.795C>G | p.Asp265Glu | p.D265E | Q96LB8 | protein_coding | tolerated(0.06) | benign(0.262) | TCGA-MU-A5YI-01 | Cervix | cervical & endocervical cancer | Female | <65 | I/II | Unknown | Unknown | PD | |
| PGLYRP4 | SNV | Missense_Mutation | rs547753918 | c.847N>A | p.Ala283Thr | p.A283T | Q96LB8 | protein_coding | tolerated(0.61) | benign(0.097) | TCGA-ZJ-AB0I-01 | Cervix | cervical & endocervical cancer | Female | <65 | I/II | Unknown | Unknown | SD |
| PGLYRP4 | SNV | Missense_Mutation | novel | c.985N>A | p.Leu329Met | p.L329M | Q96LB8 | protein_coding | deleterious(0) | probably_damaging(1) | TCGA-5M-AAT6-01 | Colorectum | colon adenocarcinoma | Female | <65 | III/IV | Unknown | Unknown | PD |
| PGLYRP4 | SNV | Missense_Mutation | c.1058G>T | p.Arg353Leu | p.R353L | Q96LB8 | protein_coding | deleterious(0.02) | benign(0.038) | TCGA-AA-3510-01 | Colorectum | colon adenocarcinoma | Male | >=65 | I/II | Unknown | Unknown | SD | |
| PGLYRP4 | SNV | Missense_Mutation | c.580N>A | p.Gly194Ser | p.G194S | Q96LB8 | protein_coding | tolerated(0.67) | benign(0.038) | TCGA-AA-3930-01 | Colorectum | colon adenocarcinoma | Male | >=65 | III/IV | Chemotherapy | capecitabine | PD | |
| PGLYRP4 | SNV | Missense_Mutation | rs148847664 | c.811N>A | p.Asp271Asn | p.D271N | Q96LB8 | protein_coding | deleterious(0.03) | probably_damaging(0.961) | TCGA-AA-A010-01 | Colorectum | colon adenocarcinoma | Female | <65 | I/II | Chemotherapy | folinic | CR |
| PGLYRP4 | SNV | Missense_Mutation | rs200799317 | c.634N>A | p.Gly212Ser | p.G212S | Q96LB8 | protein_coding | tolerated(0.94) | benign(0) | TCGA-AA-A01R-01 | Colorectum | colon adenocarcinoma | Male | <65 | III/IV | Chemotherapy | 5-fluorouracil | PD |
| PGLYRP4 | SNV | Missense_Mutation | c.536A>T | p.Lys179Met | p.K179M | Q96LB8 | protein_coding | deleterious(0) | probably_damaging(0.982) | TCGA-CK-4951-01 | Colorectum | colon adenocarcinoma | Female | >=65 | I/II | Unknown | Unknown | PD |
| Page: 1 2 3 4 5 |
Top |
Related drugs of malignant transformation related genes |
| Identification of chemicals and drugs interact with genes involved in malignant transfromation |
| (DGIdb 4.0) |
| Entrez ID | Symbol | Category | Interaction Types | Drug Claim Name | Drug Name | PMIDs |
| 57115 | PGLYRP4 | DRUGGABLE GENOME | Tumor necrosis factor alpha (TNF-alpha) inhibitors | 27670765 |
| Page: 1 |

Copyright 2023-Present -The University of Texas Health Science Center at Houston |